
Dear Gate Square readers,
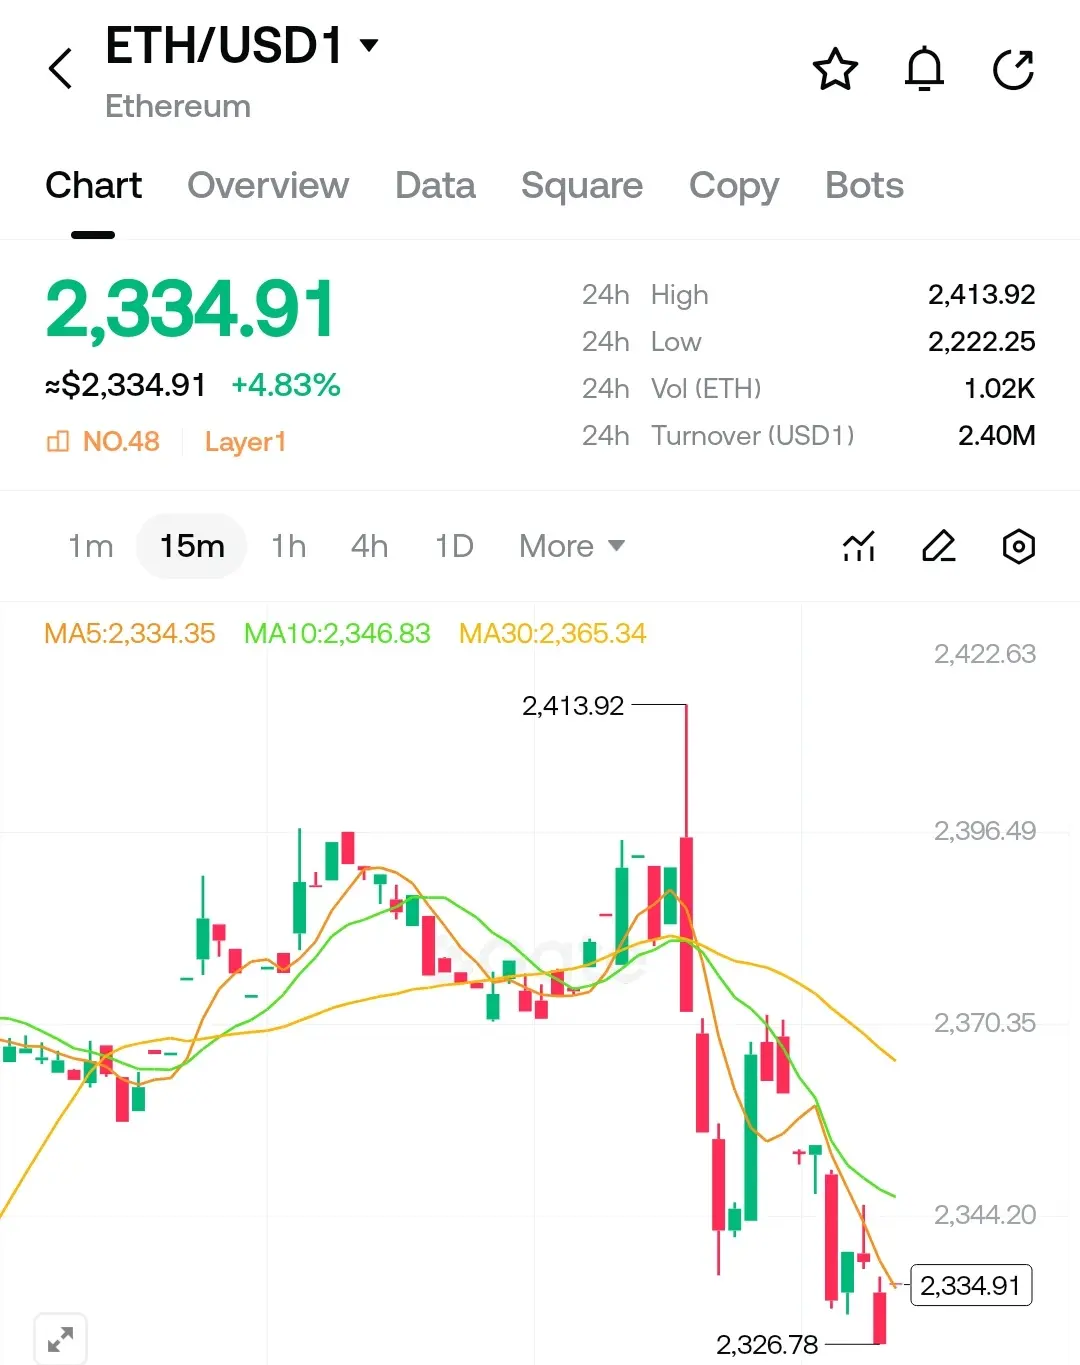
As of April 2026, the cryptocurrency market is showing strong signs of recovery after the correction following its peak in 2025. The total market capitalization is hovering around $2.51 trillion, recording a 1.01% increase in the last 24 hours. Bitcoin (BTC) is trading around $74,380, showing a 1.47% increase in 24 hours and a 7.14% increase in the last 7 days. Ethereum (ETH) is trading at $2,319, showing a 2.73% increase in 24 hours and a 9.39% increase in 7 days. Bitcoin dominance remains at 59.3%, while the Fear & Greed Index is at 53/100 (neutral). These figures indicate that the market is in a balanced recovery phase, described as a "Goldilocks rally."
From the 2025 Peak to the 2026 Reset
Bitcoin's decline from its record high of $127,000 in October 2025 to the $60,000 range in the first quarter of 2026 reflected a "reset" process seen in classic cycles. This correction, combined with the 12–18 month lagged effects of the April 2024 halving, was triggered by liquidity tightening and macroeconomic uncertainty.
However, the momentum shifted in March 2026 with strong net inflows into US spot Bitcoin ETFs (the first monthly positive flow since October 2025). Daily inflows in early April (e.g., $471 million on April 7th) reinforced this recovery and consolidated BTC in the $70,000–$75,000 range.
The market is no longer experiencing a "classic bull year," but rather a more mature and institutional transition period. According to analysts, 2026 will not be a bull cycle in the truest sense, but rather a year of “structural growth” and “post-reset momentum.”
Key Drivers Triggering the Recovery
1. Institutional Participation and ETF Flows:
US spot Bitcoin ETFs have recorded cumulative inflows exceeding $53 billion. Large-scale funds have seen record daily flows in recent weeks. These flows are bringing liquidity to the institutional level and reducing retail-focused volatility.
2. Institutional Adoption and Infrastructure Developments:
Developments such as traditional financial institutions taking stakes in crypto platforms, payment networks running validator nodes on blockchain infrastructure, and the integration of zero-knowledge proofs into major blockchain networks are accelerating the convergence of traditional finance and crypto. Additionally, new wallet solutions are facilitating the use of stablecoins and tokenized assets.
3. Macro and Cyclical Factors:
The softening of interest rate hike expectations by major central banks has reduced global risk pressure. Macroeconomic factors such as interest rates and liquidity conditions are expected to be key catalysts for the next major cycle. With the maturation of the halving cycle, a more significant upward movement can be expected in Q2–Q4 2026.
4. Altcoin Dynamics:
Ethereum has recently outperformed Bitcoin. However, altcoins in general are still lagging behind major assets. While some niche and speculative projects are experiencing short-term booms, the broader market is shifting toward “quality growth.”
Risks and Considerations
While the recovery appears strong, several risks remain:
Continued underperformance of altcoins,
Geopolitical tensions and inflationary pressures,
Early profit-taking behavior.
The market still reflects a "transition year" dynamic; 2026 may not deliver a single, sustained bull run, but it offers strategic opportunities.
A Mature and Institutional Recovery Period
As of April 2026, the crypto market is undergoing a more stable and structured recovery, far removed from the excessive enthusiasm of the 2025 peak. Institutional ETF inflows, infrastructure developments, and cyclical timing are aligning to support a new phase of growth. This may mark the beginning of a bull cycle driven by “use cases rather than speculation.”
Recommendation for investors:
Viewing volatility as an opportunity, diversifying portfolios, and focusing on long-term adoption trends remain essential. Crypto is evolving beyond speculation and becoming an integral part of the global financial system.
As the Gate Square community, we will continue to closely follow this recovery process. Your insights and analyses are valuable to us—share your thoughts and let’s shape the future of crypto together.
Note: This article is not investment advice. Please conduct your own research and act according to your risk tolerance.
$BTC $ETH $RAVE
#CryptoMarketRecovery