This price volatility is not an isolated event. Over the past three weeks, a memorandum of understanding recently signed between the U.S. and Iran has effectively broken down. The two sides’ military actions have escalated from sporadic mutual strikes into a sustained armed conflict. A clear transmission chain is forming between oil prices and interest rate expectations: geopolitical shocks push energy prices higher, elevated energy prices increase inflation expectations, and rising inflation expectations compel the Federal Reserve to reassess monetary policy. This article traces that transmission chain to analyze the logic and data basis behind each link.
Strait of Hormuz: How a Strait Can Move Global Energy Pricing
The immediate trigger for the oil price surge on July 14 was a series of aggressive actions by the U.S. government in the Middle East. On July 13, the U.S. Central Command announced that, at the president’s direction, the U.S. would resume a maritime blockade of Iran starting at 16:00 U.S. Eastern Time on July 14. On the same day, Trump stated on social media that the U.S. would impose a 20% fee on all goods transported through the Strait of Hormuz. Previously, U.S. forces had conducted airstrikes on targets inside Iran for three consecutive nights. In response, in the early hours of July 14, Iranian forces launched suicide drones to attack U.S. military targets in Kuwait and fired cruise missiles at U.S. warships.
The strategic importance of the Strait of Hormuz needs no elaboration. This narrow waterway connecting the Persian Gulf and the Indian Ocean transports roughly one-third of the world’s seaborne oil shipments. Any sign of disruption would quickly translate into a risk premium, which is reflected in crude oil futures prices. Data from maritime analysis firm Warnford shows that the number of vessels transiting the Strait of Hormuz fell from 43 on July 8 to 17 on July 12. Shipping data provider Kpler reports even more severe declines—only 6 vessels passed through the strait last Sunday. Compared with the average daily transit of about 130 vessels before the conflict, this decline indicates that the risk of a real supply disruption is increasing.
Notably, this is not the first time such tensions have arisen between the U.S. and Iran. On June 17, the two countries’ presidents signed a memorandum of understanding remotely, after which the U.S. lifted its maritime blockade of Iran. However, this ceasefire lasted less than a month. On July 8, Trump stated at a NATO summit that he believed the memorandum was “over.” From the price trajectory, markets have established a pattern: after the June memorandum, Brent crude fell from $78 to around $72; after the conflict resumed, it rebounded to $79. The $72 to $79 range reflects the market’s valuation of a “fight-and-talk” controlled escalation between the U.S. and Iran.
However, the July 14 market action shows that this range is being broken. WTI crude’s intraday high reached $80.43, and Brent crude had already risen to around $85 during Asian trading hours. IG market analysts noted that the earlier rally was “relatively moderate,” indicating that the market viewed the conflict as an escalation within a “fragile ceasefire framework.” Yet, once either side breaks the tacit understanding of “controlled escalation”—for example, if Iran truly hits U.S. destroyers, or if the U.S. destroys Iran’s oil export terminals—the market will need to reassess the risk premium, and the rally could extend far beyond a single-digit percentage.
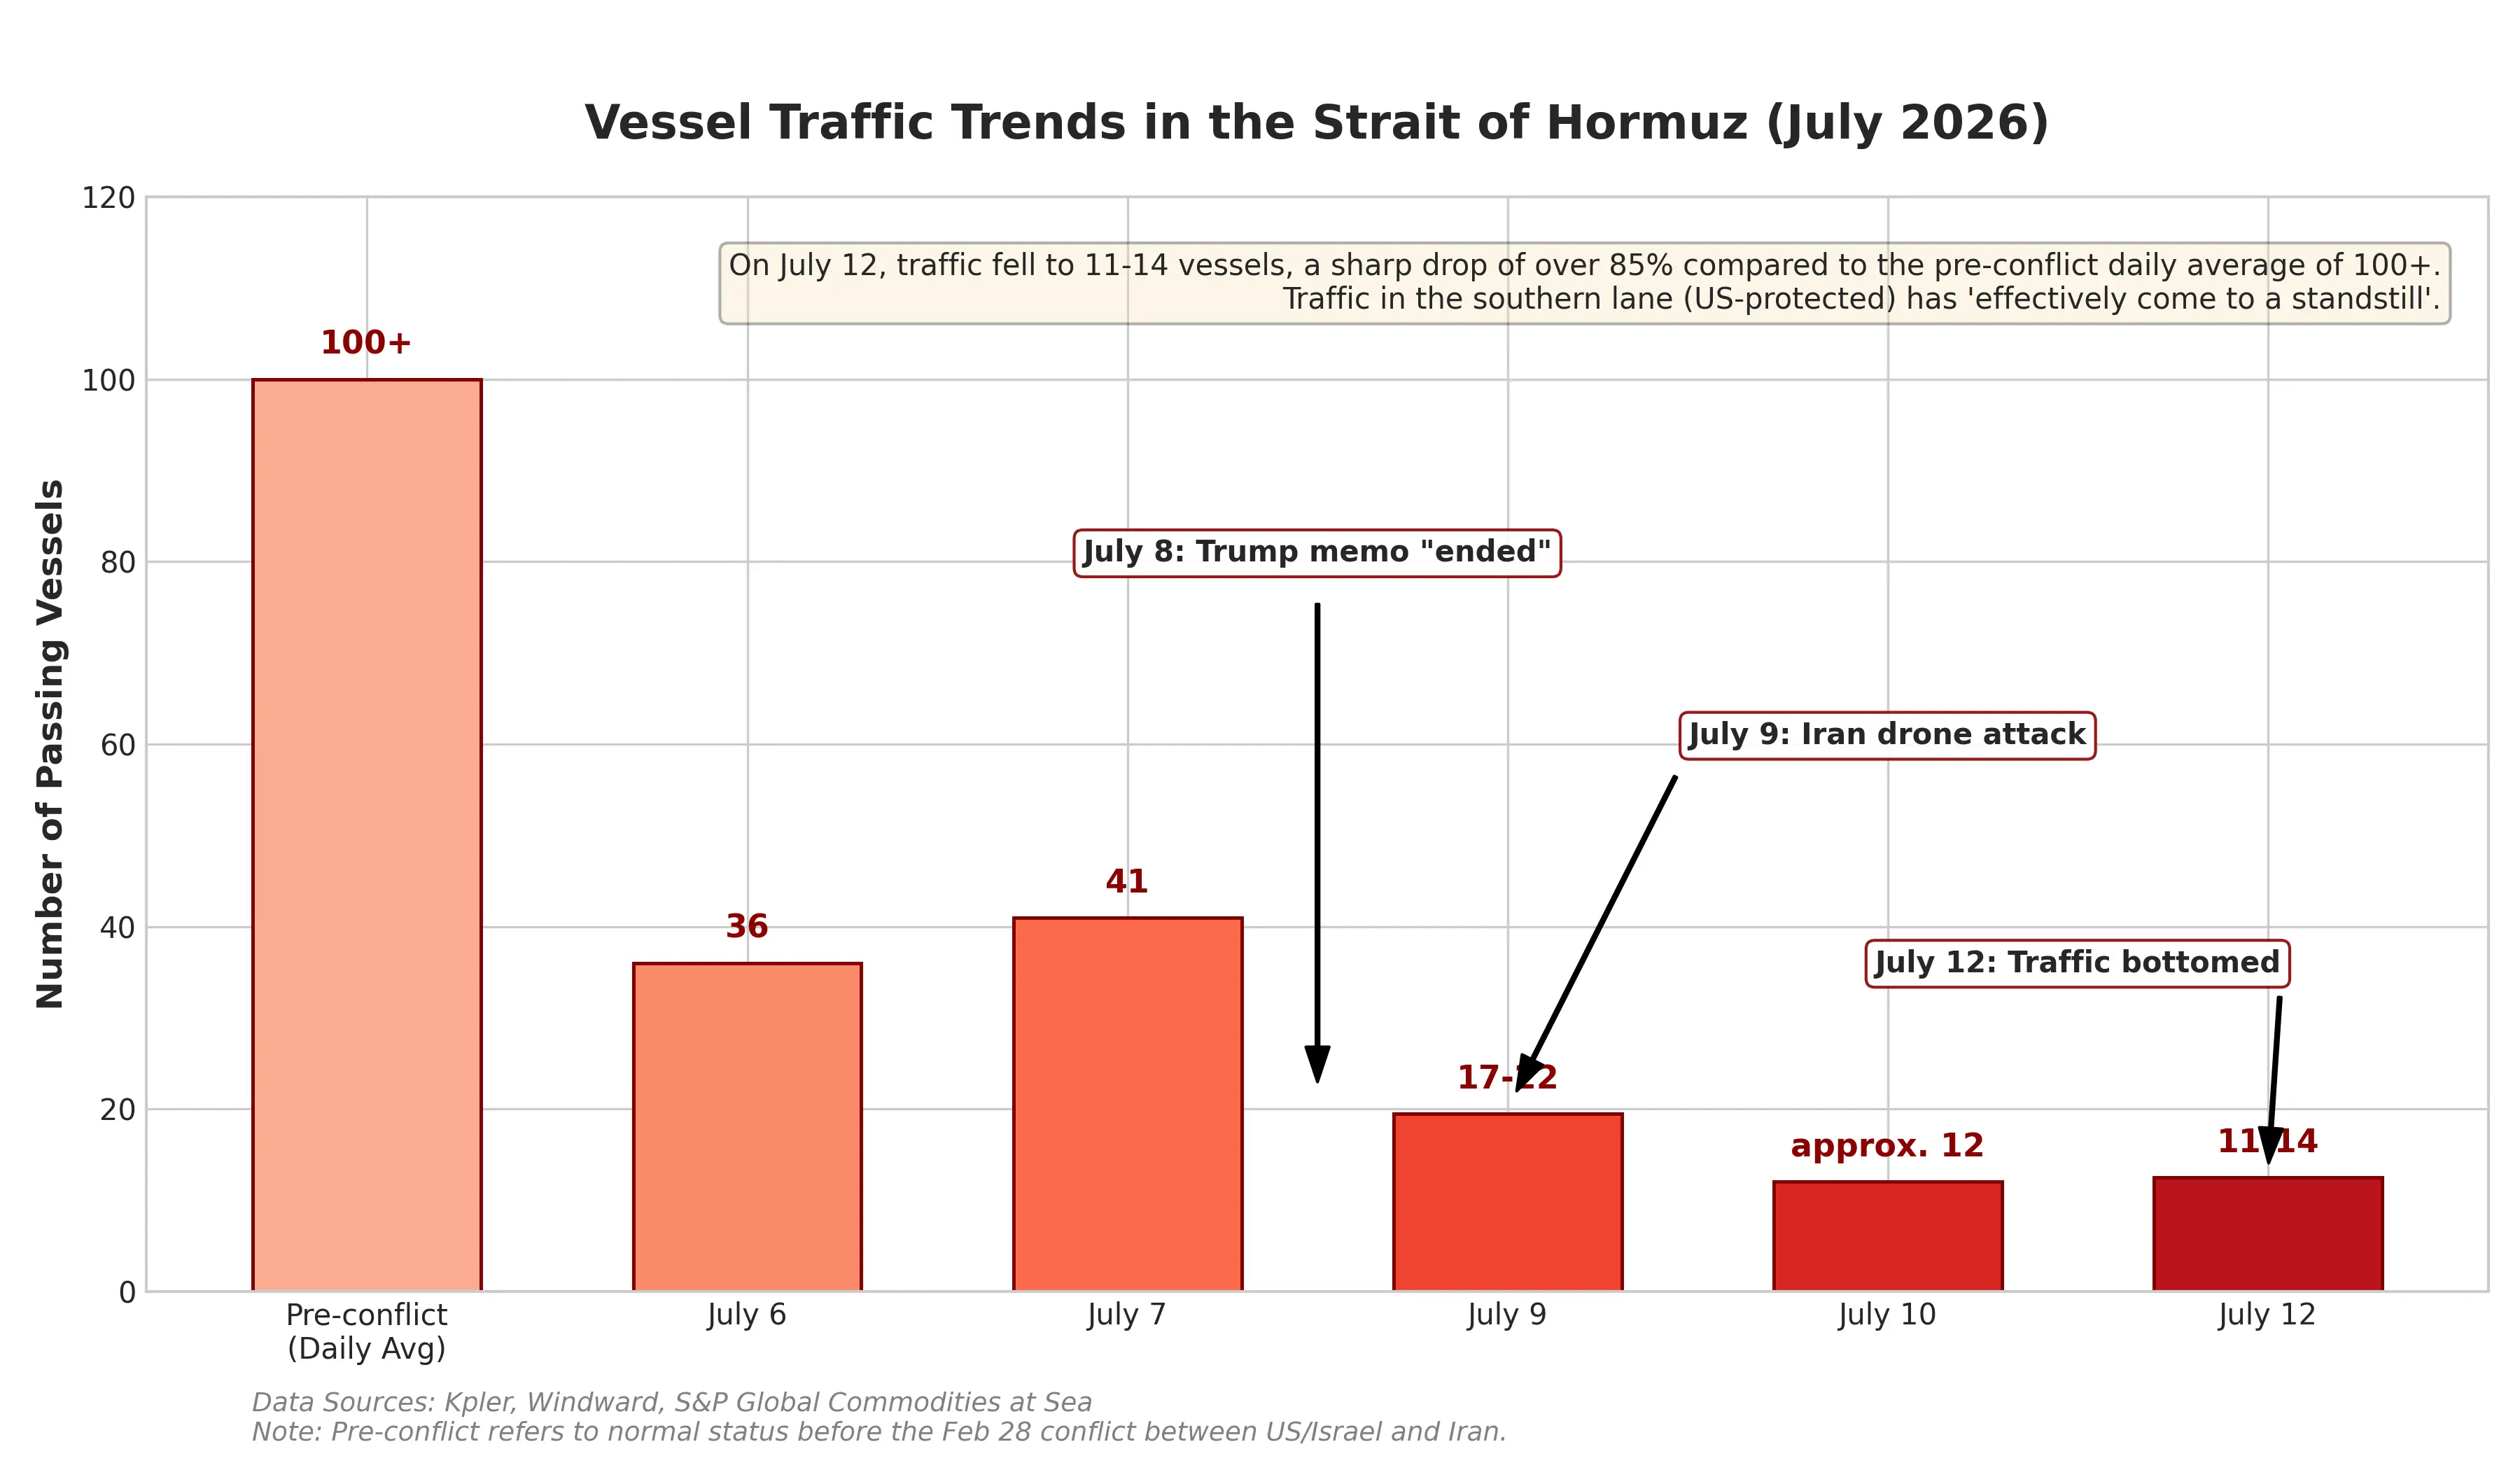
Chart of vessel transits through the Strait of Hormuz
The Two Sides of Inflation Data: Tug-of-War Between Falling Energy Prices and Geopolitical Shocks
Coincidentally, on the same day as the oil price surge, the U.S. Bureau of Labor Statistics is scheduled to release June Consumer Price Index (CPI) data at 20:30 Beijing time on July 14. This timing complicates the interpretation of inflation data.
The market broadly expects that June’s headline CPI will decline month-over-month. Economists’ consensus forecasts suggest that June’s overall CPI could fall by 0.1% to 0.2% month-over-month, with the year-over-year growth rate slowing from 4.2% in May to about 3.8%. If accurate, this would be the first time since the COVID-19 outbreak in 2020 that the U.S. has seen negative monthly CPI growth year-over-year. Goldman Sachs economists forecast overall CPI at -0.11% month-over-month, and core CPI at 0.17%.
However, Wall Street remains cautious in interpreting these figures. Multiple institutions warn that the decline in June CPI is mainly driven by falling energy prices—routine gasoline prices have dropped roughly 15% from mid-May to the end of June—not by a meaningful easing of inflationary pressures. Housing, auto insurance, travel services, and tariff pass-through effects on goods prices could still keep core inflation sticky. Goldman notes that if oil market volatility and higher oil prices persist longer than expected, inflation risks will tilt upward.
This highlights the core contradiction in the current situation. June CPI reflects price changes from the past month, and part of the energy price decline was a lagged effect following the mid-June memorandum. But the shock of nearly 10% oil price spike on July 14 will not fully appear in the July CPI data released in August. Goldman explicitly states that July CPI “is likely to differ significantly from tonight’s data.” Thus, even if June CPI shows a cooling trend, its guidance for the Fed’s policy path may be weakened by geopolitical factors.
The Federal Reserve’s Crossroads: Reversal from Rate-Cut Expectations to Rate-Hike Bets
The rapid rise in oil prices is reshaping market expectations for the Federal Reserve’s monetary policy, with its speed and magnitude catching participants off guard.
Just weeks ago, the consensus was that the Fed would continue cutting rates in 2026. At the start of the year, major banks—including Bank of America, Goldman Sachs, and Morgan Stanley—expected two rate cuts of 25 basis points each in 2026, with the policy rate falling to 3.00%–3.25%, with cuts anticipated in June and July. However, the combination of geopolitical shocks and hotter-than-expected inflation data has reversed this outlook.
On July 13, Federal Reserve Governor Christopher Waller outlined the conditions that would trigger a rate hike. He said that if the core inflation data released this week remains “again too hot,” the Federal Open Market Committee (FOMC) would need to consider tightening monetary policy soon. Waller also noted that inflation is rising under any measure this year, and expressed concern about the high level of core inflation. The Fed’s preferred inflation measure—the core personal consumption expenditures (PCE) price index—had already risen to 3.4% over the year ending in May. Importantly, Waller emphasized that this measure has been rising since January, before the U.S.-Iran conflict escalated. This suggests that inflation pressures are not solely due to geopolitics but also stem from broader structural factors.
Waller also, for the first time, explicitly identified the “demand spillover effect” from the explosive growth of the AI industry as a new driver of inflation—large-scale capital expenditures by big tech in AI are beginning to permeate the real economy, boosting demand and prices for related raw materials, energy, and services. This indicates that even if geopolitical tensions ease, inflation could remain elevated due to structural demand from AI investments.
Waller’s remarks quickly influenced financial markets. The implied probability of a July rate hike in the futures market jumped from below 10% to about 50%. The two-year U.S. Treasury yield, most sensitive to Fed policy, rose as much as 8 basis points to 4.29%, a high since February 2025. The five-year yield reached 4.37%. The benchmark 10-year U.S. Treasury yield increased 6 basis points to 4.62%, the highest since May. Swap market data shows that expectations for a rate hike in September have also increased; a week earlier, the probability was around 66%.
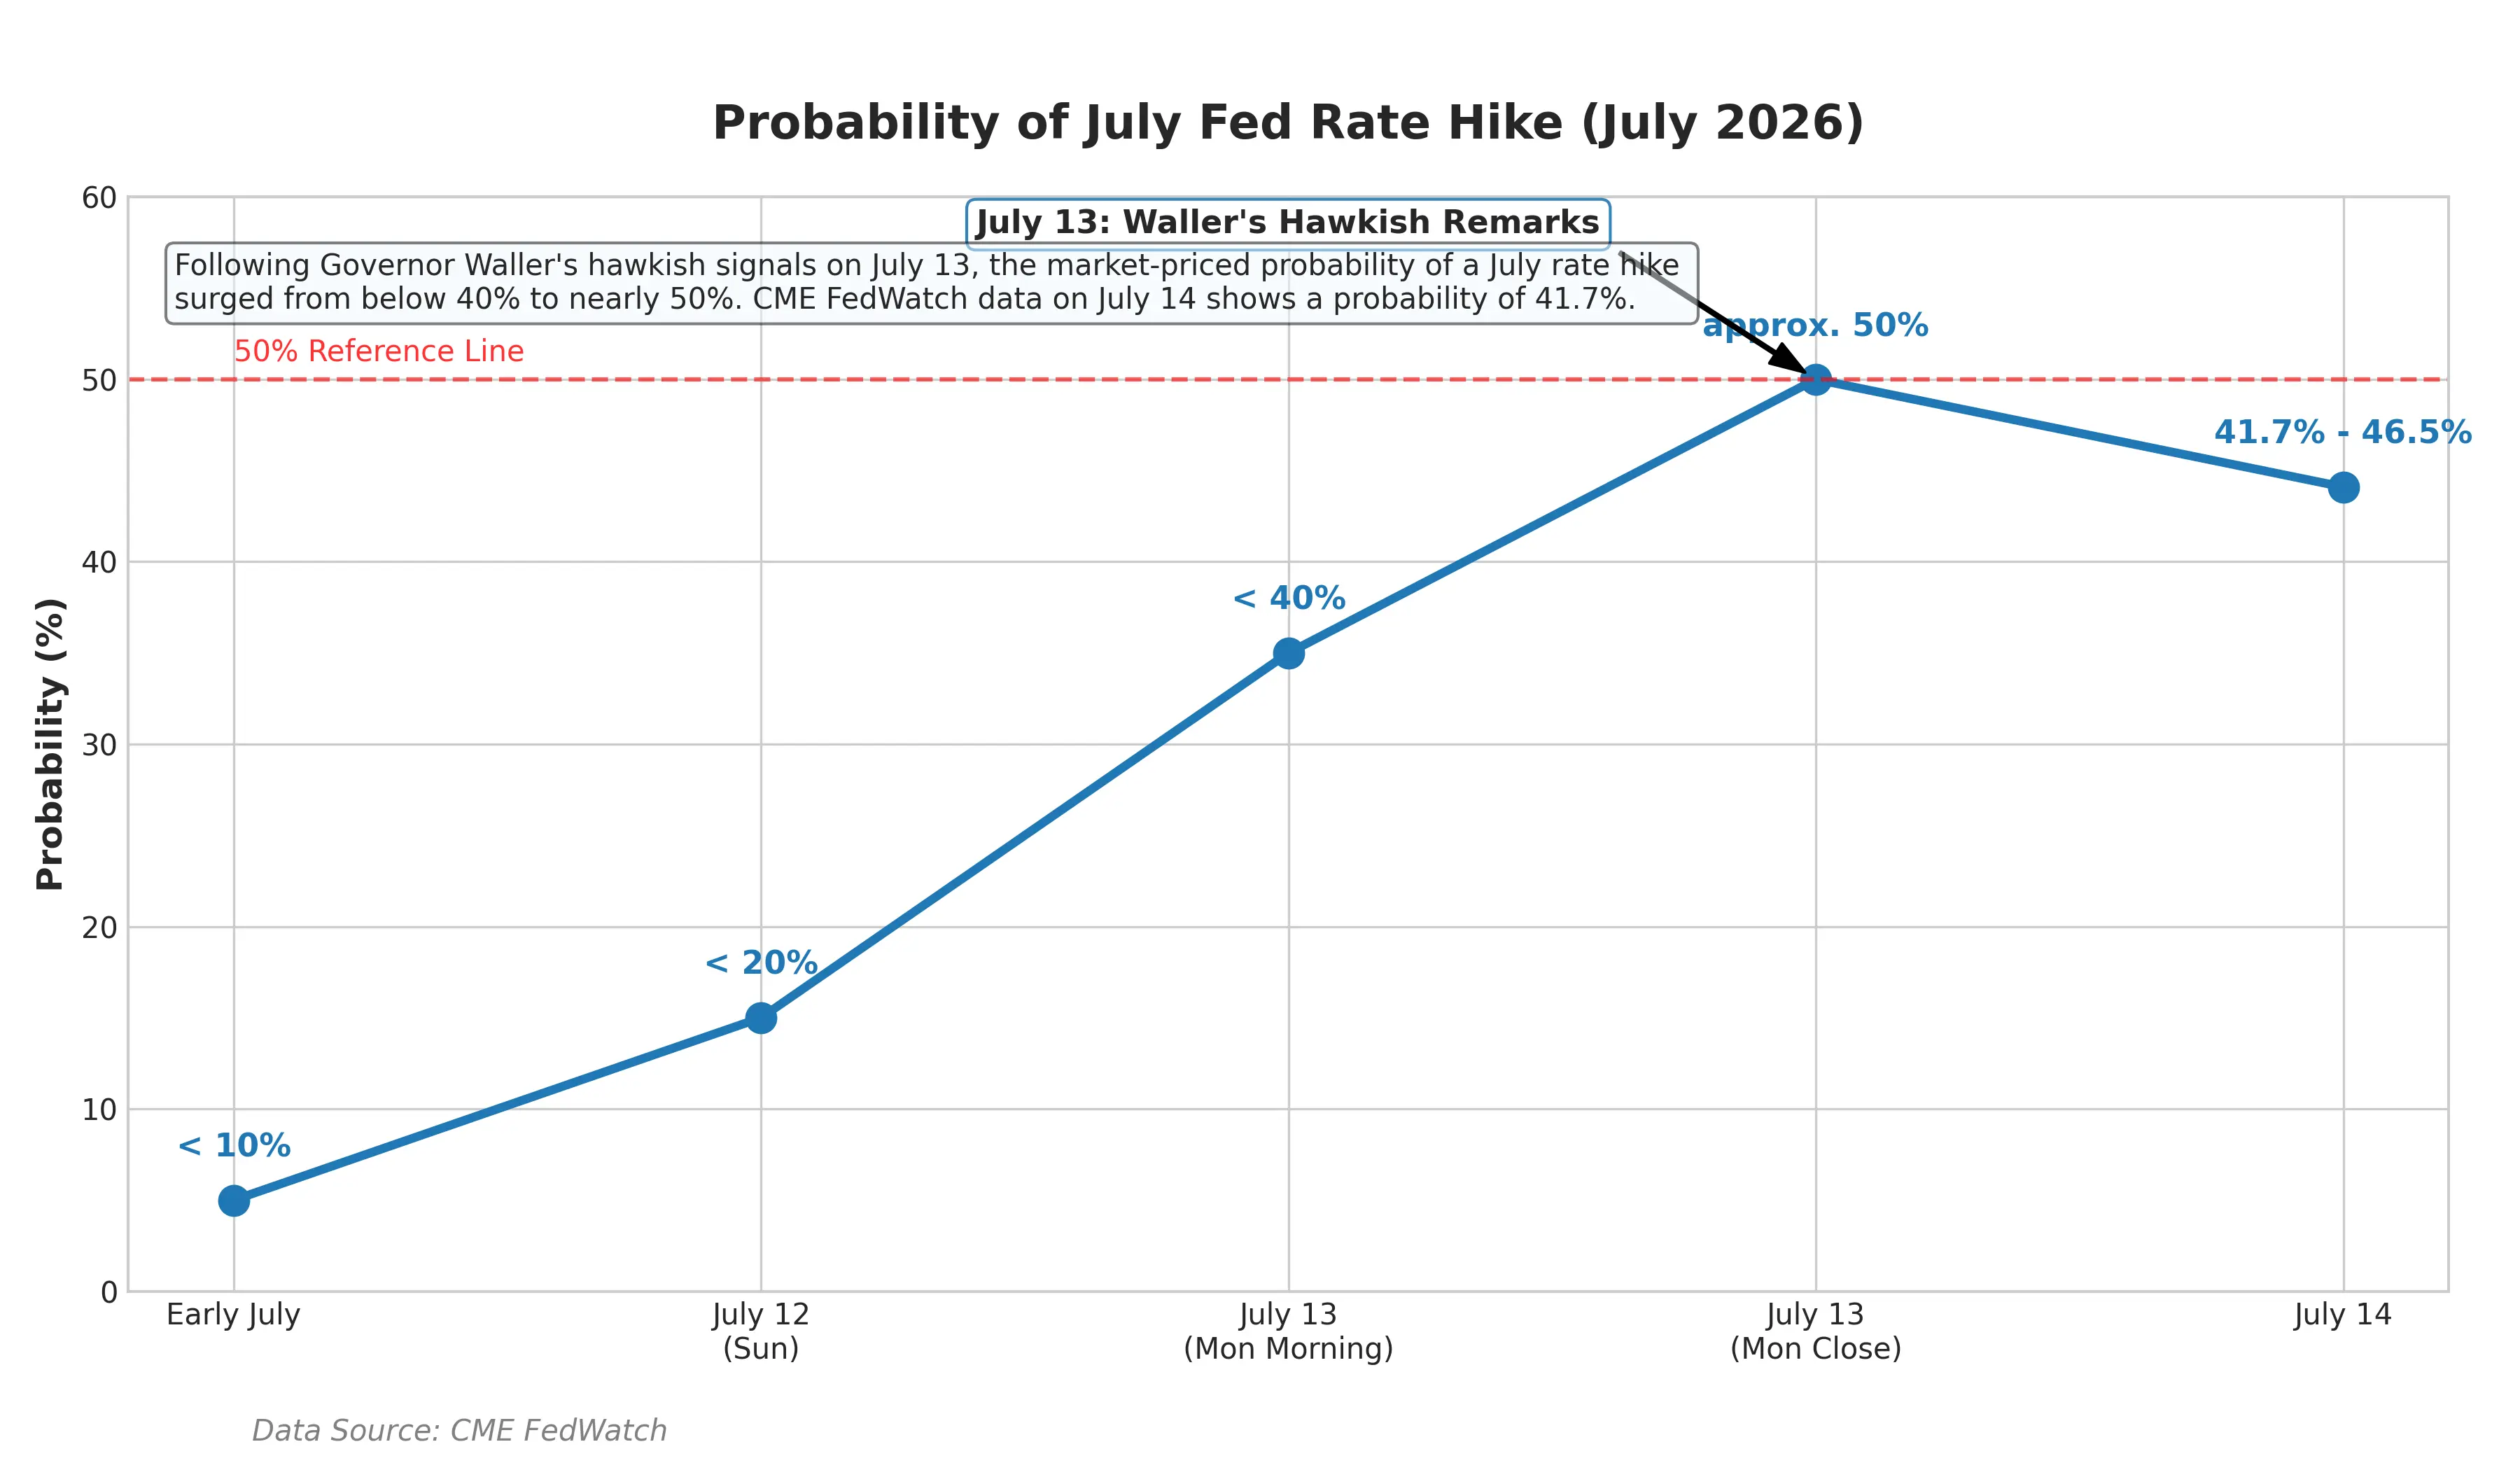
Chart of changes in the Fed’s July rate-hike probability
Federal Reserve Chair Kevin Warsh is scheduled to testify before Congress this week—his first public comments on monetary policy since taking office in May. Unlike his predecessor Powell, Warsh has previously indicated he would reduce forward guidance on interest rate paths. This makes it more challenging for markets to derive a clear policy direction from official statements. A portfolio manager at Columbia Threadneedle commented, “The odds of a July rate hike are higher than the odds of no hike.”
End Point of the Transmission Chain: Repricing Risk Assets
The chain reaction—rising oil prices → increasing inflation expectations → revaluation of risk assets—is exerting systemic influence on global financial markets.
In terms of asset performance, the effects are already evident. On July 14, international precious metal futures declined across the board—COMEX gold futures fell 2.55% to $4,008.70 per ounce, and COMEX silver futures dropped 3.63% to $57.98 per ounce. The three major U.S. stock indexes all closed lower: Dow down 0.26%, Nasdaq down 1.55%, and S&P 500 down 0.79%. Goldman Sachs warned that if the Fed initiates a rate-hike cycle, three headwinds will weigh on U.S. equities: growth expectations will be pressured, the cost of capital will rise, and the fragility of highly valued markets will increase.
For the crypto market, the return of rate-hike expectations means that the previous liquidity easing narrative supporting risk assets is weakening. When yields on risk-free assets remain high, the relative attractiveness of risk assets diminishes accordingly.
The future trajectory of oil prices is the key variable determining how long and how strongly this transmission chain persists. A Qizhen Futures analyst said that the extent to which geopolitical risk supports oil prices ultimately depends on whether it will have a substantive impact on crude oil supply. If the U.S.-Iran conflict leads to a long-term blockade of Iran’s oil export channels, the crude oil market will face a genuine supply shortage, and oil prices could keep rising. If it is only short-term friction, any rebound may be temporary.
Fundamental data from the U.S. Energy Information Administration shows that U.S. commercial crude inventories increased by 3 million barrels to 411.4 million barrels, while refined product stocks declined sharply—refinery crude stocks fell by 4.98 million barrels, and gasoline inventories decreased by 1.904 million barrels. Despite high oil prices, refinery processing demand remains resilient, and terminal consumption has not contracted significantly. This inventory structure suggests that demand-side fundamentals have not yet broken down, providing fundamental support for oil prices.
Conclusion
On July 14, 2026, WTI crude surged 8.84% in a single day to $79.79, and the market is re-pricing the geopolitical risk premium for the Strait of Hormuz. Simultaneously, the implied probability of a Fed rate hike in July has risen from below 10% to about 50%, with expectations for inflation and interest rates rapidly rebuilding.
The core contradiction in the current market is this: June CPI data may show a temporary cooling trend due to falling energy prices, but the shock from the July oil price spike will gradually be reflected in upcoming data. Fed officials have explicitly stated they need “core inflation declines for consecutive months” to confirm that inflation is on the right track. Given escalating geopolitical tensions, meeting this condition appears challenging in the near term.
In the coming weeks, four variables will be critical in determining the oil price trend and monetary policy path: the actual status of shipping through the Strait of Hormuz, the extent of damage to Iran’s energy infrastructure, the pace of releases from U.S. strategic petroleum reserves, and Warsh’s policy remarks in Congress. For market participants, with rate cut expectations being significantly reversed, re-evaluating risk asset valuation boundaries under different interest rate scenarios may be more realistic than betting on a single policy trajectory.
FAQ
Q: How long can the impact of the U.S.-Iran conflict on oil prices last?
This depends on whether the conflict has a substantive impact on crude oil supply. If Iran’s oil export channels are blocked for the long term, oil prices could keep rising; if it is only short-term friction, any rebound may be temporary. Currently, the daily transit volume through the Strait of Hormuz has dropped from about 130 vessels to single digits, and supply risk is building up.
Q: What is the current probability of a Fed rate hike in July?
As of July 14, the implied probability of a 25-basis-point Fed rate hike in July in the money markets has risen to about 50%, from below 10%. CME FedWatch data shows that the market-implied probability is around 39%. The final decision will depend on June CPI data and Warsh’s testimony before Congress.
Q: What are expectations for June CPI data?
The market generally expects June headline CPI to fall 0.1% to 0.2% month-over-month, and for the year-over-year rate to slow from 4.2% in May to about 3.8%. But this is mainly driven by falling energy prices, and Wall Street warns this could be “false cooling,” with core inflation remaining sticky.
Q: How does a rise in oil prices affect the Fed’s rate-cut decision?
The transmission chain is: rising oil prices push up inflation expectations → the Fed finds it harder to cut rates (and could even hike) → risk asset valuations come under pressure. This chain does not require oil prices to break above $80 to begin; it is repriced continuously as oil prices jump each time.
Q: Why would the Fed view AI demand as an inflation factor?
Federal Reserve Governor Waller said the explosive growth of the AI industry brings large-scale infrastructure investment (data centers, power, equipment, etc.). Big tech’s capital expenditures are spreading into the real economy, driving up the prices of related raw materials, energy, and services—becoming a new root cause of inflation.