Vanguard Total Stock Market ETF (VTI) is a U.S.-listed ETF stock issued by Vanguard under ticker VTI. It tracks the CRSP US Total Market Index through index sampling, giving passive exposure to the investable U.S. equity market. The expense ratio is about 0.03% (as of April 28, 2026, per Vanguard Overview; confirm the latest product-page figure). VTI is not a single-company stock, a crypto token, or a tokenized stock.
A total-market index folds large-, mid-, small-, and micro-cap stocks into one benchmark, so one ETF share can cover a wider U.S. equity universe. On platforms such as Gate Stocks, VTI appears as a stock product, which lets users view U.S. total-market ETF exposure and stablecoin funding in the same account framework.
For digital-asset users, VTI works as a standardized “U.S. total-market slice”: clarify the index boundary and sampling method first, then verify the legal name, ticker, and order fields on the Gate Stocks · VTI page so ETF research is not mixed up with order execution.
What Is VTI? How Does It Relate to Vanguard and the U.S. Total Stock Market?
VTI is an index ETF in the Vanguard family, built to track the CRSP US Total Market Index. Its full name is Vanguard Total Stock Market ETF, and both public markets and Gate Stocks identify it by ticker VTI. Holding VTI means holding the basket of U.S. total-market equity exposure those ETF shares represent—not owning all the equity of any single listed company.
Think of the relationship as issuer–index–product: Vanguard runs the fund and share structure; the CRSP US Total Market Index defines a broad investable U.S. equity universe; VTI passively tracks that index. Start with the tracked index name, then confirm the issuer and ticker match. Ticker VTI points to the ETF product layer; remembering only a “total market” label while ignoring that CRSP sets the benchmark misses the product’s defining constraint.
What Index Does VTI Track? How Should Holdings Coverage and Expense Ratio Be Understood?
VTI tracks the CRSP US Total Market Index. That index aims to cover roughly 100% of the investable U.S. equity market, spanning large-, mid-, small-, and micro-cap stocks. Names and weights change as index rules and market structure evolve; a holdings snapshot on one date is not a permanent roster.
VTI uses index sampling: it holds a basket of securities so key portfolio characteristics approximate the index, rather than buying nearly every constituent under full replication. Per Vanguard’s product materials, the sampled portfolio seeks to stay close to the CRSP US Total Market Index on sector weights, market-cap mix, and traits such as price-to-earnings and dividend yield. Sampling aligns characteristics; it does not erase tracking difference. Cash, rebalancing timing, trading costs, and dividend reinvestment pace can leave small gaps between the ETF’s net asset value (NAV) path and the index level.
When ETF shares trade on an exchange, market price can sit slightly above or below NAV. That premium or discount is a normal secondary-market feature—not a signal about future index returns. Read three layers separately: the index describes benchmark performance, NAV describes fund net-asset accounting, and market price is what you can trade at that moment.
Expense ratio is a core cost parameter for a passive ETF. According to Vanguard Overview, VTI’s expense ratio is about 0.03% (as of April 28, 2026); always confirm the latest figure on the product page. That number covers management and related fees accrued against fund net assets. It is not a return promise and does not replace bid–ask spreads, platform trading fees, or taxes. Teams such as Vanguard Global Equity Index Management build and trade the portfolio under the index methodology; product research should still prioritize benchmark name, replication method, and fee disclosure—not treat team names as trading inputs.
| Parameter |
Key point |
How to verify |
| Benchmark index |
CRSP US Total Market Index |
Total-market coverage (about 100% of investable U.S. equities) |
| Replication method |
Index sampling |
Sector / market-cap / financial traits approximate the index; not full replication |
| Price lenses |
Index / NAV / market price |
Temporary gaps are normal; read each layer on its own |
| Expense ratio |
About 0.03% (as of April 28, 2026) |
Confirm against the latest product-page disclosure |
The table separates what is tracked, how holdings are built, how prices are read, and how costs are disclosed. Holdings lists and weights change with index adjustments and sampling updates, so research should return to fund holdings disclosures and index methodology rather than a memorized “top holdings” list.
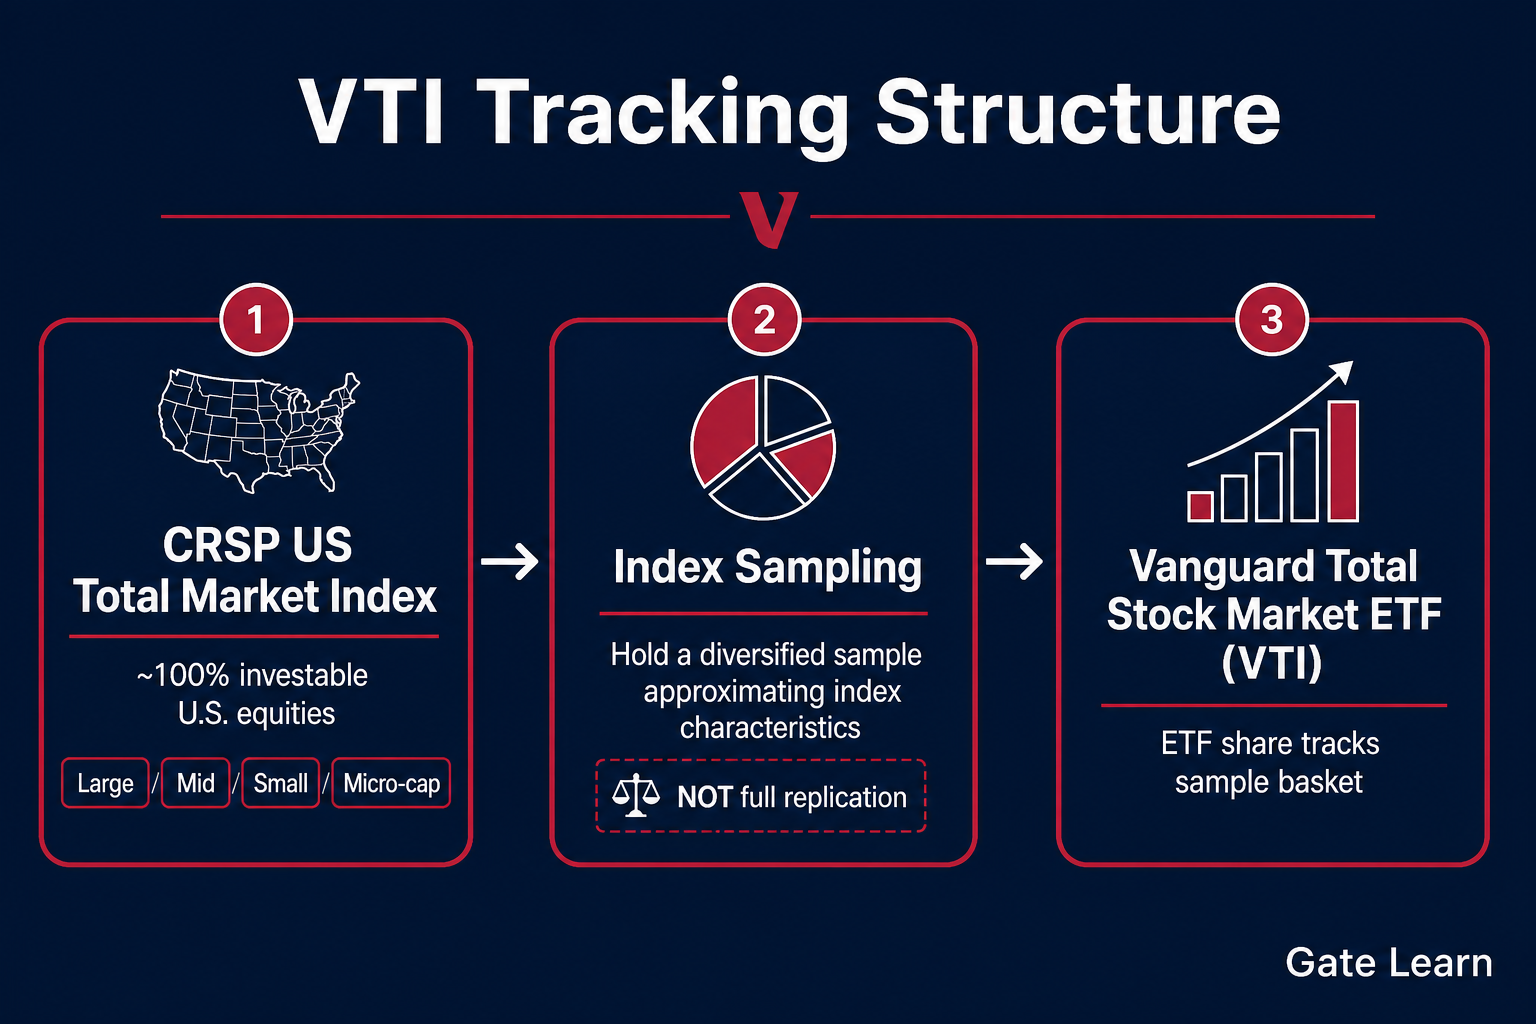
Figure 1. VTI tracking structure: from the CRSP US Total Market Index through index sampling into an ETF holdings basket that approximates total-market characteristics.
How Does VTI Differ From S&P 500 ETFs Such as VOO?
VTI and VOO are both U.S. ETF stocks from Vanguard, but they track different index boundaries. VTI tracks the CRSP US Total Market Index and sits closer to the investable U.S. equity market as a whole; VOO is Vanguard S&P 500 ETF and tracks the S&P 500, concentrated in about 500 large-cap companies.
The coverage contrast is “total market versus large-cap core”: VTI’s index design includes mid-, small-, and micro-cap layers; VOO’s benchmark centers on large caps. Both may hold overlapping mega-cap names, but VTI is not “VOO with a different ticker.” Align first on which index is tracked and which market-cap layers are covered, then compare expense ratio, sampling or replication method, and style exposure.
| Ticker |
Product |
Index / coverage boundary |
Market-cap emphasis |
| VTI |
Vanguard Total Stock Market ETF |
CRSP US Total Market: total market |
Large + mid + small + micro |
| VOO |
Vanguard S&P 500 ETF |
S&P 500: large-cap core (~500 names) |
Primarily large-cap |
The table stresses boundary differences; it does not rank products. Keep “total-market coverage” and “S&P 500 large-cap slice” as separate frames so sharing the Vanguard issuer does not blur index universes. Related broad tools often include ITOT (a U.S. total-market–style ETF from issuers such as iShares) and VT (global equity exposure): ITOT also sits in a total-market context, but issuer and index methodology may differ; VT folds international equities into the same product and should not be treated as interchangeable with U.S.-only VTI. When comparing any nearby ticker, align first on benchmark name and coverage boundary.
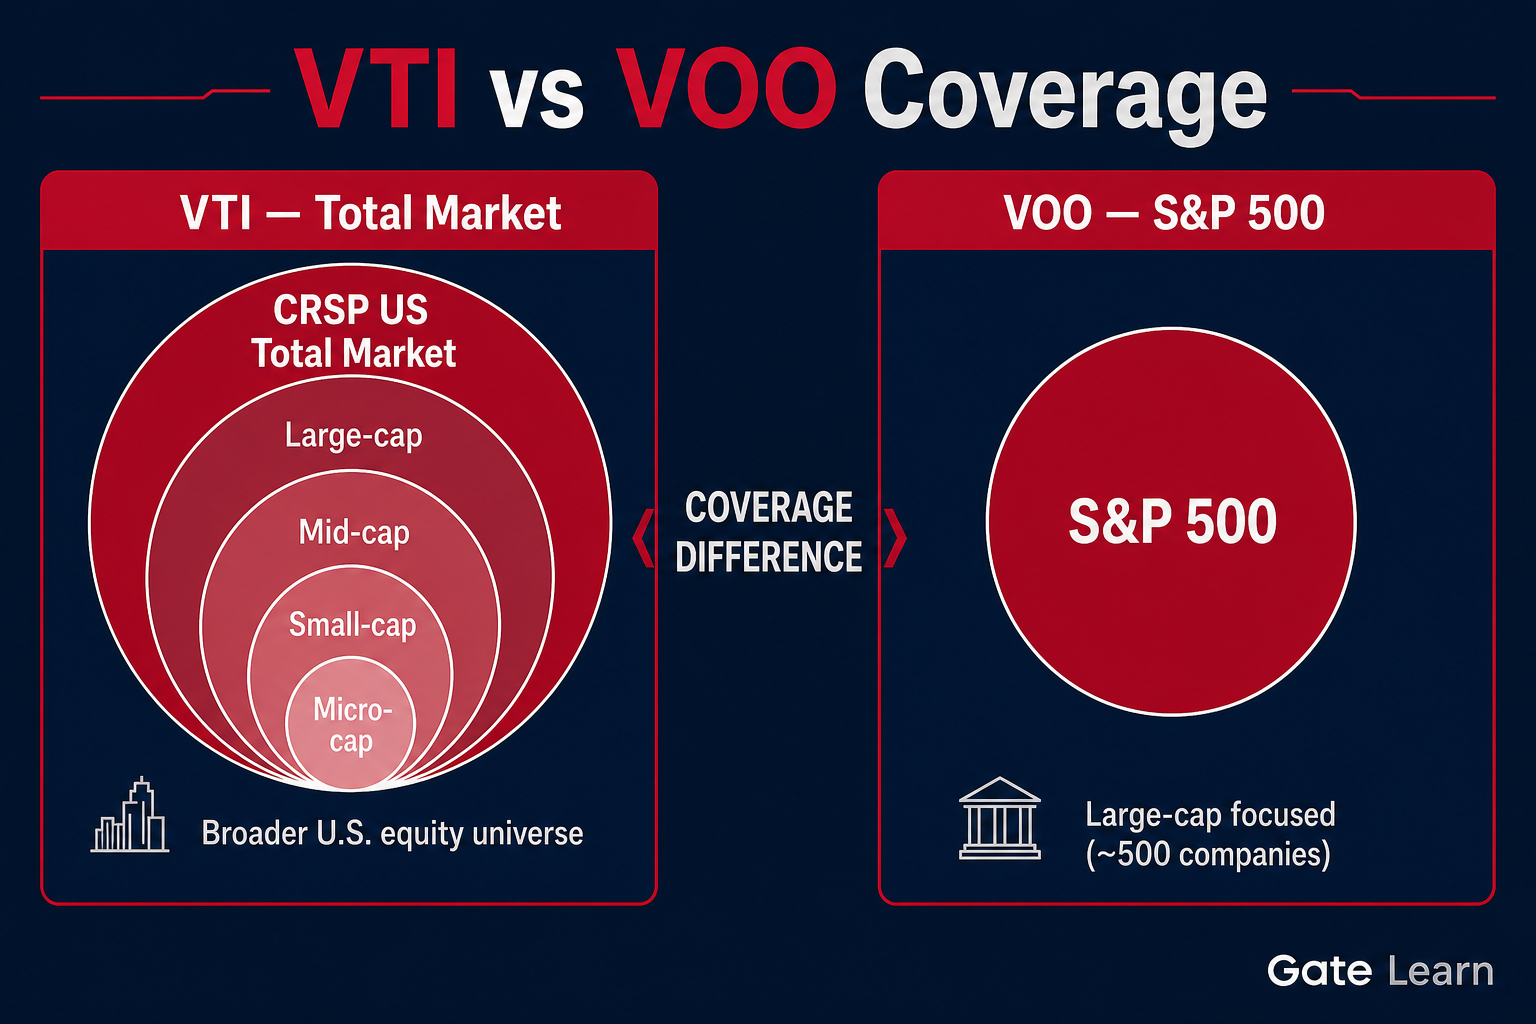
Figure 2. VTI versus VOO coverage: VTI maps to total-market market-cap layers; VOO focuses more tightly on the S&P 500 large-cap core.
How Do You Trade VTI Stock on Gate Stocks?
On Gate Stocks, search ticker VTI to find Vanguard Total Stock Market ETF. Use Gate Stocks · VTI to verify the full name, ticker, and displayed product information. If the goal is to complete buy and sell flows with stablecoins, trade VTI with USDT walks through funding, symbol search, order fields, and fee checks step by step.
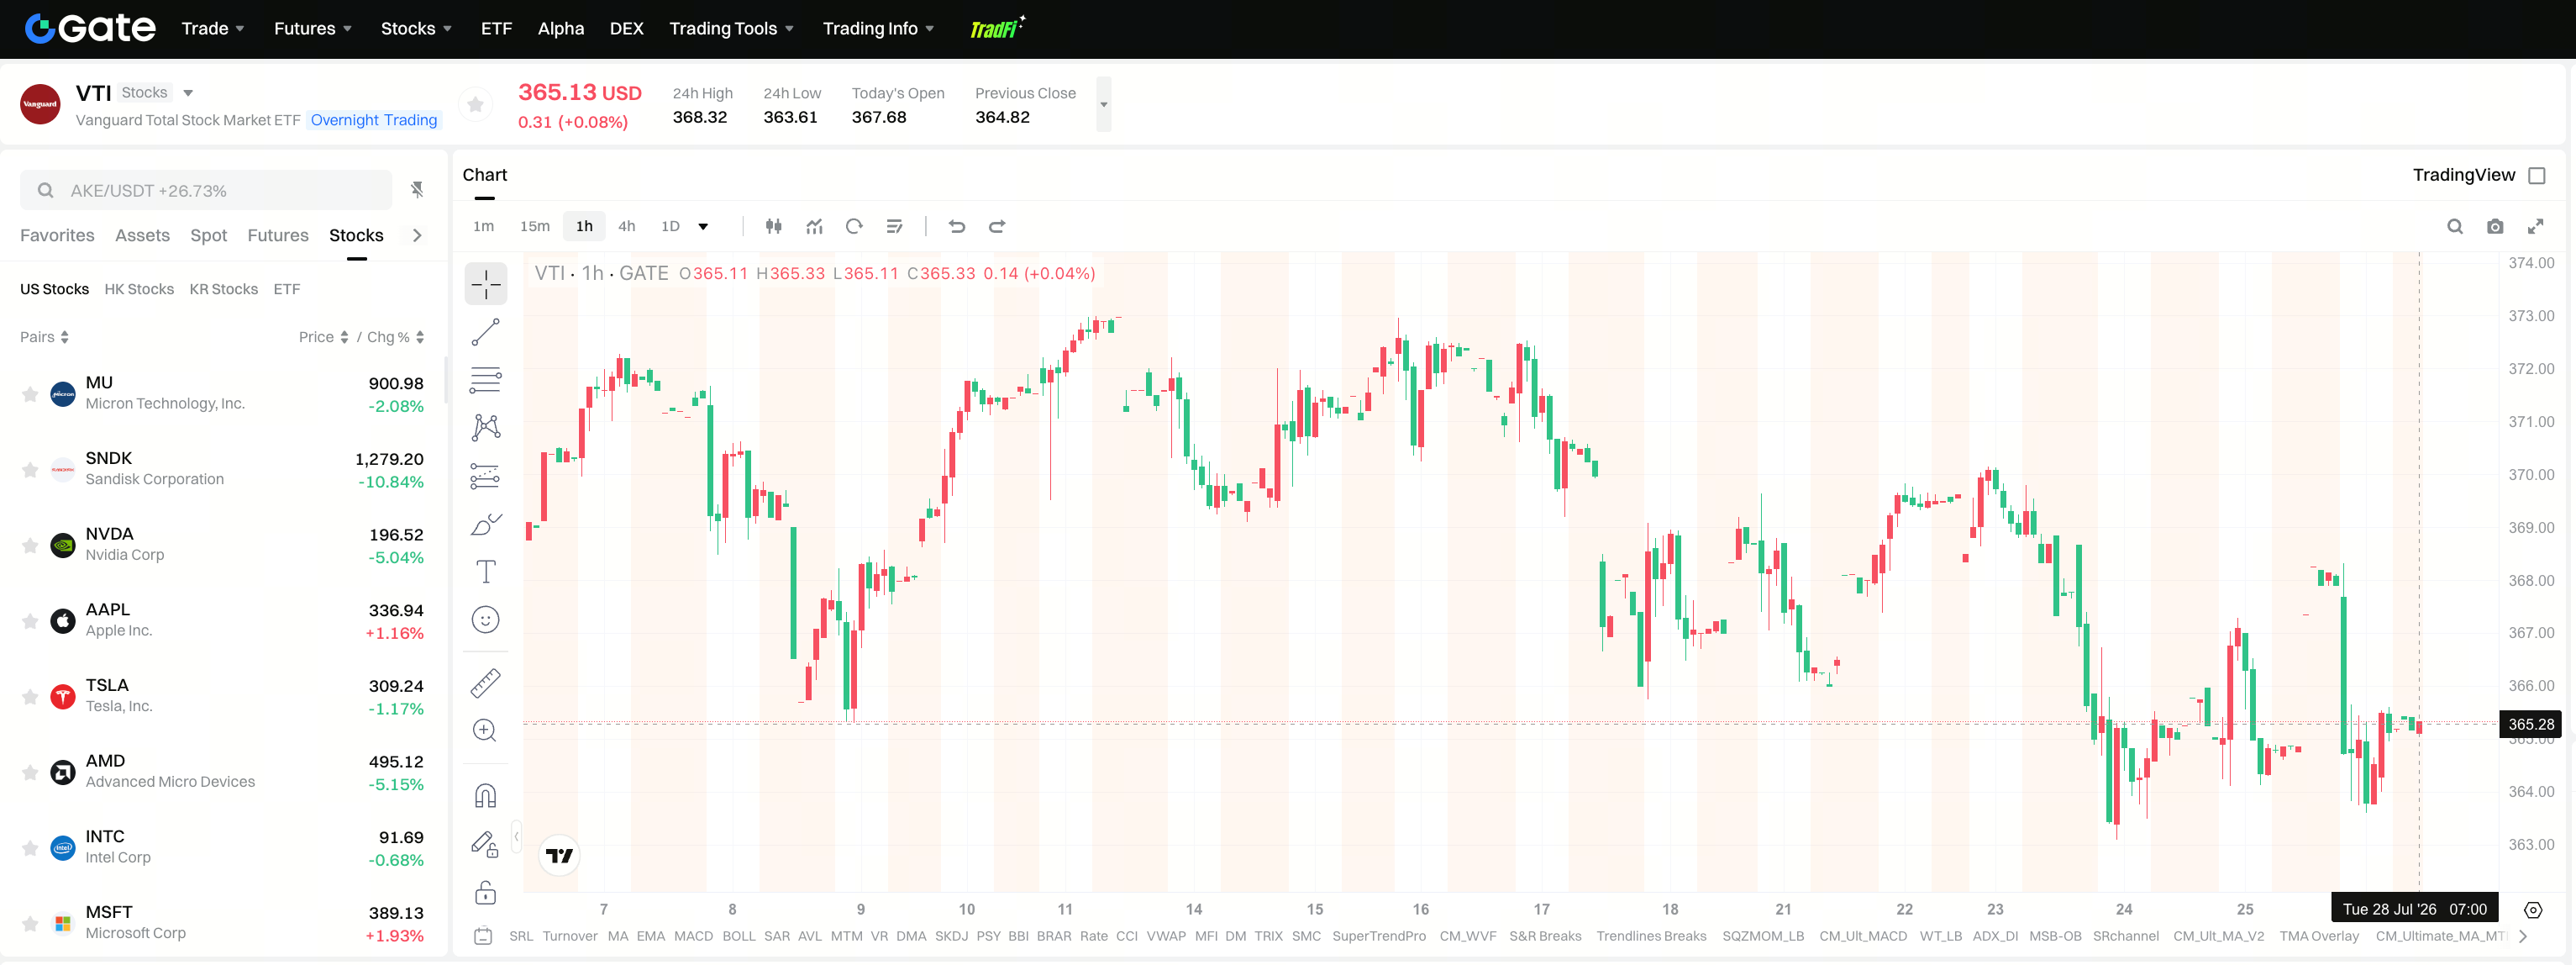
Before placing an order, run three checks: Is the page ticker VTI? Does the legal name match Vanguard Total Stock Market ETF? Do order type and available funding match the intended setup? Gate Stocks may differ from a traditional brokerage in account structure, settlement display, and funding currency; index research does not replace field-level checks on the order ticket.
| Check item |
Focus |
Notes |
| Ticker and legal name |
VTI / full product name |
Avoid mix-ups with nearby tickers such as VOO |
| Funding |
Available balance in USDT or other supported units |
Separate account cash from order-available buying power |
| Order rules |
Type, validity, fees |
Reconfirm against fields shown on the page |
The table keeps “understanding the ETF” separate from “completing the trade”: the first answers what is tracked; the second answers what was clicked on the page. Path descriptions outline a repeatable workflow only; they are not buy or sell guidance.
What Are the Advantages and Risks of Holding or Trading VTI?
Structural advantages center on covering investable U.S. total-market exposure with a single ETF stock; index sampling keeps portfolio characteristics aligned with the index; and an expense ratio of about 0.03% (Vanguard Overview, as of April 28, 2026) makes the cost parameter easy to place in a long-horizon comparison. For users who need to watch crypto assets and U.S. equity ETFs together, Gate Stocks provides a path to search and trade VTI inside one account.
State risks and limits separately. On market risk, a total-market portfolio still moves with overall U.S. equities; shifts in mid-, small-, and micro-cap weights can change volatility, and smaller-cap liquidity is typically thinner than mega-cap liquidity. On tracking risk, sampling can still diverge from the index because of sample composition, cash, rebalancing, and fees. On execution risk, ticker mix-ups (for example, ordering VOO, ITOT, or VT by mistake), session rules, fee definitions, and funding or settlement display differences can all affect realized outcomes.
| Type |
Primary sources |
What to watch |
| Structural advantages |
Total-market coverage, passive tracking, low disclosed expense ratio |
Benchmark name, sampling traits, fee fields |
| Market and coverage risk |
Overall U.S. equity moves; mid/small/micro weight shifts |
Market-cap-layer exposure and liquidity differences |
| Tracking difference |
Sample basket, cash, rebalancing, fee accrual |
Whether NAV systematically diverges from the index |
| Execution risk |
Ticker confusion, order and session rules, funding basis |
Gate page legal name, fees, and holdings confirmation |
On dividends and corporate actions, ETF-level distribution, reinvestment, and tax treatment follow product disclosures and platform rules; credit display and settlement timing can differ across venues, so keep product-structure research separate from order-page checks. As a passive index product, VTI does not actively pick stocks for excess return; “passive” describes the tracking method, not an absence of volatility or risk.
Risk notes identify variable sources; they are not trading advice or return promises. Reading structural advantages next to risk mechanisms supports a reusable checklist.
Summary
VTI (Vanguard Total Stock Market ETF) is a U.S. ETF stock that tracks the CRSP US Total Market Index, delivers total-market passive exposure through index sampling, and carries an expense ratio of about 0.03% per Vanguard Overview (as of April 28, 2026; confirm the latest product-page field). Understanding the product means holding three threads at once: the total-market index boundary, coverage differences versus S&P 500 ETFs such as VOO, and ticker plus order-rule verification on Gate Stocks. Keep index research and trade execution in separate layers.
FAQ
What is VTI?
VTI is the trading ticker for Vanguard Total Stock Market ETF, a U.S. ETF stock issued by Vanguard. The product passively tracks the CRSP US Total Market Index and provides investable U.S. total-market exposure without active stock selection for excess return. It is not a single-company stock and not a crypto token or tokenized stock.
What index does VTI track?
VTI tracks the CRSP US Total Market Index. That index covers roughly 100% of the investable U.S. equity market, spanning large-, mid-, small-, and micro-cap stocks, so a total-market frame includes mid-, small-, and micro-cap exposure. Constituents and weights change with index rules; VTI uses index sampling so portfolio characteristics approximate the index.
How does VTI differ from VOO?
VOO is Vanguard S&P 500 ETF and tracks the S&P 500, focusing more tightly on a large-cap core; VTI tracks the CRSP US Total Market Index and sits closer to total-market coverage. Both are Vanguard U.S. equity ETFs, but their index boundaries differ: VTI includes broader market-cap layers, while VOO centers on about 500 large-cap companies.
What is VTI’s expense ratio?
According to Vanguard Overview, VTI’s expense ratio is about 0.03% (as of April 28, 2026). That figure is a fund expense-ratio disclosure describing management and related fee levels. It is not a return promise and does not replace bid–ask spreads or platform trading fees; confirm the latest value on the product page.
What does index sampling mean for VTI?
Index sampling means VTI holds a basket of securities so that sector weights, market-cap mix, and selected financial traits approximate the CRSP US Total Market Index, rather than fully replicating every index constituent. Sampling can still produce tracking difference because of cash, rebalancing, and fees, and should not be confused with “holding every stock in the index.”
How do you buy VTI with USDT on Gate?
On Gate Stocks, search ticker VTI, verify that the legal name is Vanguard Total Stock Market ETF, confirm available funding (such as USDT) and order type, then place the order. Before executing, recheck ticker, legal name, fee fields, and holdings display. A fuller step-by-step path is covered in trade VTI with USDT. Path descriptions outline a repeatable workflow only; they are not trading advice.







