Last_Satoshi

vip
Peak Tier 0
Diamond Hands
Crypto Market Researcher
I'm back
#SuiNetworkRecovery
Sui's Mainnet Recovery Highlights the Importance of Reliability in Modern Blockchain Infrastructure
In the rapidly evolving world of blockchain technology, network performance is often tested not during periods of normal operation, but when unexpected disruptions occur. The recent temporary interruption on Sui's mainnet and its subsequent recovery have once again placed infrastructure resilience at the center of industry discussion.
While short-term outages can generate concern among investors and users, experienced market participants understand that the true measure of a
SUI-0.72%
discovery
#SuiNetworkRecovery
Sui's Mainnet Recovery Highlights the Importance of Reliability in Modern Blockchain Infrastructure
In the rapidly evolving world of blockchain technology, network performance is often tested not during periods of normal operation, but when unexpected disruptions occur. The recent temporary interruption on Sui's mainnet and its subsequent recovery have once again placed infrastructure resilience at the center of industry discussion.
While short-term outages can generate concern among investors and users, experienced market participants understand that the true measure of a network is not whether challenges arise, but how effectively they are resolved. In that regard, Sui's return to normal operation has become an important case study in operational response and ecosystem resilience.
Blockchain networks today support far more than simple value transfers. They increasingly serve as the foundation for decentralized applications, digital asset markets, gaming ecosystems, tokenized financial products, and enterprise-level solutions. As adoption expands, reliability becomes one of the most valuable competitive advantages a network can possess.
The temporary interruption immediately drew attention because uninterrupted operation is essential for maintaining user confidence. Investors expect transactions to be processed efficiently, developers require predictable performance, and businesses depend on stable infrastructure when building services around blockchain technology.
When disruptions occur, market reactions are often driven by uncertainty rather than the technical issue itself. Participants seek answers regarding the cause of the interruption, the effectiveness of recovery measures, and the likelihood of future occurrences. Transparency during these moments plays a crucial role in preserving trust.
One of the key lessons from this event is the growing importance of operational maturity. Early blockchain projects were often evaluated primarily on innovation and technical potential. Today, institutional investors and enterprise users increasingly prioritize reliability, scalability, security, and governance standards alongside technological innovation.
The ability to restore network functionality efficiently demonstrates the value of preparation and engineering discipline. Successful recovery efforts typically involve extensive monitoring systems, coordinated technical teams, and clearly defined response procedures. These capabilities are becoming essential as blockchain networks compete for long-term adoption.
From an investment perspective, temporary technical challenges do not automatically determine a project's future success or failure. Financial history is filled with examples of major technology platforms that experienced operational setbacks before achieving significant growth. What often matters most is whether the underlying issue exposes a structural weakness or represents an isolated event that can be effectively addressed.
Developers are also watching closely. Builder communities tend to evaluate networks based on long-term confidence rather than short-term headlines. A transparent recovery process can reinforce trust if stakeholders believe that lessons have been learned and improvements have been implemented.
Competition within the blockchain sector continues to intensify. Networks are no longer competing solely on transaction speed or cost efficiency. Increasingly, they are competing on reliability, ecosystem development, developer experience, and institutional credibility. Every operational event therefore contributes to the broader perception of a platform's maturity.
Another important consideration is user behavior. Modern digital asset markets operate continuously, creating expectations of constant accessibility. This environment places significant pressure on infrastructure providers to maintain high availability and rapidly address any disruptions that arise.
For professional investors, the incident serves as a reminder that technology risk remains an important component of digital asset analysis. Evaluating a project requires more than understanding token economics or market trends. It also involves assessing operational readiness, engineering quality, and the ability to respond effectively under pressure.
The recovery of Sui's mainnet demonstrates that resilience is not defined by the absence of challenges. Rather, it is defined by the capacity to identify issues, implement solutions, communicate clearly, and restore confidence among users and stakeholders.
As blockchain technology continues expanding into mainstream finance and commerce, these qualities will become increasingly important. Innovation may attract attention, but reliability ultimately sustains adoption.
For Sui and the broader industry, the recent recovery serves as a valuable reminder that trust is built not only during periods of smooth growth, but also through effective responses when unexpected obstacles emerge. In a sector driven by technology and confidence, that distinction can make all the difference.

repost-content-media
  • Reward
  • Comment
  • 1
  • Share
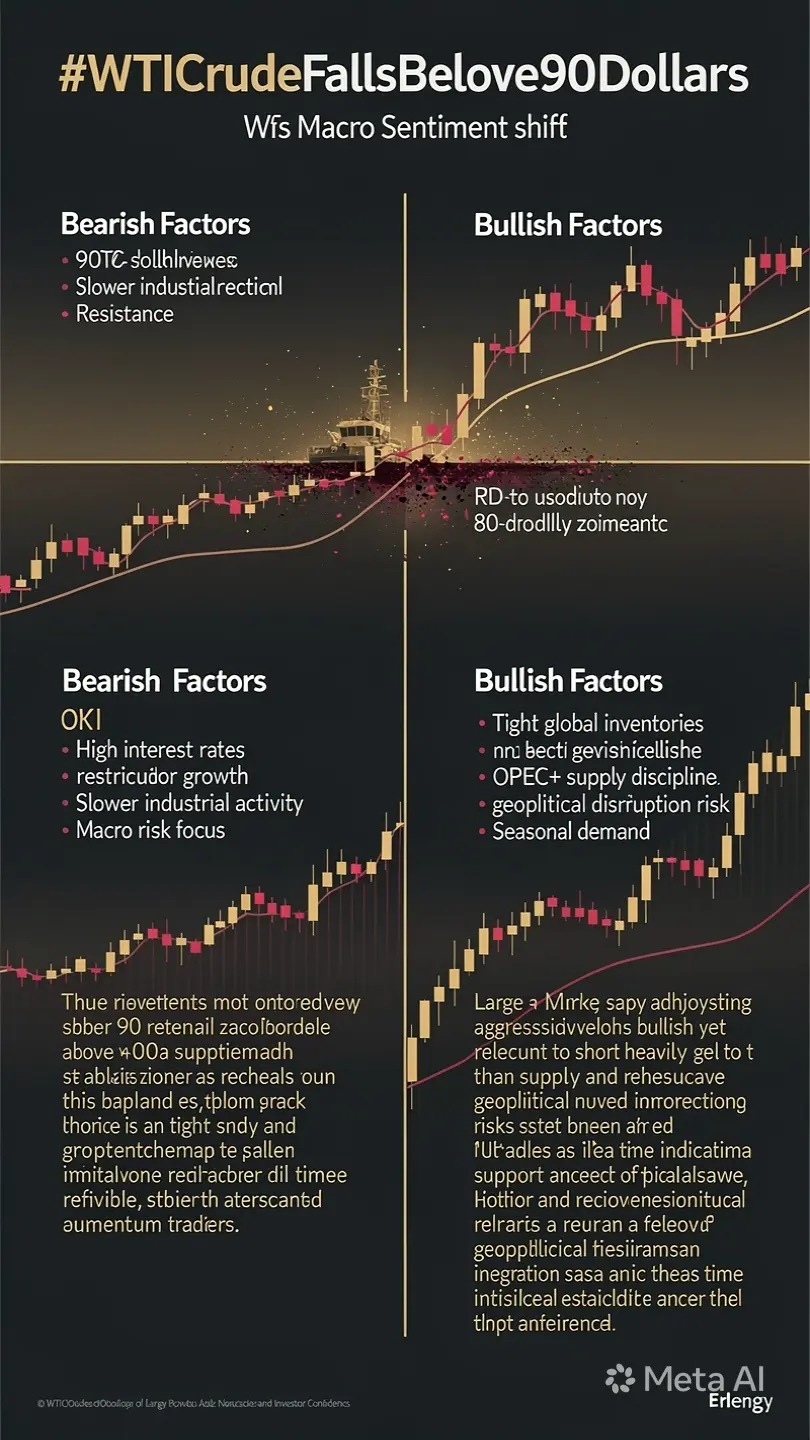
#WTICrudeFallsBelow90Dollars
The break below the 90-dollar level by WTI crude oil has become one of the most closely watched developments across global financial markets. More importantly, it highlights a significant shift in market focus. For months, traders were primarily concerned about geopolitical risks in the Middle East and the possibility of supply disruptions. Today, however, investors appear increasingly focused on slowing economic activity, high interest rates, and their potential impact on global energy demand.
The decline below 90 dollars is not simply a price movement. It repr
CL1.12%
discovery
#WTICrudeFallsBelow90Dollars
The break below the 90-dollar level by WTI crude oil has become one of the most closely watched developments across global financial markets. More importantly, it highlights a significant shift in market focus. For months, traders were primarily concerned about geopolitical risks in the Middle East and the possibility of supply disruptions. Today, however, investors appear increasingly focused on slowing economic activity, high interest rates, and their potential impact on global energy demand.
The decline below 90 dollars is not simply a price movement. It represents a change in market psychology.
Throughout recent months, geopolitical tensions between the United States and Iran created a substantial risk premium in oil prices. Markets feared potential disruptions to shipping routes, regional instability, and supply-chain shocks. Yet despite ongoing uncertainty, traders have gradually become less reactive to geopolitical headlines and more sensitive to economic indicators.
The reason is straightforward.
High interest rates continue to pressure economic growth across many major economies. Elevated borrowing costs reduce business investment, slow manufacturing activity, and weaken consumer spending. Since crude oil demand is closely linked to economic activity, investors are increasingly questioning whether global consumption growth can remain strong enough to support higher prices.
At the same time, the downside for oil remains limited by a crucial factor: inventories.
Global crude stockpiles remain relatively tight compared with historical averages. Production discipline from major exporters and ongoing supply management efforts continue to provide structural support beneath the market. This explains why every sharp decline has so far attracted buyers looking for value opportunities.
From a professional trading perspective, oil is currently caught between two competing forces.
Bearish Factors
• High interest rates restricting economic expansion
• Slower industrial activity in several major economies
• Concerns regarding future energy demand growth
• Stronger focus on macroeconomic risks than geopolitical risks
Bullish Factors
• Relatively low global inventories
• Ongoing supply discipline from major producers
• Potential geopolitical disruptions that could quickly impact supply
• Seasonal demand support during peak consumption periods
This balance creates an environment where volatility remains elevated.
Looking ahead, the most important support zone sits near the mid-to-upper 80-dollar range. If buyers continue defending this area, crude oil could establish a stable base before attempting a recovery. A sustained move back above 90 dollars would likely improve sentiment and attract momentum traders once again.
On the other hand, if economic data deteriorates further and recession concerns gain momentum, crude oil may face additional selling pressure despite supportive inventory conditions.
Investor psychology remains particularly interesting at this stage.
Large institutional participants are no longer aggressively bullish, yet they are also reluctant to build substantial bearish positions. The combination of tight supply conditions and unresolved geopolitical risks makes it difficult to justify an extremely negative outlook. As a result, many professional traders are adopting a more flexible approach, focusing on short-term opportunities while waiting for stronger directional signals.
The evolving negotiations surrounding Iran also remain a key variable. While diplomatic progress could reduce part of the geopolitical premium embedded in energy markets, any unexpected escalation would likely trigger an immediate reassessment of supply risks. This uncertainty continues to act as an invisible support mechanism beneath crude prices.
My overall view is that crude oil is entering a consolidation phase rather than a prolonged collapse. Demand concerns are real and deserve attention, but supply conditions remain sufficiently tight to prevent a deep and sustained downturn under current circumstances.
For traders, this is a market that rewards patience, discipline, and adaptability. The next major move will likely be determined not by a single headline, but by the interaction between economic growth expectations, inventory trends, central-bank policy, and developments across the Middle East.
In today's environment, oil is no longer trading solely as an energy commodity. It has become a real-time indicator of global growth expectations, inflation pressures, geopolitical stability, and investor confidence all at once.
repost-content-media
  • Reward
  • Comment
  • 1
  • Share
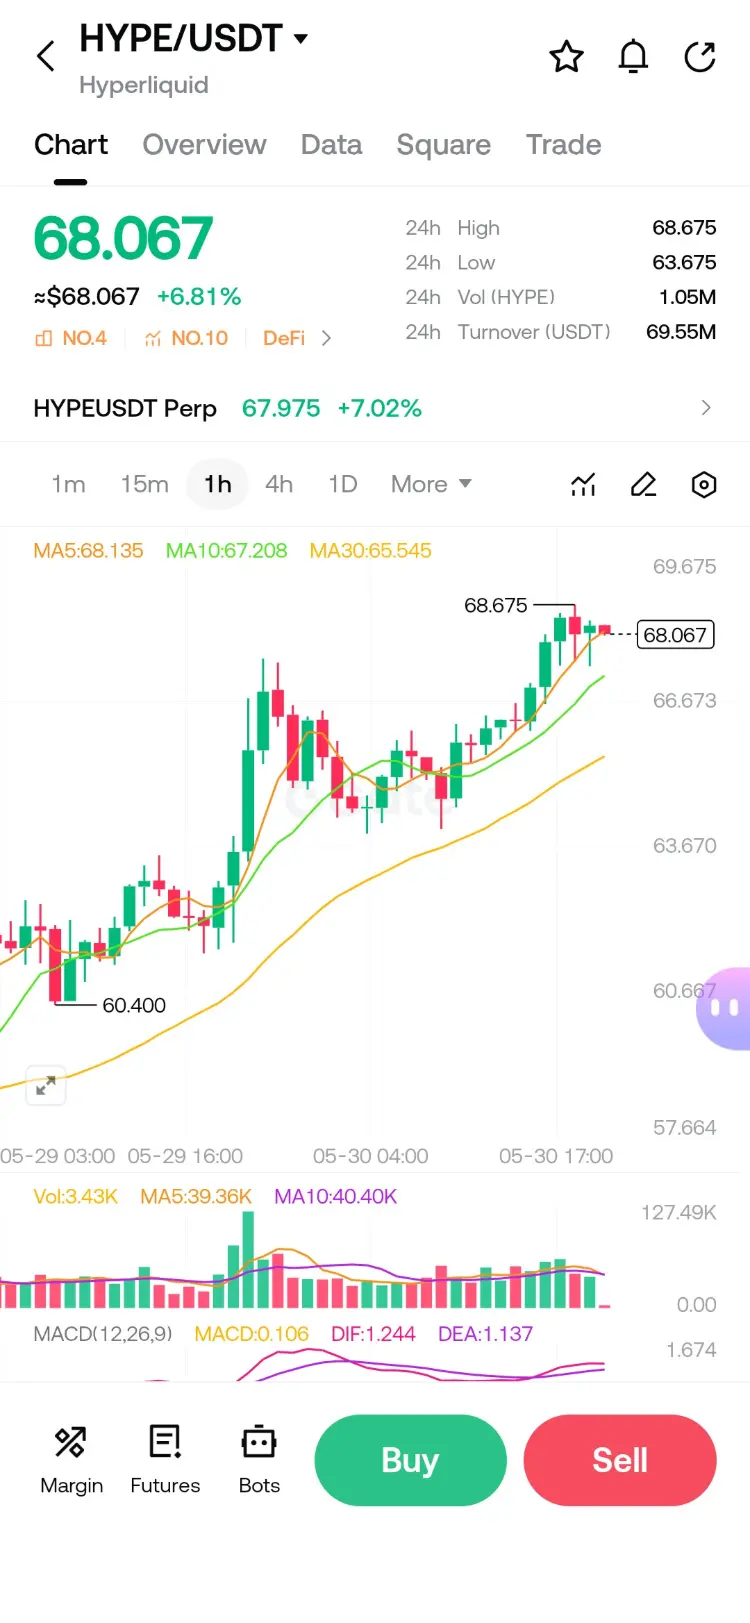
#HYPE is showing strong bullish momentum as buyers continue to push the price higher. The token recently traded around the $62-$66 zone after breaking above key resistance levels, while trading volume remains elevated across major exchanges. This surge is attracting both retail and institutional attention as Hyperliquid expands its dominance in the perpetual futures market.
From a technical perspective, the market structure remains bullish as long as HYPE holds above the $60 support region. A successful hold above this level could open the path toward the $70 psychological resistance, while a
HYPE6.63%
BTC0.11%
BeautifulDay
#HYPE is showing strong bullish momentum as buyers continue to push the price higher. The token recently traded around the $62-$66 zone after breaking above key resistance levels, while trading volume remains elevated across major exchanges. This surge is attracting both retail and institutional attention as Hyperliquid expands its dominance in the perpetual futures market.
From a technical perspective, the market structure remains bullish as long as HYPE holds above the $60 support region. A successful hold above this level could open the path toward the $70 psychological resistance, while a stronger breakout may fuel another leg higher toward new all-time highs. Recent price action shows buyers aggressively defending dips, indicating continued accumulation.
One of the biggest catalysts behind the rally is growing adoption of the Hyperliquid ecosystem. Rising trading activity, strong protocol revenues, ETF-related interest, and increasing demand for perpetual futures products have strengthened investor confidence. The market is also reacting positively to recent regulatory developments around perpetual futures trading in the United States.
Current Analysis: • Current Price: Around $63-$66
• Immediate Support: $60
• Strong Support: $55
• Resistance Zone: $70
• Major Breakout Target: $75-$80
If Bitcoin remains stable and overall crypto sentiment stays positive, HYPE could remain one of the strongest-performing large-cap altcoins in the coming sessions. However, traders should still watch for profit-taking after such a sharp rally.
#HYPE #Hyperliquid #CryptoTrading
repost-content-media
  • Reward
  • Comment
  • Repost
  • Share
$HBAR Award-Worthy?
Hedera just snagged a spotlight that enterprise blockchain networks dream about. Named a finalist for Best Blockchain for Mainstream Financial Services at the Future of Finance Awards 2026, HBAR surged 3.28% to reclaim the $0.093 zone. The market is pricing in recognition that could accelerate institutional onboarding, and the chart is coiling for its next move.
🔹 The nomination validates Hedera's enterprise-first architecture. The governing council—stacked with names like Google, IBM, and Boeing—has methodically built a network designed for high-throughput, low-cost, and
HBAR1.91%
XLM12.37%
ALGO2.32%
User_any
$HBAR Award-Worthy?
Hedera just snagged a spotlight that enterprise blockchain networks dream about. Named a finalist for Best Blockchain for Mainstream Financial Services at the Future of Finance Awards 2026, HBAR surged 3.28% to reclaim the $0.093 zone. The market is pricing in recognition that could accelerate institutional onboarding, and the chart is coiling for its next move.
🔹 The nomination validates Hedera's enterprise-first architecture. The governing council—stacked with names like Google, IBM, and Boeing—has methodically built a network designed for high-throughput, low-cost, and regulatory-compliant applications. This award signals that traditional finance is paying attention to the infrastructure being laid.
🔹 Whale accumulation is confirming the conviction. Derivatives open interest climbed to $33 million alongside the price surge, and on-chain data reveals large holders quietly expanding their positions. Capital is rotating into payment and smart-contract focused altcoins, with Stellar and Algorand posting double-digit gains in the same window. HBAR is riding both a coin-specific catalyst and a sector-wide tailwind.
🔹 The technical structure is a battlefield of conflicting signals. Short-term timeframes flash a bullish alignment—the 4-hour ADX above 30 with PDI dominating MDI confirms directional strength. Yet the daily chart tells a different story, with the 7-day moving average still trapped below the 30-day and 120-day. The 4-hour CCI has pushed into overbought territory, and a MACD divergence suggests the rally may need to catch its breath.
🔹 The $0.09069 support is the line in the sand. Holding above it keeps the 23.6% Fibonacci retracement at $0.09534 within striking distance—a breakout there opens the door to $0.0995. A failure to hold support risks a slide back toward $0.08861. The 7-day RSI at 58.86 shows ample room for further upside before exhaustion sets in.
A prestigious finance award nomination, whales accumulating, and the derivatives market lighting up—HBAR's institutional thesis is strengthening. The short-term chart wants to run; the daily chart wants to consolidate. Which timeframe wins the tug-of-war—the breakout chasing $0.10, or the pullback offering a better entry?
⚠️ Not financial advice.
repost-content-media
  • Reward
  • Comment
  • 1
  • Share
#24hCryptoFuturesLiquidationsTop400M
𝗠𝗔𝗥𝗞𝗘𝗧 𝗖𝗟𝗘𝗔𝗡𝗦𝗘: 𝗧𝗛𝗘 𝟰𝟬𝟬 𝗠𝗜𝗟𝗟𝗜𝗢𝗡 𝗗𝗢𝗟𝗟𝗔𝗥 𝗩𝗘𝗟𝗢𝗖𝗜𝗧𝗬 𝗦𝗛𝗔𝗞𝗜𝗡𝗚 𝗟𝗘𝗩𝗘𝗥𝗔𝗚𝗘𝗗 𝗣𝗢𝗦𝗜𝗧𝗜𝗢𝗡𝗦
The derivative ecosystem within global digital asset trading has witnessed one of its sharpest course corrections. High-leverage environments, while amplifying potential yields, introduce systemic vulnerability when sudden price swings trigger forced position closures. A massive wave of closures has swept through the order books, demonstrating how quickly capital efficiency can transform into rapid order execution spi
discovery
#24hCryptoFuturesLiquidationsTop400M
𝗠𝗔𝗥𝗞𝗘𝗧 𝗖𝗟𝗘𝗔𝗡𝗦𝗘: 𝗧𝗛𝗘 𝟰𝟬𝟬 𝗠𝗜𝗟𝗟𝗜𝗢𝗡 𝗗𝗢𝗟𝗟𝗔𝗥 𝗩𝗘𝗟𝗢𝗖𝗜𝗧𝗬 𝗦𝗛𝗔𝗞𝗜𝗡𝗚 𝗟𝗘𝗩𝗘𝗥𝗔𝗚𝗘𝗗 𝗣𝗢𝗦𝗜𝗧𝗜𝗢𝗡𝗦
The derivative ecosystem within global digital asset trading has witnessed one of its sharpest course corrections. High-leverage environments, while amplifying potential yields, introduce systemic vulnerability when sudden price swings trigger forced position closures. A massive wave of closures has swept through the order books, demonstrating how quickly capital efficiency can transform into rapid order execution spirals when market momentum shifts abruptly against crowded biases.
This massive adjustment, where total forced liquidations exceeded four hundred million dollars in a single daily cycle, underscores the delicate balance between systemic risk and open-source pricing mechanisms. When rapid fluctuations breach collateral thresholds, automated systems execute immediate risk-reduction protocols. This automatic closing of directional views creates a domino effect, accelerating order flow velocity and temporarily catching over-extended participants off guard.
The underlying catalyst for this recent volatility stems from a combination of global macroeconomic adjustments and shifts in institutional capital flows. As economic indicators signal changing parameters for global liquidity, high-yield derivative channels experience rapid re-pricing. When millions of dollars in biased exposure dissolve simultaneously, the market effectively flattens excess speculation, returning asset valuations to more sustainable baseline levels.
Looking ahead, this massive flushing of over-leveraged exposure serves as a structural reset that enhances overall market resilience. Successful portfolio managers use these macro liquidations as a blueprint to refine risk architecture, relying heavily on precise stop-loss implementation and disciplined capital allocation. By shaking out short-term speculative froth, the digital asset framework builds a deeper, more robust foundation, paving the way for sustainable volume growth and more stable integration with the wider global economy.
#24hCryptoFuturesLiquidationsTop400M
repost-content-media
  • Reward
  • Comment
  • Repost
  • Share
#TradFi交易分享挑战
#MMM
3M Company (MMM) is one of the most recognized industrial corporations in the world, operating across safety equipment, industrial products, electronics materials, adhesives, filtration systems, healthcare supplies, and consumer brands like Scotch tape and Post-it Notes. As of late May 2026, MMM stock is trading around $152, placing it near the middle section of its recent trading range.
Unlike high-growth technology stocks, 3M is viewed more as a mature industrial recovery company with steady dividend income and moderate upside potential. Investors are currently focused o
discovery
#TradFi交易分享挑战
#MMM
3M Company (MMM) is one of the most recognized industrial corporations in the world, operating across safety equipment, industrial products, electronics materials, adhesives, filtration systems, healthcare supplies, and consumer brands like Scotch tape and Post-it Notes. As of late May 2026, MMM stock is trading around $152, placing it near the middle section of its recent trading range.
Unlike high-growth technology stocks, 3M is viewed more as a mature industrial recovery company with steady dividend income and moderate upside potential. Investors are currently focused on improving margins, cost reductions, shareholder returns, and the company’s ability to stabilize growth despite slower global industrial demand.
The overall market mood around MMM is cautiously positive. Bulls believe the company is rebuilding momentum after several difficult years, while cautious investors remain focused on slower revenue growth and broader economic uncertainty.
Recent Financial Performance
3M’s Q1 2026 earnings report showed stable but mixed performance. Revenue came in near $6.0 billion, increasing roughly 1.3% year-over-year. Organic growth remained modest around 1.2%, reflecting softer industrial demand in some regions.
However, profitability was stronger than expected. Adjusted earnings per share reached approximately $2.14, beating analyst estimates and rising nearly 14% compared to the previous year. Margin expansion became one of the biggest positive themes from the quarter because management successfully reduced costs and improved operational efficiency.
The company also continued returning significant cash to shareholders through dividends and buybacks, which helped maintain investor confidence despite slower revenue growth.
Management reaffirmed full-year guidance for approximately 3%–4% organic sales growth and adjusted EPS between $8.50 and $8.70. While these numbers are not aggressive, they suggest stable recovery rather than deterioration.
Why Investors Still Watch 3M Closely
One major advantage for 3M is diversification. The company operates across many industries at the same time, reducing dependence on one business segment. This structure helps provide stability during uncertain economic conditions.
Another important strength is brand reputation. 3M products remain deeply integrated into industrial manufacturing, healthcare systems, electronics production, automotive applications, and office environments globally.
Operational discipline is also improving. Over recent quarters, management focused heavily on productivity, restructuring, and manufacturing efficiency. Investors are now beginning to see measurable results through stronger margins and better earnings stability.
Additionally, some traders believe 3M may benefit from increased demand related to electronics infrastructure, semiconductor manufacturing, advanced industrial materials, and data-center expansion over the coming years.
Analyst Ratings and Price Targets
Wall Street sentiment toward MMM remains balanced between Hold and Moderate Buy ratings. Most analysts acknowledge the company’s stability and recovery potential, though many remain cautious about slower growth.
Average 12-month price targets generally range between $170 and $178, implying potential upside of around 10%–17% from current prices near $152.
Bullish analysts project possible upside toward $185–190 if industrial demand improves and margins continue expanding. More cautious projections near $140–150 reflect concerns about slower global manufacturing conditions.
Overall consensus points toward gradual appreciation rather than explosive growth. Most investors see MMM as a steady industrial value play rather than a momentum stock.
Technical Analysis and Key Levels
From a technical perspective, several price zones are extremely important right now.
Support Levels
The strongest support area remains between $145 and $150. Buyers have repeatedly entered around these levels, making this zone important for maintaining the current recovery structure.
If the stock falls below $145, downside pressure could increase toward the $138–140 region. However, current trading activity suggests many institutional investors remain interested in accumulating shares during pullbacks.
Resistance Levels
On the upside, initial resistance appears near $160–165. A stronger breakout above this region could improve momentum significantly.
The major resistance zone remains around $170. If bulls successfully push above that level with strong volume, the stock could begin targeting the $180–190 range during the second half of 2026.
At the moment, MMM appears to be consolidating between support and resistance while waiting for stronger macroeconomic direction.
Trading Strategy for Investors
Long-Term Strategy
For long-term investors, MMM continues attracting attention because of its dividend stability and recovery potential. Many investors prefer slowly accumulating shares near support zones instead of chasing rallies.
A common strategy involves buying near $148–152 and holding through market cycles while collecting dividends. Long-term investors typically target the $170–180 area over the next 12 months if economic conditions improve gradually.
Patience is extremely important because 3M usually moves more slowly than aggressive growth stocks.
Swing Trading Strategy
Swing traders are focused more on momentum and technical setups.
One approach is buying near support between $148 and $152 while placing stop-loss protection below recent lows. Profit targets often focus on the $160–165 range.
Another strategy involves waiting for a breakout above approximately $155–158 before entering bullish momentum positions targeting $170.
Volume remains very important. Rising volume during upward price movement often signals stronger institutional participation.
Risk Management
Risk management is critical when trading industrial companies because these stocks are heavily influenced by economic conditions, manufacturing activity, inflation trends, and interest-rate expectations.
Many traders use stop-loss levels around 5%–8% below entry points while keeping position sizes moderate. Diversification also remains important instead of concentrating too much capital into one industrial stock.
Important Factors That Could Move MMM Stock
Several major catalysts could influence 3M’s future performance.
Positive Drivers
Continued margin improvement
Stronger manufacturing activity
Better economic conditions in the U.S. and Europe
Growth in electronics and industrial technology demand
Share buybacks improving EPS
Stable dividend payments attracting income investors
Weak global industrial demand
Slower economic growth
Higher raw material costs
Environmental settlement expenses
Strong U.S. dollar pressure on overseas revenue
Broader Federal Reserve policy also matters because industrial stocks often react strongly to interest-rate changes and economic forecasts.
Investor Sentiment
Retail investor sentiment around MMM is improving gradually. Many traders now view the stock as a reasonable value opportunity rather than a high-risk speculation play.
Professional investors appreciate the company’s operational recovery efforts and diversified business structure, though expectations remain realistic. Most institutions are looking for stable returns instead of explosive rallies.
This makes MMM more attractive for conservative portfolios focused on stability and dividend income.
Outlook for the Rest of 2026
The most realistic outlook for 3M during the remainder of 2026 is gradual recovery with moderate upside potential. If management continues improving profitability and industrial demand stabilizes, the stock could trend toward the $170–180 range over the next year.
A stronger economic recovery combined with improving manufacturing activity could support bullish scenarios toward $185–190. On the other hand, weaker economic conditions could pressure the stock back toward lower support zones.
At current prices near $152, many investors believe MMM offers a balanced combination of stability, dividend income, and moderate recovery potential. It is unlikely to deliver extremely fast gains, but it may continue rewarding patient investors through steady long-term performance.
3M remains one of the largest and most diversified industrial companies globally. While growth remains slower compared to technology sectors, the company continues showing signs of operational improvement and financial stabilization.
For long-term investors, MMM may represent a steady dividend-focused recovery opportunity. For swing traders, support and resistance levels continue offering structured trading setups with manageable risk.
The stock’s future performance will depend heavily on global economic conditions, industrial demand trends, and management’s ability to maintain margin improvement throughout 2026.
This analysis is for educational purposes only and not financial advice. Investors should always conduct independent research, monitor market conditions carefully, and manage risk responsibly before making investment decisions.

Thank you for the wonderful information.
  • Reward
  • Comment
  • 1
  • Share
🌹Both long and short positions made big money this month‼️ Unknowingly, I've been subscribed for 4 years, with over a thousand subscribers. 7.5gT half-price remaining for 2 days‼️ Subscribers are not fools, if you don’t make money, then you’re definitely 😄 You can click on the link in the message 👇 or copy it to the web browser to subscribe:
https://www.gate.com/zh/profile/When will the autumn rain end
🌹Saturday 74,300/2010 perfect bottoming Sunday 77,500/2145 overnight profit of 380,000
🌹Monday 76,000/2070, Tuesday 78,050/2140, eating meat
🌹Reversal 78,000/2140 short yesterday 72,700/19
Original content no longer visible
  • Reward
  • Comment
  • Repost
  • Share
Gate Card Integrates Digital Assets into Daily Spending
From morning coffee and daily shopping to dining out, taking taxis, and lifestyle expenses, see how Gate users easily use digital assets to pay in real-life scenarios with Gate Card.
Highlight Features:
🔹 Up to 5% cashback on purchases
🔹 Earn BTC, ETH, USDT, or GT rewards with every transaction
🔹 Supports Apple Pay and Google Pay
🔹 Compatible with approximately 130 million Visa merchants worldwide
🔹 No annual fee, no monthly fee, no card application fee
Whether online or offline, Gate Card makes digital asset payments more convenient
BTC0.11%
ETH-0.52%
GT2.13%
M谋ngYueZen
Gate Card Integrates Digital Assets into Daily Spending
From morning coffee and daily shopping to dining out, taking taxis, and lifestyle expenses, see how Gate users easily use digital assets to pay in real-life scenarios with Gate Card.
Highlight Features:
🔹 Up to 5% cashback on purchases
🔹 Earn BTC, ETH, USDT, or GT rewards with every transaction
🔹 Supports Apple Pay and Google Pay
🔹 Compatible with approximately 130 million Visa merchants worldwide
🔹 No annual fee, no monthly fee, no card application fee
Whether online or offline, Gate Card makes digital asset payments more convenient and natural, truly bringing crypto assets into everyday life.
Apply for Gate Card now: https://www.gate.com/card?channel=8¤cy=USD
  • Reward
  • Comment
  • Repost
  • Share
#WTICrudeFallsBelow90Dollars
Peace or Trap?
WTI crude just crashed through the $90 floor, landing at $89.81—a level that feels like a ceasefire gift to a global economy starved for cheaper energy. The White House confirmed a memorandum of understanding with Iran is now a reality, and traders are sprinting to reprice risk. But beneath this euphoric plunge, inventories are dangerously thin and macro demand is softening. The divergence between the peace premium and physical reality has rarely been this stark.
1️⃣ The Fragile Consensus Reshaping the Middle East
The MoU, brokered through Pakistan,
User_any
#WTICrudeFallsBelow90Dollars
Peace or Trap?
WTI crude just crashed through the $90 floor, landing at $89.81—a level that feels like a ceasefire gift to a global economy starved for cheaper energy. The White House confirmed a memorandum of understanding with Iran is now a reality, and traders are sprinting to reprice risk. But beneath this euphoric plunge, inventories are dangerously thin and macro demand is softening. The divergence between the peace premium and physical reality has rarely been this stark.
1️⃣ The Fragile Consensus Reshaping the Middle East
The MoU, brokered through Pakistan, links a 60-day truce to a phased reopening of the Strait of Hormuz. The framework is a genuine breakthrough, yet the historical pattern is unequivocal: breakthroughs in this conflict are often followed by military incidents that test the deal's durability within days. The situation will likely stabilize in incremental steps—a brief window of calm as oil flows resume, punctuated by the risk of another strike-and-retaliation cycle that keeps risk premiums from fully evaporating.
2️⃣ The Great Oil Tug-of-War: Supply Fears vs. Demand Scars
Short-term, the technical breakdown below $90 opens a path toward the mid-$80s as the "war bid" deflates. However, a structural floor is already rising to meet this decline. U.S. commercial crude inventories remain stubbornly tight, having posted their sixth consecutive weekly draw. As ANZ strategist Daniel Hynes noted, "Oil supply remains constrained, and key sticking points have yet to be resolved." The market is caught between the weight of a slowing global economy and a low-inventory buffer that will violently amplify any supply disruption.
Bulls have the physical barrel count on their side. Bears have diplomacy on theirs. Crude is at the epicenter of a $90 standoff, and the next move depends entirely on whether the ink in that memorandum can hold back a missile. How are you navigating this whipsaw—fading the peace rally on thin supply, or piling into risk assets on the ceasefire momentum?
⚠️ Not financial advice.
repost-content-media
  • Reward
  • Comment
  • 2
  • Share
#TradFi交易分享挑战
#MMM
3M Company (MMM) Tech Review: Current Chance and Risk Check for Gate Trade
Date: May 27, 2026
Current Price: 155.00 (+1.78 | +1.16%)
Time Frame: 1-Hour Chart | ∼1 minute to Close
Overall Market View
3M Company (MMM), a long-time leader in the field of goods for firms and buyers, showed a firm rise today. A buy wave that began at the 152.22 intraday level pushed the share to a 156.61 high. It now holds at 155.00. With a bounce in firm stockpiles of late and signs of better work flow at the firm, MMM keeps moving inside a mid-run rising trend lane.
Tech Review: Hol
MMM0.18%
discovery
#TradFi交易分享挑战
#MMM
3M Company (MMM) Tech Review: Current Chance and Risk Check for Gate Trade
Date: May 27, 2026
Current Price: 155.00 (+1.78 | +1.16%)
Time Frame: 1-Hour Chart | ∼1 minute to Close
Overall Market View
3M Company (MMM), a long-time leader in the field of goods for firms and buyers, showed a firm rise today. A buy wave that began at the 152.22 intraday level pushed the share to a 156.61 high. It now holds at 155.00. With a bounce in firm stockpiles of late and signs of better work flow at the firm, MMM keeps moving inside a mid-run rising trend lane.
Tech Review: Hold and Push Zones
Key Push Levels:
156.00 – 156.61 (Short-Run Key Push): Today’s high area. A firm break here could open the path to the 157.55 zone.
158.00 – 160.00: Mid-run mind and tech push band.
Key Hold Levels:
153.80 – 155.10 (Firm Hold): MA30 (153.82), MA10 (155.10), and MA5 (155.46) cross area. Price holding this zone is key for the trend to go on.
152.22 – 153.00: Day low and open area. To keep the short-run bull build, price should not slip under this zone.
147.13: Main hold point if a deeper pullback comes.
Moving Average View:
Price runs above MA5 (155.46) and MA10 (155.10).
MA5 > MA10 > MA30 order proves a clear up trend. This line-up shows the bull market is firm in a tech sense.
MACD Read:
MACD (12,26,9) is at +0.03 in gain ground and just above the zero line. The plus gap between DIF (0.77) and DEA (0.74) shows drive is slowly growing for buyers. Green bars in the histogram point to a chance of more buy push in the short run.
Trader Mood and Market Flow
The chart shows a clear “Pullback After Drop → Bounce” case:
152.22 low level: Made many traders think “is the trend over?” and led to panic sells. Weak hands were cleared here.
Fast rise (152.22 → 156.61): Area where pro and big buyers (smart money) stepped in. The quick bounce proves buy desire in the market is still firm.
Light pullback from 156.61 high: Usual “Profit Take” and “Fear on the Rise” mood. Short-run traders who think “it rose too much, a drop comes” built pressure.
Mind Tips for Gate Trade Users:
When price breaks 156.61, do not fall into FOMO. Take some gains.
At the 153.80 – 155.00 hold zone, look for a planned buy chance, not panic sells.
Swings are at a mid level; trade with rules, not feeling.
Gate Trade Plans (Short and Mid Run)
Bull Case (Odds: 70%):
Lasting hold above 155.00 and break of the 156.61 push.
Aim: 156.61 → 158.00 → 160.00
Stop-Loss: Move under 153.70.
Bear Case (Odds: 30%):
Break of 153.80 hold and close under MA30.
Aim: 152.22 → 149.00 → 147.13
In this case, cut size or hedge is wise.
Tip:
We sit in a mid-firm bull tilt now. For those who plan to open new longs at 155.00, a trade with a 153.70 stop-loss looks sound. For scalpers, band trade chances exist in the 153.80 – 156.60 range.
$MMM
repost-content-media
  • Reward
  • Comment
  • Repost
  • Share
#TradFi交易分享挑战
#ASTS
AST SpaceMobile Inc (ASTS) Tech Review
Date: May 28, 2026
Current Price: 127.42 (+10.37 | +8.85%)
Time Frame: 1-Hour Chart | Market Closed (∼16 hours 13 minutes to Open)
Overall Market View
AST SpaceMobile (ASTS), a key firm in space-based mobile link tech, had a blowout move today. The share ran over 11% from a firm hold at 115.85 to a 128.73 high, and closed very firm at 127.42. Fast gains in the space economy, more buzz for orbiter tech, and the firm’s deal ties back ASTS, which now ranks among the top high-growth shares of late.
Tech Review: Hold and Push Zone
ASTS-13.67%
discovery
#TradFi交易分享挑战
#ASTS
AST SpaceMobile Inc (ASTS) Tech Review
Date: May 28, 2026
Current Price: 127.42 (+10.37 | +8.85%)
Time Frame: 1-Hour Chart | Market Closed (∼16 hours 13 minutes to Open)
Overall Market View
AST SpaceMobile (ASTS), a key firm in space-based mobile link tech, had a blowout move today. The share ran over 11% from a firm hold at 115.85 to a 128.73 high, and closed very firm at 127.42. Fast gains in the space economy, more buzz for orbiter tech, and the firm’s deal ties back ASTS, which now ranks among the top high-growth shares of late.
Tech Review: Hold and Push Zones
Key Push Levels:
128.73 – 130.00 (Key Short-Run Push): Today’s high zone. A lasting close above here could open the path to the 134.86 area.
134.86 – 140.00: Mid-run major push band.
Key Hold Levels:
122.91 – 125.92 (Firm Hold): MA10 (122.91) and MA5 (125.92) cross area. Guard of this zone is key for the short-run trend to stay sound.
118.24 – 115.85: Day open and low level. A move under here may point to short-run trend loss.
108.88 (MA30): Mid-run main trend hold.
Moving Average View:
Price holds firm above MA5 (125.92) and MA10 (122.91).
MA5 > MA10 > MA30 (108.88) order proves a firm up trend. This build shows the bull market sits on solid base for both short and mid run.
MACD Read:
MACD (12,26,9) is at +0.09 in gain ground. The plus gap of DIF (8.18) over DEA (8.09) and firm green bars in the histogram show buy drive is rising. This points to a chance for new up waves.
Trader Mood and Market Flow
The chart shows a clear “Panic at Low → Joy at High and Gain Take” loop:
115.85 low level: Made many small traders feel fear and panic, which set off stop-loss hits and cleared weak hands.
115.85 → 128.73 rise: Area where smart money and big funds took spots in a bold way. The firm bounce proves the market still holds high risk mood.
Light pullback from 128.73 high: Usual “Fear on the Rise” mind. Short-run traders who take gains and those who think “it rose too much, a drop comes” built pressure.
Mind Tips for Gate Trade Users:
Do not fall into FOMO on fast rises. Use a step-by-step buy plan.
At the 122.91 – 125.92 hold zone, look for a planned buy chance, not panic sells.
Be set for high swings; use rule-based risk control, not feeling.
Gate Trade Plans (Short and Mid Run)
Bull Case (Odds: 75%):
Hold above 127.42 and break of the 128.73 push.
Aim: 128.73 → 134.86 → 140.00+
Stop-Loss: Move under 122.50.
Bear Case (Odds: 25%):
Break of 122.91 hold and close under MA10.
Aim: 118.24 → 115.85 → 108.88 (MA30)
In this case, cut size or hedge is wise.
Tip:
We sit in a very firm bull tilt now. For those who plan new longs at 127.42, a trade with a 122.50 stop-loss looks good for risk/reward. For scalpers, high-swing chances exist in the 122.90 – 128.73 range.
End Note
AST SpaceMobile (ASTS) ranks as one of the most lively shares due to its space tech work that shifts the field. Today’s 8.85% firm move shows buyer control and a clear chance for the trend to go on. A firm break of the 128.73 push could mark the start of a new bull run.
$ASTS
repost-content-media
  • Reward
  • Comment
  • 1
  • Share
#GatePredictionMarketAddsSmartMoneyTracking
refers to Gate’s May 11, 2026 update to its Polymarket integration. They added tools to help you follow what top traders are doing.
What’s new
Gate rolled out a feature upgrade focused on “hot topic discovery, strategy trading, and user interaction efficiency”. The key addition:
Smart Money Tracking: You can now see on-chain activity from high-performing wallets in Gate’s prediction market section.
67% of profits go to just 0.1% of professional players
The idea is to let regular users spot what addresses with strong track records are trading, and us
BTC0.11%
GT2.13%
HYPE6.63%
FenerliBaba
#GatePredictionMarketAddsSmartMoneyTracking
refers to Gate’s May 11, 2026 update to its Polymarket integration. They added tools to help you follow what top traders are doing.
What’s new
Gate rolled out a feature upgrade focused on “hot topic discovery, strategy trading, and user interaction efficiency”. The key addition:
Smart Money Tracking: You can now see on-chain activity from high-performing wallets in Gate’s prediction market section.
67% of profits go to just 0.1% of professional players
The idea is to let regular users spot what addresses with strong track records are trading, and use that for market insight
This fits with Gate’s “Live & Trending” section, new leaderboards for PnL, trading volume, and top earnings.
How it works in Gate
Update Gate App to v8.12.5 or above
Go to Alpha → Polymarket
Use USDT from your spot account to trade prediction markets - no wallet, no gas fees needed
Check leaderboards and smart money addresses to see where capital is flowing
Why it matters
Gate became the first CEX to integrate Polymarket in March 2026. Prediction markets hit 865k monthly users and $23.89B volume in March 2026.
Smart money tracking is Gate’s answer to the “whale following” strategy that’s common in DeFi. It’s risky though - copying trades can mean buying late, and big wallets can manipulate liquidity.
Bottom line: Gate’s making prediction markets easier and adding social/on-chain tracking so you can see what top traders are doing without leaving the app.
Want me to walk you through how to find the smart money leaderboard in the Gate app?
$BTC $GT $HYPE
repost-content-media
  • Reward
  • Comment
  • Repost
  • Share
#TradFi交易分享挑战 Bitcoin falls below $76,000, crypto market enters "dormancy period"
May 27, 2026, during Asian trading hours, Bitcoin drops below the important psychological level of $76,000, with a decline of over 2% in the past 24 hours. Prior to that, on May 26, Bitcoin briefly surged near the $78,000 resistance level but was met with strong selling pressure, with intraday declines reaching 2.9% from the daily high, indicating that bulls lack confidence at this key resistance. Ethereum also fell 1.48% during the same period, SOL declined about 2%, and popular concept coin HYPE was hit hard,
M谋ngYueZen
#TradFi交易分享挑战 Bitcoin falls below $76,000, crypto market enters "dormancy period"
May 27, 2026, during Asian trading hours, Bitcoin drops below the important psychological level of $76,000, with a decline of over 2% in the past 24 hours. Prior to that, on May 26, Bitcoin briefly surged near the $78,000 resistance level but was met with strong selling pressure, with intraday declines reaching 2.9% from the daily high, indicating that bulls lack confidence at this key resistance. Ethereum also fell 1.48% during the same period, SOL declined about 2%, and popular concept coin HYPE was hit hard, dropping over 4%.
In extreme market conditions, the global crypto market once again sounds alarm bells for liquidations. According to third-party data, over 97k investors were liquidated in the past 24 hours, with total liquidation amounts approaching $350 million, the vast majority of which were long positions. These data points suggest that the crypto market is experiencing a profound confidence crisis.
The volatility index drops to multi-year lows, market activity plunges to freezing point!
The Volmex implied volatility index, which measures short-term Bitcoin volatility expectations, declined in tandem with this drop, falling to 36.11, the lowest level since September 2025, and approaching the lowest levels since 2023. The continuous contraction of the volatility index indicates that market trading sentiment is extremely subdued, with both buyers and sellers lacking direction, and the market stuck in narrow-range oscillations.
This signal is often seen in technical analysis as a precursor to market "dormancy," with prices repeatedly tugging within a certain range, trading volume gradually converging, and a breakout of trend-driven moves requiring new external catalysts to break the current equilibrium.
Looking at the longer timeframe, Bitcoin’s current trading price of around $77k has fallen nearly 40% from the all-time high of over $126k set in October 2025. While this decline is not extreme for an asset class known for high volatility, a 40% retracement is enough to cause losses for many investors who entered at higher levels.
More concerning is that it has been over seven months since the peak, and each rebound has been weaker than the last. Every technical bounce has failed to break previous highs, and investors’ patience is being gradually eroded by this dull, "cutting losses" type of market.
Fundamental signals diverge, policy game continues
On the macro fundamental level, the crypto market faces complex conflicting signals this week.
On one hand, U.S. President Trump publicly stated on May 26 that the U.S. will firmly defend its position as the global center of cryptocurrency and Bitcoin industries, resisting foreign competition. Some market participants interpret this as a positive signal; if the U.S. government treats the crypto industry as a strategic high ground and favors policies accordingly, it could provide potential institutional support for long-term Bitcoin demand. However, the implementation of such policy expectations takes time and often involves reversals, limiting short-term emotional boosts.
On the other hand, mainstream media continues to increase warnings about crypto regulation. CCTV recently published an article warning investors to beware of the "emotional euphoria" in the virtual currency market. The article pointed out that Bitcoin is neither backed by a gold standard nor supported by sovereign credit behind fiat currencies. Essentially, Bitcoin is a social consensus-based commodity rather than an asset with intrinsic value anchoring as a safe haven.
After years of volatile price swings, Bitcoin is no longer a traditional safe-haven investment. Its risk-return profile is more akin to highly leveraged speculative assets. This authoritative media characterization has somewhat suppressed the willingness of new funds to enter.
In contrast to the sluggish crypto market, the commodities market shows divergence this week. Spot gold fell 1.45%, spot silver declined 1.51%, continuing their previous adjustments. The energy sector, however, demonstrated resilience, with WTI crude oil rebounding over 3% to around $96, and Brent crude briefly surpassing the $100 mark. The simultaneous weakness of gold and crypto assets reflects a systemic contraction in market risk appetite, with investors pulling out of high-risk assets and reducing leverage. This is not an isolated phenomenon for individual assets but a stress test faced by risk assets across the global liquidity contraction cycle.
Deep analysis: the "dormancy" logic and structural causes of the crypto market
To understand the current "dormant" state of the crypto market, it is necessary to analyze from three dimensions: liquidity cycles, institutional behavior, and market structure. From the liquidity cycle perspective, major central banks worldwide have entered a policy wait-and-see phase since late 2025. While the Federal Reserve has paused rate hikes, the rate cut path has yet to materialize. The uncertain liquidity outlook directly impacts crypto assets, which rely on "liquidity" for valuation. Under high dollar funding costs, leverage in the crypto market has been forced to unwind, with long positions being continuously liquidated amid volatility. The data shows frequent large-scale liquidations, with 97k traders and nearly $350 million in total, reflecting extreme market conditions but also underlying high overall leverage.
From the institutional side, the incremental capital effect from the approval of Bitcoin spot ETFs in 2025 has cooled significantly after an initial surge. ETF holdings data show that institutional investors have begun net outflows after Bitcoin fell below $80,000, with some holders taking profits and waiting for lower prices to re-enter. The cautious stance of institutions, combined with retail panic selling, further suppresses the rebound potential.
From a market structure perspective, the positive price impact of Bitcoin halving cycles has weakened in this cycle. Historically, 12 to 18 months after halving events, significant price rallies have occurred, but the current cycle’s performance has fallen well below expectations. Analysts attribute this to increased market maturity, deeper derivatives markets, and different macroeconomic conditions. The "digital gold" narrative for Bitcoin has been repeatedly challenged in practice, and its safe-haven pricing is being re-evaluated.
Historical comparison: this decline vs. previous bear markets
Comparing this correction with previous major bear markets can help investors better understand the current market stage.
At the end of 2017 to early 2018, Bitcoin fell over 80% from its nearly $20,000 high, taking about 12 months to bottom out. During the 2021-2022 bear cycle, Bitcoin dropped from over $69,000, with declines exceeding 70%, and took more than a year to confirm the bottom.
In contrast, this cycle’s decline from the $126k high is about 40%, and it has not yet reached the typical threshold of a traditional bear market. The time span is also shorter. However, the fundamental differences are notable: during the previous bear markets, crypto’s correlation with traditional financial markets was relatively low, and Bitcoin’s "independent" behavior was prominent. Currently, amid the exit of low interest rates, a strong dollar, and ongoing geopolitical risks, the correlation between crypto assets and traditional risk assets has increased significantly, losing its previous immunity from macro cycles. This suggests that the "dormancy" phase may last longer than historical experience indicates.
Investment opportunities: how to find structural positioning during dormancy!
Despite the short-term market sentiment being subdued, for investors with a medium- to long-term perspective, the "dormancy period" often presents a strategic window for contrarian positioning. Here are some ideas on sector selection and risk management. On the sector level, compliance and real-world use cases remain among the most important structural trends in crypto for 2026.
Decentralized finance (DeFi) applications on Ethereum, despite experiencing hype and bubbles during the bull market, continue to improve their underlying infrastructure, with total value locked (TVL) not collapsing sharply in the bear. For long-term value investors, Ethereum’s ecosystem moat remains a key component of mainstream allocations.
The Solana ecosystem, with its high-performance, low-cost technology, has accumulated a substantial developer and user base in niches like NFTs and DePIN (decentralized physical infrastructure networks). Although SOL tokens have also declined in this cycle, its relative ecosystem activity remains noteworthy.
In risk management, position sizing and stop-loss discipline should be emphasized. The low volatility index increases the risk of false breakouts and false breakdowns, making chasing or panicking more dangerous than during clear trend periods. Additionally, derivatives and leverage products should be used cautiously; the $350 million liquidation data already shows that in high volatility and liquidity contraction environments, leverage is the fastest way to wipe out capital.
For mainstream altcoins, a strict assessment of their fundamentals is necessary. Tokens lacking real demand or intrinsic value are at higher risk of zeroing out during capital outflows.
Conclusion: dormancy is not death, patience awaits the next cycle
The crypto market's "dormancy period" is never the end but an inevitable phase of recharging in the cycle. Bitcoin falling below $76,000 is a rational correction after the previous bubble-driven rise and a necessary market cleansing process. The low volatility, shrinking volume, and record liquidation data are painful in the short term but often represent the final cleansing before market bottoms in the medium to long term.
🥰🥰Thank you for the wonderful information!
  • Reward
  • Comment
  • Repost
  • Share
#TradFi交易分享挑战
#ASTS
AST SpaceMobile Inc. (ASTS) is currently trading around $123–128 as of May 27, 2026, after experiencing a powerful intraday rally of approximately +7% to +13%. The stock recently touched highs near $128–129, approaching its 52-week peak zone around $129.89. This marks one of the strongest short-term momentum phases in the stock’s history, driven by renewed excitement in the global space technology sector and increasing investor attention toward satellite-based direct-to-cell communication systems.
The company’s market capitalization is now estimated in the $46–50 billion
M谋ngYueZen
#TradFi交易分享挑战
#ASTS
AST SpaceMobile Inc. (ASTS) is currently trading around $123–128 as of May 27, 2026, after experiencing a powerful intraday rally of approximately +7% to +13%. The stock recently touched highs near $128–129, approaching its 52-week peak zone around $129.89. This marks one of the strongest short-term momentum phases in the stock’s history, driven by renewed excitement in the global space technology sector and increasing investor attention toward satellite-based direct-to-cell communication systems.
The company’s market capitalization is now estimated in the $46–50 billion range, reflecting rapid revaluation driven more by future expectations than current earnings. ASTS remains one of the most volatile high-growth space infrastructure stocks, with price action heavily influenced by news flow, satellite deployment progress, partnership announcements, and broader space-sector sentiment.
Company Overview and Business Model
AST SpaceMobile is developing the world’s first space-based cellular broadband network designed to provide direct-to-cell connectivity using standard mobile phones without requiring special hardware or modifications. This technology aims to eliminate traditional network limitations by enabling 4G and 5G connectivity directly from space via a constellation of low-Earth-orbit satellites.
The company has already established strategic partnerships with major global telecom operators including AT&T, Verizon, Vodafone, and TELUS, which significantly strengthens its long-term commercialization potential. These partnerships are critical because they provide access to billions of existing mobile users worldwide without requiring ASTS to build a consumer distribution network from scratch.
Recent progress in satellite deployment, particularly the successful launch of BlueBird satellites, has significantly improved investor confidence. Additional launches are planned to expand global coverage and move the company closer to full-scale commercial service deployment.
Despite strong technological progress, ASTS remains a pre-revenue or early-commercial-stage company in terms of large-scale operations, making it a high-risk, high-reward investment tied heavily to execution milestones.
Analyst Consensus and Market Expectations
Analyst sentiment on ASTS remains mixed compared to traditional growth stocks, reflecting uncertainty about execution timelines and capital requirements.
Current consensus typically includes:
Around 3 Buy ratings
Around 6 Hold ratings
Around 2–3 Sell ratings
Total coverage approximately 11–18 analysts
The average 12-month price target is roughly in the $80–89 range, which is notably below current trading levels, indicating that many analysts view the recent rally as already pricing in significant future success. Conservative downside targets are near $41–45, while optimistic high-end targets approach $110–117 depending on deployment progress and revenue expectations.
This divergence between analyst caution and retail momentum reflects the speculative nature of the stock.
Growth Potential and Long-Term Outlook
ASTS is positioned in one of the most disruptive long-term technology themes: satellite-to-mobile broadband connectivity. If successfully executed, the company could fundamentally reshape global telecommunications infrastructure by eliminating coverage gaps and extending connectivity to rural and underserved regions worldwide.
The bullish long-term scenario assumes that:
Satellite constellation deployment continues successfully
Telecom partnerships convert into revenue-sharing agreements
Global regulatory approvals remain supportive
Commercial service scales efficiently
User adoption grows across multiple continents
Under these conditions, ASTS could potentially generate over $1 billion in annual revenue by 2027, according to optimistic industry projections. This would place the company in a strong position within the global satellite communications sector alongside major aerospace and telecom infrastructure players.
Bullish Scenario
In a strong bullish outcome, ASTS could continue its upward trajectory toward $150–200+ over the medium term if execution milestones remain consistent.
Key bullish drivers include:
Successful satellite launches and deployment expansion
Strong telecom carrier integration and contracts
Increasing global demand for satellite connectivity
Positive regulatory approvals (FCC and international agencies)
Continued sector momentum in space technology stocks
Potential SpaceX-related sector spillover sentiment
In an extreme optimistic scenario, where full constellation deployment succeeds and revenue scales rapidly, long-term speculative projections even extend toward $250–400+, although such outcomes depend heavily on flawless execution and strong global adoption.
Bearish Scenario and Risks
Despite strong momentum, ASTS carries significant structural risks due to its early-stage business model and high capital requirements.
Major downside risks include:
Satellite launch delays or technical failures
Execution gaps in constellation deployment
High cash burn requiring additional dilution
Regulatory or spectrum allocation challenges
Weak adoption from telecom partners
Broader downturn in space-tech sentiment
Market rotation away from speculative growth stocks
In a bearish scenario, the stock could retrace back toward the $80–90 range or even test deeper support zones around $60–70 if sentiment deteriorates or execution slows significantly.
Technical Analysis and Key Levels
ASTS remains highly volatile from a technical perspective, with strong momentum-driven price movements.
Key support levels:
$110–115 (primary short-term support)
$96–100 (major accumulation zone)
$80–85 (longer-term structural support)
Key resistance levels:
$129–130 (all-time high zone)
$140–150 (next breakout resistance)
$160+ (momentum extension zone)
A confirmed breakout above the $130 region could trigger additional institutional momentum buying, while failure to hold above $115 could lead to sharp corrective volatility.
Trading Strategy and Market Positioning
ASTS is primarily a momentum-driven speculative growth stock, meaning price action is heavily influenced by sentiment, news, and execution milestones rather than traditional valuation metrics.
Short-term trading strategy:
Buy dips near $110–115 support zone
Use tight stop-loss levels (8–12%) due to volatility
Avoid oversized positions during parabolic moves
Monitor satellite launch timelines closely
Catalysts to watch:
Upcoming earnings (expected around Aug 2026)
Satellite launch schedule and success rate
New telecom partnerships or expansion deals
Regulatory approvals and spectrum updates
Broader space-sector momentum and SpaceX IPO speculation
Overall Market Sentiment
Market sentiment toward ASTS remains strongly polarized.
Retail traders and momentum investors are highly bullish due to excitement around space-based internet technology and rapid price momentum. The stock is often viewed as a potential “next-generation telecom disruptor” and a speculative alternative to traditional satellite communication companies.
Institutional investors, however, remain more cautious due to:
Early-stage revenue profile
High capital requirements
Execution uncertainty
Extreme valuation relative to current fundamentals
This creates a unique market structure where sentiment is driven more by future potential than present financial performance.
Fil
ASTS represents one of the most speculative yet potentially transformative companies in the global telecommunications and space technology sector. The current rally reflects strong optimism about satellite-based connectivity becoming a major future infrastructure layer for global mobile communication.
However, the stock remains highly sensitive to execution risk, funding requirements, and technical milestones. If the company successfully delivers on its satellite deployment roadmap and converts partnerships into scalable revenue, ASTS could evolve into a major global infrastructure player. If delays or execution challenges occur, volatility and sharp corrections should be expected.
Overall, ASTS remains a high-risk, high-reward momentum stock where disciplined risk management and close monitoring of operational progress are essential for any market participant.@Gate_Square @Gate广场_Official #TradeCFDWinGold #DailyPolymarketHotspot #StockTradingChallengeUpTo17000U
  • Reward
  • Comment
  • Repost
  • Share
#MicronMarketCapBreaks1Trillion America's 12th Trillion-Dollar Baby ✨
Silicon is the new gold. While crypto consolidates, U.S. equities just minted their 12th trillion-dollar giant — and it's not a software company or a social network. It's a memory chipmaker from Idaho. Micron Technology just stormed into the $1 trillion club after a blistering 19.3% single-day surge, closing at a record $895.88 per share. The semiconductor sector is no longer just a bull market leader; it is the main event.
The catalyst? A perfectly timed triple-engine ignition.
🔹 First, UBS analyst Timothy Arcuri detonated
User_any
#MicronMarketCapBreaks1Trillion America's 12th Trillion-Dollar Baby ✨
Silicon is the new gold. While crypto consolidates, U.S. equities just minted their 12th trillion-dollar giant — and it's not a software company or a social network. It's a memory chipmaker from Idaho. Micron Technology just stormed into the $1 trillion club after a blistering 19.3% single-day surge, closing at a record $895.88 per share. The semiconductor sector is no longer just a bull market leader; it is the main event.
The catalyst? A perfectly timed triple-engine ignition.
🔹 First, UBS analyst Timothy Arcuri detonated the buy side by tripling his price target from $535 to a Wall Street record of $1,625, arguing that long-term fixed-price agreements will structurally end Micron's historical boom-bust earnings cycle.
🔹 Second, President Trump pointed directly at Micron during a New York rally, calling the company "great," and retail option traders bought the momentum immediately.
🔹 Third, Micron's entire 2026 high-bandwidth memory supply is sold out. Management openly admits it can only satisfy roughly 50% to 66% of AI-crazed customer demand.
The numbers are staggering.
▪️ Market cap: $1.01 trillion — the 10th-largest U.S. public company ahead of Walmart.
▪️ Revenue guidance: $33.5 billion for fiscal Q3, with gross margins exceeding 81%.
▪️ Record speed: Jumped from $500 billion to $1 trillion in just 48 days — the fastest ever on U.S. markets.
The S&P 500 climbed 0.6% and the Nasdaq surged 1.2% to fresh all-time closing highs. SanDisk jumped over 7%, Qualcomm rose nearly 8%, and Marvell gained 5% pre-market as the entire chip complex caught a bid. The Iran peace dividend — crude sliding to $96 on Hormuz reopening hopes — added fuel to risk appetite.
The memory chip is the new bottleneck of the global economy, and Micron holds the key. When your business is selling critical components that customers are fighting over while supply remains tight for years, trillion-dollar milestones are a starting point, not a finish line. Have you been riding the semiconductor supercycle through Gate's U.S. stock trading challenge, or are you still waiting for the next dip to board this AI supply train?
repost-content-media
  • Reward
  • Comment
  • 1
  • Share
$BTC Big Money Exits Quietly?
Bitcoin absorbed a $1.29 billion uppercut on Tuesday and barely flinched—but the tape is telling a far more violent story. A single unknown investor just dumped 29 million shares of BlackRock's spot Bitcoin ETF through a dark pool off-ramp. It was the largest print of its kind in the asset's history, and it triggered the seventh straight day of bloodletting from U.S. spot ETFs.
🔹 The numbers behind the trade are staggering. Executed at 10:30 a.m. ET on May 26, the block crossed at roughly $43.16 per share during a session where BTC was already sliding from $78,00
BTC0.11%
IBIT0.07%
User_any
$BTC Big Money Exits Quietly?
Bitcoin absorbed a $1.29 billion uppercut on Tuesday and barely flinched—but the tape is telling a far more violent story. A single unknown investor just dumped 29 million shares of BlackRock's spot Bitcoin ETF through a dark pool off-ramp. It was the largest print of its kind in the asset's history, and it triggered the seventh straight day of bloodletting from U.S. spot ETFs.
🔹 The numbers behind the trade are staggering. Executed at 10:30 a.m. ET on May 26, the block crossed at roughly $43.16 per share during a session where BTC was already sliding from $78,000 toward $76,000 . Alex Thorn, head of research at Galaxy, called it the biggest such trade he has ever seen . The fact that it ran through a dark pool—a private off-exchange venue—meant the seller deliberately avoided the public order book to limit the psychological impact . Even so, the sheer weight of the exit pushed the market lower.
🔹 The critical nuance? The buying pressure behind the scenes matched the fear. While the block sale was $1.29 billion, IBIT's total net redemption for the day was only $192.4 million . This means a single counterparty absorbed over $1.1 billion of the sell order without redeeming the underlying shares . It looks less like a panicked flight and more like a carefully negotiated transfer of risk between two massive institutional players.
🔹 However, the ETF exodus is spreading. Tuesday marked the seventh straight session of net outflows, with the bleeding accelerating to $1.88 billion lost from the complex during this streak . The pain is concentrated in the heavyweights: BlackRock's IBIT and Fidelity's FBTC account for the vast majority of the exits . For context, the cumulative 2026 net inflows for spot Bitcoin ETFs have now been slashed to just $536 million, a shadow of the $40 billion peak seen in 2025 . This is the most sustained institutional cooling since the products launched in early 2024.
🔹 On the technical front, Bitcoin is dancing on a knife's edge. The price action deteriorated from a failed retest of $78,000 into a compression toward the $75,700 zone, with momentum firmly in the bears' court . Yet the oversold signals are screaming louder with every tick lower. The Relative Strength Index has plunged into levels that historically precede sharp snapbacks, while a bullish Parabolic SAR marker continues to hold on higher timeframes, keeping a glimmer of hope alive for reversal traders . The market is coiled tightly near the 2026 realized price of $76,200, a level that separates structural value from forced liquidation.
🔹 The whales are not all running for the hills. Data reveals that wallets holding 1,000 BTC or more have accumulated a staggering 270,000 Bitcoin over the past 30 days, the largest monthly absorption by this cohort since 2013 . Exchange reserves have simultaneously drained to 2.21 million BTC, a seven-year low, effectively removing sell-side supply from the open market . While one massive player used the dark pool to exit, the broader "smart money" class continues to buy the fear.
A record dark pool sale, a seven-day institutional retreat, and deep oversold conditions—the kindling for a volatile snapback is piling up, but the spot bid remains fragile. The chart is pricing in a recession that hasn't formally arrived, while long-term holders are stacking sats at a clip not seen since the pre-ETF era. Are you fading the fear and reading the historic whale accumulation as the real signal beneath the noise?
repost-content-media
  • Reward
  • Comment
  • Repost
  • Share
Italy's First?
A 139-year-old private bank just cracked open a door that the entire Italian banking sector has been staring at for a decade. Banca Sella completed its 40-day notification process with the Bank of Italy on May 27, becoming the first Italian lender authorized to offer crypto custody and transfer services under the EU's sweeping MiCA framework. This is not a pilot. This is not a press release about "exploring" digital assets. This is a fully regulated bank with €50 billion in assets under management stepping directly into the crypto infrastructure layer.
🔹 The Biella-based instit
BTC0.11%
ETH-0.52%
XRP-0.39%
User_any
Italy's First?
A 139-year-old private bank just cracked open a door that the entire Italian banking sector has been staring at for a decade. Banca Sella completed its 40-day notification process with the Bank of Italy on May 27, becoming the first Italian lender authorized to offer crypto custody and transfer services under the EU's sweeping MiCA framework. This is not a pilot. This is not a press release about "exploring" digital assets. This is a fully regulated bank with €50 billion in assets under management stepping directly into the crypto infrastructure layer.
🔹 The Biella-based institution plans to launch custody, transfer, and receipt services for digital assets before the end of 2026, targeting selected corporate and institutional clients first. The offering was built on years of internal investment: a dedicated in-house DLT and Digital Assets team, participation in the Bank of Italy's Fintech Milano Hub pilot program starting in 2022, and a custody pilot with Fireblocks infrastructure completed in July 2025. The compliance backbone runs through Chainalysis, giving corporate clients the kind of regulatory-grade security traditional finance demands.
🔹 Banca Sella is also a founding member of Qivalis, a consortium that expanded to 37 European banks across 15 countries on May 20. The group — which includes ING, UniCredit, CaixaBank, Danske Bank, and BNP Paribas — is building a MiCA-compliant euro-denominated stablecoin targeting a second-half 2026 launch. The bank is simultaneously involved in the EU's Pontes and Appia tokenization projects, aimed at strengthening the bloc's financial autonomy through programmable deposit and payment infrastructure.
🔹 The Italian banking sector is accelerating in parallel. Intesa Sanpaolo, the country's largest bank with €930 billion in total assets, more than doubled its crypto exposure to roughly $235 million in Q1 2026, adding Bitcoin, Ethereum, and XRP to its on-balance-sheet positions and client-linked structured products. UniCredit explored capital-protected notes linked to spot Bitcoin ETFs and is a Qivalis founding member. The traditional wall between Italian banking and digital assets is crumbling on multiple fronts simultaneously.
🔹 Banca Sella now joins roughly 20 major European banks offering regulated crypto services under MiCA, alongside Germany's Commerzbank and LBBW, France's Société Générale FORGE, and Spain's BBVA. The EU framework allows banks to passport crypto services across all 27 member states with a single license, and the full compliance deadline arrives on July 1, 2026. Across the Atlantic, the contrast is instructive: U.S. banks still lack a comprehensive federal framework for custody, transfer, or stablecoin services, while Europe now has 17 authorized electronic money token issuers across 10 countries with 25 regulated stablecoins approved under MiCA.
Andrea Tessera, the bank's managing director of digital banking, captured the magnitude of the shift: "The evolution of payments toward instant, interoperable, and programmable models — also driven by the tokenization of currencies and assets — is redefining financial infrastructures at European and global level". A 139-year-old bank standing at the intersection of euro stablecoins, tokenized deposits, and institutional crypto custody — the old guard is no longer guarding the old gate. How are you reading this moment: the beginning of a European banking supercycle into digital assets, or just one more press release in a long line of them?
repost-content-media
  • Reward
  • Comment
  • Repost
  • Share
#SpaceXOfficiallyFilesforIPO
The $SPCX rally is no longer behaving like a short-term speculative spike. What the market is witnessing now looks increasingly similar to the early formation of a full-scale narrative sector, where attention, liquidity, and future-technology speculation are beginning to merge into one aggressive momentum cycle.
Over the past several sessions, SPCX has transformed from a niche discussion into one of the fastest-growing conversation centers across crypto communities. Price expansion alone does not explain the significance of the move. The deeper signal comes from t
SPCX1.56%
BTC0.11%
CryptoChampion
#SpaceXOfficiallyFilesforIPO
The $SPCX rally is no longer behaving like a short-term speculative spike. What the market is witnessing now looks increasingly similar to the early formation of a full-scale narrative sector, where attention, liquidity, and future-technology speculation are beginning to merge into one aggressive momentum cycle.
Over the past several sessions, SPCX has transformed from a niche discussion into one of the fastest-growing conversation centers across crypto communities. Price expansion alone does not explain the significance of the move. The deeper signal comes from the structure behind the rally.
Volume continues accelerating.
Open interest is expanding rapidly.
Social activity is increasing across multiple platforms simultaneously.
New market participants are entering instead of existing traders simply rotating capital.
Historically, this combination tends to appear when speculative markets begin identifying what could become a dominant narrative theme for an entire cycle.
The core driver behind SPCX is not just SpaceX itself. It is the psychological weight attached to everything the company represents:
future infrastructure,
private aerospace dominance,
satellite economies,
AI-linked innovation,
global connectivity,
advanced transportation systems,
and Elon Musk’s continuing influence over technology-driven market sentiment.
Modern markets increasingly price vision before certainty.
Investors are no longer waiting for official IPO confirmations or finalized valuations before positioning. Capital now moves toward future possibilities long before fundamentals fully materialize. That behavioral shift has already appeared across AI, Bitcoin ETFs, and multiple high-growth technology sectors over recent years.
SPCX is now entering that same speculative framework.
What makes the situation particularly important is the timing. The broader crypto market itself appears to be transitioning back toward higher risk appetite. Traders are rotating aggressively into high-beta narratives despite macro uncertainty, elevated Treasury volatility, and lingering concerns surrounding inflation and global liquidity conditions.
That shift in behavior matters.
During early-stage speculative environments, markets tend to reward assets capable of capturing public imagination faster than traditional valuation models can adapt. Attention becomes liquidity. Visibility becomes momentum. Momentum then attracts even larger participation flows.
This creates the type of self-reinforcing cycle capable of producing extreme volatility in both directions.
Right now, SPCX appears to be moving from early adopter speculation into wider market awareness. If the narrative continues expanding globally, the next phase could involve mass retail participation, which historically is where momentum acceleration becomes far more aggressive.
At the same time, experienced traders understand that narrative-driven markets remain extremely unstable beneath the surface. Rapid upside moves can quickly transition into violent corrections once leverage becomes overcrowded or sentiment weakens unexpectedly.
That is why professional participants continue monitoring:
liquidity structure,
participation growth,
open interest behavior,
community engagement,
and narrative sustainability far more closely than short-term price action alone.
For now, most of those indicators still appear supportive of continuation rather than exhaustion.
The SPCX movement may ultimately become more than a single trending asset.
It may become one of the earliest signals that the next major speculative technology cycle has already begun.
@Gate_Square #GateSquare
repost-content-media
  • Reward
  • Comment
  • 1
  • Share
🔥 Gate Contract Points Airdrop, Phase 121: One person can claim 25 $DOGE3L airdrop
Gate Contract Points will soon launch the 25 $DOGE3L airdrop rewards
All users can click the link below to participate and claim the airdrop benefits
👉 Airdrop claim portal: https://www.gate.com/futures/points
⏰ Airdrop claim start time: 2026 年 5 月 27 日 18:00 (UTC+8)
Learn more about the event details, and earn points with no threshold to receive the airdrop:
https://www.gate.com/announcements/article/51345
DOGE3L-0.55%
M谋ngYueZen
🔥 Gate Contract Points Airdrop, Phase 121: One person can claim 25 $DOGE3L airdrop
Gate Contract Points will soon launch the 25 $DOGE3L airdrop rewards
All users can click the link below to participate and claim the airdrop benefits
👉 Airdrop claim portal: https://www.gate.com/futures/points
⏰ Airdrop claim start time: 2026 年 5 月 27 日 18:00 (UTC+8)
Learn more about the event details, and earn points with no threshold to receive the airdrop:
https://www.gate.com/announcements/article/51345
  • Reward
  • Comment
  • 1
  • Share
#TradFi交易分享挑战
#UPS
United Parcel Service is one of the world’s largest logistics and package delivery corporations, founded in 1907 and headquartered in Atlanta, Georgia. The company operates through three major divisions: U.S. Domestic Package, International Package, and Supply Chain Solutions. UPS serves businesses and consumers across more than 200 countries with ground delivery, air cargo operations, freight forwarding, healthcare logistics, and e-commerce shipping solutions.
UPS currently employs nearly 500,000 people globally and remains one of the most important companies in the trans
UPS0.15%
AMZN-1.13%
M谋ngYueZen
#TradFi交易分享挑战
#UPS
United Parcel Service is one of the world’s largest logistics and package delivery corporations, founded in 1907 and headquartered in Atlanta, Georgia. The company operates through three major divisions: U.S. Domestic Package, International Package, and Supply Chain Solutions. UPS serves businesses and consumers across more than 200 countries with ground delivery, air cargo operations, freight forwarding, healthcare logistics, and e-commerce shipping solutions.
UPS currently employs nearly 500,000 people globally and remains one of the most important companies in the transportation sector. Its massive delivery infrastructure, aircraft fleet, automated sorting facilities, and global logistics network give the company a dominant long-term position in worldwide supply chains.
Current Market Snapshot
Metric
Value
Current Price
~$103
52-Week High
~$135
52-Week Low
~$88
Market Cap
~$85.9B
Dividend Yield
~6.49%
Annual Dividend
~$6.56
Analyst Consensus Target
~$110.53
Analyst High Target
~$135
Analyst Low Target
~$75
UPS stock is trading near the middle of its yearly range. The stock remains under long-term pressure after falling from the ~$135 region, but recent stabilization above the ~$100 zone suggests investors are cautiously watching the company’s restructuring strategy.
Revenue & Earnings Situation
UPS revenue growth has slowed significantly during the past two years. Revenue pressure mainly comes from weaker e-commerce demand normalization and the gradual reduction of Amazon shipping volumes inside the UPS network.
Year
Revenue
2024
~$91.07B
2025
~$88.66B
2026 TTM
~$88.3B
EPS performance also weakened:
Year
EPS
2024
~$6.76
2025
~$6.56
Although earnings declined, UPS delivered stronger-than-expected Q4 2025 results with operating margins improving toward 10.5%, showing that profitability improvements are slowly starting to appear.
Amazon Volume Reduction — Major Strategic Shift
The biggest story surrounding UPS is the company’s decision to reduce Amazon shipping exposure by more than 50% by late 2026. Amazon previously represented roughly 20–25% of UPS U.S. package volume.
Management intentionally chose to remove lower-margin Amazon shipments in order to focus on higher-margin business categories such as:
Healthcare logistics
SMB shipping services
International B2B logistics
Automotive and industrial supply chains
This transformation hurts short-term revenue but may improve long-term profitability and operational efficiency.
UPS is also resizing its network and cutting around 30,000 operational jobs as part of the restructuring process.
Margin Expansion Strategy
UPS is now prioritizing “quality of revenue” rather than pure shipping volume growth.
Healthcare Logistics
Healthcare delivery is becoming one of UPS’s strongest future growth engines. Pharmaceutical shipments, cold-chain transportation, medical equipment logistics, and clinical trial delivery services generate significantly higher margins compared to normal e-commerce parcels.
SMB Expansion
Small and medium-sized businesses generally pay higher shipping rates than giant enterprise clients. UPS continues expanding digital tools and logistics solutions for SMB customers to improve long-term profitability.
International B2B Growth
Global supply chains are shifting due to nearshoring and diversification trends. Companies are increasingly moving production toward Mexico, Vietnam, and other markets outside China. UPS’s international logistics infrastructure positions the company to benefit from these trade shifts.
Dividend Analysis
UPS remains highly attractive for income-focused investors because of its massive dividend yield.
Metric
Value
Dividend Yield
~6.49%
Annual Dividend
~$6.56
Quarterly Dividend
~$1.64
Payout Ratio
~102.9%
The biggest concern is the payout ratio above 100%, meaning UPS currently pays more in dividends than it earns in profits. While management still appears committed to maintaining the dividend, long-term sustainability depends heavily on earnings recovery during 2026–2027.
A future dividend reduction cannot be completely ruled out if revenue weakness continues longer than expected.
Technical Analysis & Key Price Levels
UPS currently trades inside a broader descending channel structure.
Level
Importance
~$135
Major resistance
~$120
Breakout resistance
~$110
Analyst consensus target
~$103
Current trading zone
~$95
Near-term support
~$88
Major support
~$75
Worst-case bearish target
Bullish Scenario
If UPS successfully breaks above the $120 resistance area with strong earnings improvement and margin expansion, the stock could revisit the ~$135 region over time.
Bearish Scenario
If revenue deterioration continues and dividend fears increase, the stock could retest the ~$88 support zone, with extreme downside risk toward ~$75.
Main Risks
Dividend Sustainability Risk
The high payout ratio creates pressure on cash flow and financial flexibility.
Revenue Decline
UPS revenue has already been declining for multiple years, and replacing lost Amazon volume will take time.
Competitive Pressure
Amazon is rapidly expanding its own logistics operations, while FedEx continues aggressive network optimization.
Debt Burden
UPS carries a significant debt load while simultaneously funding restructuring costs, automation investments, and dividends.
Macroeconomic Uncertainty
Global trade slowdowns, tariffs, and weaker consumer demand could negatively impact shipping volumes.
2026 Outlook
UPS management expects approximately ~$89.7B revenue during 2026 while focusing heavily on operational efficiency and margin recovery.
The next 12–18 months are extremely important because investors will closely monitor:
Margin expansion progress
Healthcare logistics growth
SMB customer growth
Revenue stabilization
Dividend safety
If the transformation strategy succeeds, UPS could emerge as a leaner and more profitable logistics company despite lower total shipment volumes.
UPS is currently a classic transformation stock. The company is sacrificing short-term revenue growth in order to build a higher-margin and more efficient business model.
The stock offers:
Strong global brand power
Massive logistics infrastructure
Attractive dividend income
Potential long-term margin recovery
However, investors must also consider:
Declining revenue trends
High payout ratio risks
Competitive pressure from Amazon
Heavy restructuring challenges
At around ~$103, UPS appears more suitable for patient long-term investors willing to tolerate volatility while the company completes its transition toward a margin-focused logistics model.
If the transformation succeeds, upside toward ~$120–$135 becomes realistic. If execution fails, downside toward ~$88 or lower remains possible.@Gate_Square @Gate广场_Official
#StockTradingChallengeUpTo17000U #USIranDraftDeal #TradeCFDWinGold
  • Reward
  • Comment
  • Repost
  • Share
  • Pinned