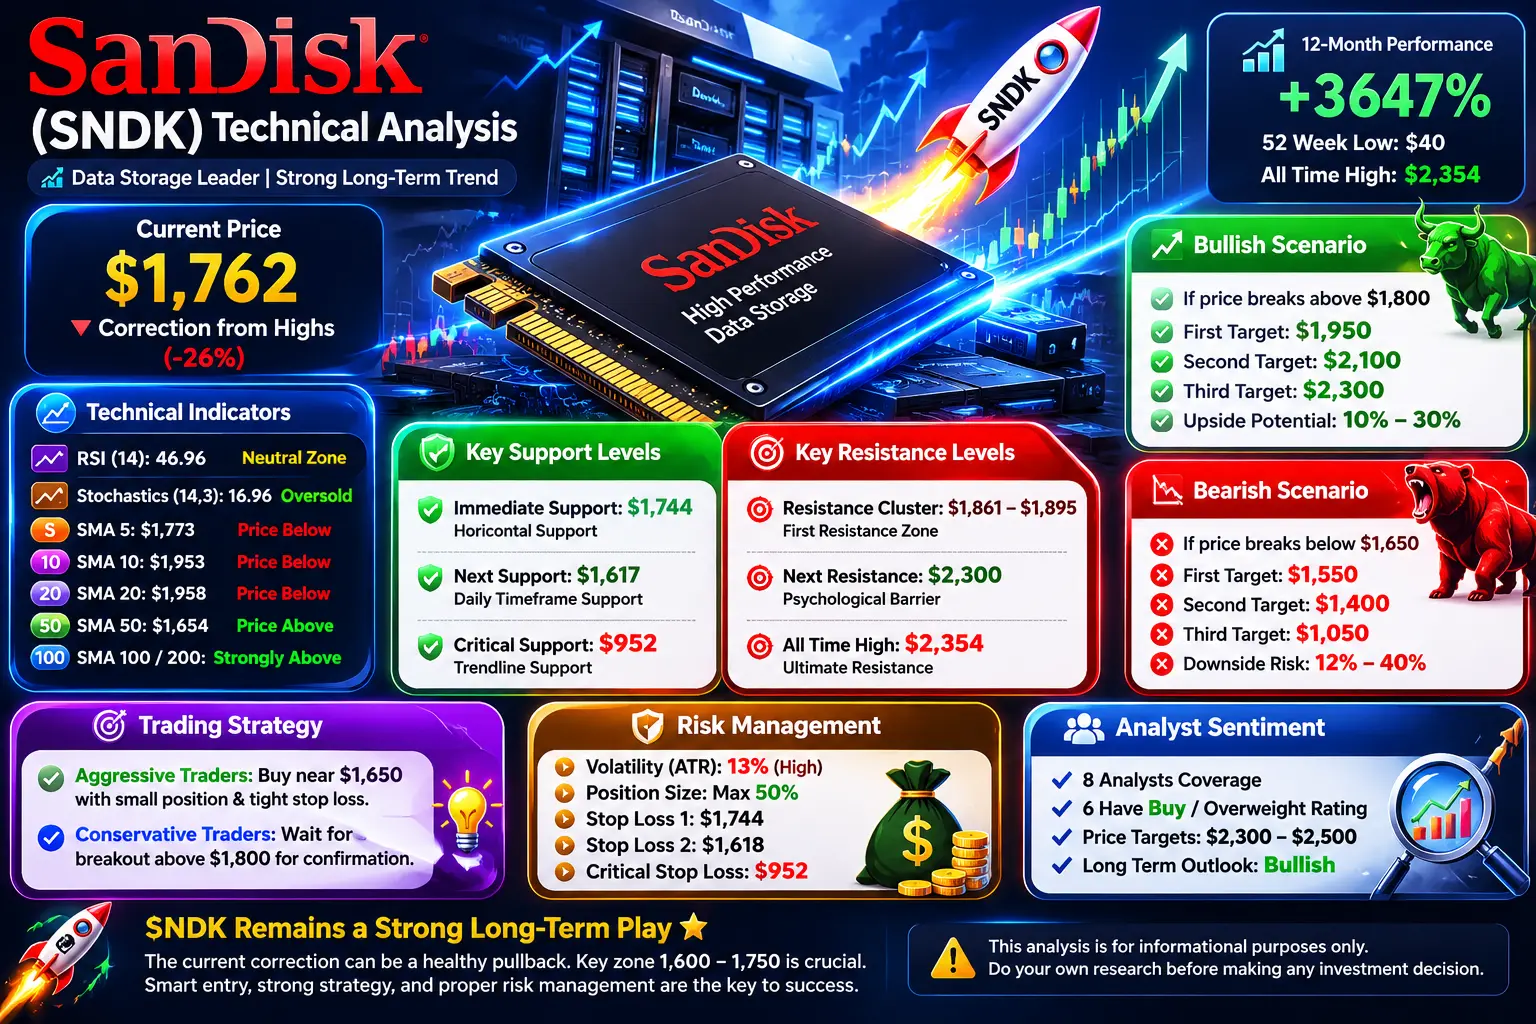
GateUser-0ab08321

vip
Age 0.6 Year
Peak Tier 0
No content yet
#CryptoMarketsDipSlightly
#CryptoMarketsDipSlightly 📉
Market Cooling, Not Cracking — A Strategic Pause After the Rally
The cryptocurrency market is currently undergoing a controlled and technically healthy pullback rather than showing any signs of structural weakness, with Bitcoin (BTC) trading near $76,305 after facing a firm rejection at the critical $79,000–$80,000 resistance band, a zone that has acted as a psychological and liquidity barrier for multiple attempts, and this decline—roughly a 2–3% move from recent highs—falls well within the normal volatility range of digital assets, wher
BTC0.35%
ETH1.7%
HighAmbition
#CryptoMarketsDipSlightly
#CryptoMarketsDipSlightly 📉
Market Cooling, Not Cracking — A Strategic Pause After the Rally
The cryptocurrency market is currently undergoing a controlled and technically healthy pullback rather than showing any signs of structural weakness, with Bitcoin (BTC) trading near $76,305 after facing a firm rejection at the critical $79,000–$80,000 resistance band, a zone that has acted as a psychological and liquidity barrier for multiple attempts, and this decline—roughly a 2–3% move from recent highs—falls well within the normal volatility range of digital assets, where such fluctuations are not only expected but necessary to sustain long-term bullish momentum, while Ethereum (ETH) is reflecting similar behavior with slightly higher relative weakness, consolidating near support as capital rotates and traders reassess positioning, and importantly, the broader crypto market cap has only seen a mild contraction, reinforcing the narrative that this is a pause in momentum rather than an exit of capital.
What Triggered the Dip — A Confluence of Technical & Macro Forces
This pullback is not driven by panic but by a layered combination of technical rejection, macro pressure, and liquidity mechanics working together in a synchronized manner, beginning with the classic resistance rejection where BTC failed to secure acceptance above $80K, triggering algorithmic selling and short-term bearish momentum, followed by profit-taking behavior after a strong multi-week rally where BTC gained significantly, encouraging both retail traders and institutional desks to lock in profits, while macroeconomic uncertainty—particularly geopolitical tensions and rising oil prices—has introduced a temporary risk-off tone across global markets, reducing aggressive buying in high-volatility assets like crypto, and in addition, low liquidity conditions have amplified price movement, allowing relatively small sell pressure to push prices down more aggressively than usual, further intensified by liquidation cascades in leveraged positions, where forced selling accelerates short-term downside but does not necessarily reflect true market sentiment.
Market Structure — Still Bullish, Just Resetting
From a structural perspective, the market remains firmly within a bullish framework, characterized by higher lows, strong support reactions, and the absence of panic-driven volume spikes, indicating that this is a consolidation phase rather than a reversal, where the market is effectively resetting after an extended move upward, allowing new buyers to enter and weak hands to exit, and for BTC, the $75,000–$76,000 zone currently acts as a critical support cluster supported by historical demand, and holding above this level keeps the bullish structure intact, while a breakdown below $72,000 would shift the narrative toward a deeper corrective phase, potentially targeting the $68,000–$70,000 region, whereas on the upside, the $79,000–$80,000 resistance remains the key breakout trigger, where a strong daily close backed by volume could open the path toward $82,000 and beyond, and similarly for ETH, the $2,250–$2,300 region acts as a short-term demand zone with resistance near $2,350–$2,400, showing a parallel consolidation pattern that reflects dependence on BTC’s directional clarity.
Hidden Signals — What Smart Money Is Really Doing
Beneath the surface, the behavior of institutional players provides a clearer picture than price action alone, as accumulation trends remain visible through reduced exchange balances and strategic positioning during dips, suggesting that large players are not exiting but optimizing entries, while retail sentiment indicates hesitation rather than panic, which is typically seen during healthy corrections, and this divergence often signals that the market is transitioning rather than reversing, as experienced participants accumulate during uncertainty while others wait for confirmation, and another key insight is that volatility without strong volume expansion suggests a lack of conviction from sellers, reinforcing the idea that the downside move is more liquidity-driven than structurally bearish.
Key Levels & Market Scenarios — The Decision Zone
The market is currently positioned at a critical decision point where the next major move will be defined by reactions at key levels, with three primary scenarios unfolding based on price behavior, including a bullish continuation scenario where BTC reclaims $78,000 and breaks above $80,000 with strong volume, signaling renewed momentum and continuation toward higher targets, a sideways consolidation scenario—which is currently the most likely short-term outcome—where price oscillates between $75,000 and $78,500 creating range-bound conditions, and a bearish extension scenario triggered by a confirmed breakdown below $72,000, leading to deeper correction zones near $70,000, and in all cases, volume confirmation and reaction speed remain critical validation tools.
Trading Strategy — How to Navigate This Phase
In the current environment, traders should shift from aggressive trend-chasing to calculated and disciplined execution, focusing on high-probability setups rather than emotional decisions, where one effective approach is to consider scaling into positions near strong support zones such as $75K–$76K instead of entering after impulsive moves, while breakout traders should wait for a confirmed daily close above $80K with strong volume before entering continuation trades, and for those trading ranges, buying near support and reducing exposure near resistance remains a practical approach as long as the market stays within the defined boundaries, and importantly, leverage should be kept low to avoid unnecessary liquidation risk during volatile conditions, while stop-loss placement below key invalidation levels—such as below $75K for short-term longs—helps protect capital, and traders should also monitor volume closely because breakouts without volume often result in fake moves, whereas strong volume at support typically signals accumulation.
What’s Next — Tactical Plan & Forward Outlook
Looking ahead, the market is likely to remain in a short-term consolidation phase before making its next decisive move, and the immediate focus should be on how BTC reacts around the $75K–$76K support zone and the $78K–$80K resistance range, because holding support and gradually reclaiming higher levels would indicate strength and prepare the market for another breakout attempt toward $82K+, while failure to hold support could open the door for a deeper correction toward $72K and potentially $70K, making patience and confirmation essential before taking larger positions, and from a tactical standpoint, traders should prioritize capital preservation, keep some liquidity available for potential dips, and avoid overcommitting in uncertain conditions, while continuously tracking macro developments and overall market sentiment, because the next major move will likely be triggered by a combination of technical breakout and external catalysts rather than isolated price action.
Final Outlook — A Pause Before Expansion
In conclusion, this dip is best understood as a strategic pause rather than a warning signal, where the market is cooling after an extended rally, recalibrating liquidity, and preparing for its next directional move, with the overall trend still intact as long as key support levels hold, and the absence of panic selling combined with ongoing accumulation behavior reinforces the bullish macro structure, meaning that the market is not breaking—it is stabilizing before its next expansion phase, and in this environment, disciplined strategy, patience, and reaction to confirmation will define success far more than prediction.
repost-content-media
  • Reward
  • Comment
  • Repost
  • Share
#DailyPolymarketHotspot
#DailyPolymarketHotspot 🔥📊
The Rise of Information Markets — Where Probability Becomes Price
In today’s fast-moving financial world, the most valuable asset is no longer just capital or commodities—it is information, and more importantly, how quickly that information is converted into actionable insight, and this is exactly where Polymarket is redefining the landscape by transforming uncertainty into tradable probability, allowing global events to be priced in real time rather than debated through delayed opinions or static forecasts, creating a system where markets
UMA2.69%
BTC0.35%
HighAmbition
#DailyPolymarketHotspot
#DailyPolymarketHotspot 🔥📊
The Rise of Information Markets — Where Probability Becomes Price
In today’s fast-moving financial world, the most valuable asset is no longer just capital or commodities—it is information, and more importantly, how quickly that information is converted into actionable insight, and this is exactly where Polymarket is redefining the landscape by transforming uncertainty into tradable probability, allowing global events to be priced in real time rather than debated through delayed opinions or static forecasts, creating a system where markets act as live intelligence engines that continuously update based on new data, sentiment, and capital flow.
From Opinion to Capital — A Shift in How We Predict the Future
Traditional forecasting relies heavily on opinions, surveys, and expert analysis, but prediction markets introduce a more disciplined model where participants must back their beliefs with money, which fundamentally changes behavior because financial risk filters out weak assumptions and emotional bias, and when a market assigns a price like $0.70 to an outcome, it represents a 70% probability derived from real trading activity, not speculation alone, meaning every trade contributes to a constantly evolving forecast that reflects collective conviction rather than passive opinion.
Real-Time Intelligence — Faster Than News, Sharper Than Polls
One of the most powerful advantages of prediction markets is their speed, as they process and reflect information almost instantly, often reacting to developments before traditional media narratives are formed, and whether it is crypto volatility, central bank decisions, political events, or geopolitical tensions, these markets absorb new information and translate it into price movements within seconds, effectively turning trading activity into a real-time sentiment indicator that can reveal shifts in expectations long before they become obvious elsewhere.
Technology & Trust — The Backbone of Modern Prediction Markets
The efficiency and reliability of this system are supported by blockchain infrastructure, particularly through Polygon, which enables fast, low-cost transactions, making participation smooth and accessible for a wide range of users, while the use of stable assets like USD Coin ensures that volatility comes from the event being traded rather than the currency itself, and equally critical is the role of decentralized verification systems such as UMA Protocol, which provide transparent and dispute-driven outcome resolution, ensuring fairness without relying on centralized authority, thereby strengthening trust in a system where financial outcomes depend on accurate results.
Market Dynamics — Sentiment, Liquidity, and Opportunity
While prediction markets offer powerful insights, they are still influenced by human behavior and market mechanics, where liquidity plays a crucial role in determining accuracy, as highly active markets tend to produce more reliable probabilities while low-volume markets can be distorted by small trades, and emotional trading remains a key factor, especially during major events where fear or excitement can temporarily misprice outcomes, creating opportunities for disciplined traders who understand that the real edge lies not in predicting the final result, but in identifying when the market’s current probability diverges from reality and adjusting positions accordingly.
BTC Context — Linking Price Action with Market Expectations
At the same time, in the broader crypto market, Bitcoin is currently trading around $76,305 after facing rejection near the $79K–$80K resistance zone, placing it in a short-term consolidation phase where the market is cooling rather than breaking down, and this is where combining price action with prediction market data becomes extremely powerful, because while charts show support and resistance levels, platforms like Polymarket reveal how traders are pricing the probability of future moves in real time.
Polymarket Example — Pricing the Next Move
Consider a live-style scenario on Polymarket
where the market asks: “Will BTC reach $80,000 before April 30?”
• If the “Yes” share trades at $0.65–$0.70, it reflects a 65–70% probability, signaling bullish expectations and confidence in a move higher
• If it trades near $0.50, it indicates uncertainty, aligning with a range-bound market between $75K–$78K
• If it drops to $0.30–$0.35, it reflects weakening sentiment and a higher probability of BTC failing to reach $80K, increasing the risk of a move toward $72K
The key insight here is not just the probability itself, but how it changes over time, because rising probability often signals accumulation before price moves, while falling probability can act as an early warning of weakening momentum even if price has not yet reacted.
Trading Strategy — Using Probability as an Edge
To navigate this environment effectively, traders should combine technical levels with probability shifts, focusing on confirmation rather than prediction, where holding above $75K alongside rising Polymarket probabilities strengthens the bullish case, while stable price with declining probabilities signals hidden weakness, and sharp drops in probability can indicate early-stage breakdown risk, and strategies such as scaling into support zones, waiting for volume-backed breakouts, avoiding over-leverage, and maintaining strict risk management remain essential, especially in conditions where sentiment can shift rapidly due to external news or liquidity changes.
Challenges & Future Outlook — Beyond Speculation
As prediction markets continue to grow, they also face challenges including regulatory scrutiny, concerns about insider trading, and the limitations of simplifying complex real-world outcomes into binary contracts, yet despite these issues, institutional interest is rising as these platforms prove valuable not just for trading but for understanding real-time market psychology and collective expectations, suggesting that in the future, prediction markets could become key tools for decision-making across finance, politics, and global strategy.
Final Perspective — The Future Is Being Priced in Real Time
In conclusion, Polymarket represents a major evolution in how we interpret the future, transforming information into a tradable asset and uncertainty into measurable probability, and when combined with real-time price action from assets like Bitcoin, it creates a powerful framework where traders are no longer just reacting to the market but anticipating it through probability shifts, and in a world overwhelmed by opinions, this approach offers something far more valuable—a signal backed by capital, where the future is not just predicted, but actively priced and continuously refined.
repost-content-media
  • Reward
  • Comment
  • Repost
  • Share
#StrategyAccumulates2xMiningRate
In the evolving crypto landscape, concepts like “Strategy Accumulates 2x Mining Rate” are becoming increasingly important in understanding how modern blockchain ecosystems incentivize participation. This model is not just a technical adjustment; it is a complete economic structure designed to encourage accumulation, strengthen network participation, and increase long-term user engagement.
At the same time, leading exchanges such as Gate.io play a key role in making these systems accessible to global users by providing advanced trading infrastructure, staking t
TOKEN-2.23%
HighAmbition
#StrategyAccumulates2xMiningRate
In the evolving crypto landscape, concepts like “Strategy Accumulates 2x Mining Rate” are becoming increasingly important in understanding how modern blockchain ecosystems incentivize participation. This model is not just a technical adjustment; it is a complete economic structure designed to encourage accumulation, strengthen network participation, and increase long-term user engagement.
At the same time, leading exchanges such as Gate.io play a key role in making these systems accessible to global users by providing advanced trading infrastructure, staking tools, and reward-based investment opportunities.
1. Understanding “Strategy Accumulates”
At its core, “Strategy Accumulates” refers to a systematic approach where users are encouraged to build their holdings gradually over time instead of engaging in short-term speculation.
This strategy includes:
Regular buying (DCA – Dollar Cost Averaging)
Long-term holding (HODLing)
Staking assets in yield programs
Reinvesting earned rewards back into the system
The goal is simple but powerful:
👉 Encourage users to stay engaged in the ecosystem for a longer period rather than exiting quickly after small gains.
This benefits both users and networks by creating stability and reducing market volatility caused by emotional trading behavior.
2. What “2x Mining Rate” Actually Means
Mining rate refers to how quickly users earn rewards from participating in a blockchain system, whether through staking, liquidity provision, or mining-based models.
When a system introduces a “2x mining rate”, it means:
👉 The reward generation speed is doubled compared to the previous baseline.
Simple Example:
Before: 10 tokens per day reward
After 2x upgrade: 20 tokens per day reward
This does not require doubling investment; instead, it increases reward efficiency.
3. Why This Model Is Being Used
The combination of accumulation strategy + increased mining rate is not random. It serves several economic and technical purposes:
(A) Liquidity Strengthening
More users lock their tokens in staking or holding systems, which reduces selling pressure and stabilizes price movement.
(B) Ecosystem Security
Higher participation improves decentralization and strengthens blockchain security mechanisms.
(C) User Retention
Higher rewards incentivize users to stay active within the ecosystem instead of moving funds elsewhere.
(D) Network Expansion
Attractive yield systems naturally bring in new users, increasing adoption and ecosystem visibility.
4. The Role of Gate.io in This Ecosystem
Exchanges are a critical bridge between users and blockchain reward systems. Among them, Gate.io stands out due to its strong focus on innovation, diversified earning products, and early support for emerging crypto trends.
Why Gate.io is relevant in this context:
5. Advanced Staking & Earn Products
Gate.io provides users with multiple earning mechanisms such as:
Flexible staking options
Locked yield programs
Dual investment products
Liquidity mining access
These tools align directly with the “accumulation strategy” concept.
6. Early Access to Innovative Projects
The platform is known for listing emerging tokens and DeFi projects early, allowing users to participate in new mining or reward structures before they reach mass adoption.
7. User-Friendly Ecosystem
Gate.io offers:
Simple interface for beginners
Advanced trading tools for professionals
Transparent reward systems
This makes complex systems like 2x mining rate more accessible to everyday users.
8. Global Liquidity Support
A strong exchange like Gate.io contributes to:
Higher trading volume
Better price discovery
Stronger market efficiency
This indirectly supports accumulation-based strategies by improving liquidity conditions.
9. Market Impact of 2x Mining Rate Systems
When a platform introduces enhanced reward systems, several market behaviors typically appear:
Short-Term Effects:
Increased buying activity
Higher staking participation
Temporary price stabilization or upward pressure
Mid-Term Effects:
Reduced circulating supply
Formation of accumulation zones
Increased investor interest
Long-Term Effects:
Stronger ecosystem engagement
More stable token economics (if managed properly)
Increased institutional attention
10. Risks That Must Be Considered
Despite attractive rewards, there are structural risks:
(A) Inflation Pressure
If rewards are too high, token supply can expand faster than demand.
(B) Unsustainable Yield Models
Some systems reduce rewards later after attracting liquidity initially.
(C) Market Dependency
If market price declines, high yields may not offset capital loss.
(D) Short-Term Behavior
Users may enter only for rewards and exit quickly, reducing long-term stability.
11. Investor Perspective
From an investor point of view, this system should not be treated as “guaranteed profit,” but rather as:
👉 A structured incentive mechanism to encourage long-term participation.
Smart investors typically evaluate:
Tokenomics sustainability
Reward emission schedules
Real utility of the ecosystem
Exchange support and liquidity depth
12. Psychological Effect on Market Participants
These systems also influence investor psychology:
“If I hold more, I earn more” mindset
Increased FOMO during reward expansions
Greater interest in passive income models
Balanced against fear of inflation or correction
This psychological cycle often drives both accumulation phases and volatility cycles.
13. Long-Term Outlook
If properly designed, systems like “Strategy Accumulates 2x Mining Rate” can:
Strengthen blockchain participation
Improve liquidity depth
Increase user retention
Support ecosystem growth
However, long-term success depends entirely on:
👉 Balanced reward emissions + real network utility + sustained demand
Final Summary
The concept of Strategy Accumulates 2x Mining Rate represents a modern crypto incentive model where users are rewarded more heavily for long-term participation and accumulation behavior.
In simple terms:
Accumulate more → earn more
Participate longer → get higher rewards
Ecosystem grows → but must remain balanced
And exchanges like Gate.io play an important role by providing the infrastructure, liquidity, and earning tools that make these systems accessible to global users.
Final takeaway:
This is not just a reward boost — it is a structured economic model designed to align user behavior with long-term ecosystem growth, while exchanges like Gate.io help bridge users into these opportunities efficiently.
repost-content-media
  • Reward
  • Comment
  • Repost
  • Share
#TapAndPayWithGateCard
The modern crypto economy is rapidly evolving from a purely speculative market into a fully functional financial ecosystem where spending, earning, staking, and trading are all interconnected. One of the clearest examples of this transformation is the concept of “Tap and Pay with Gate Card”, combined with advanced reward structures such as 2x mining rate strategies and accumulation-based incentive systems.
At the center of this evolving ecosystem stands Gate.io, a global crypto exchange that has expanded far beyond trading into payments, earning products, and real-world
HighAmbition
#TapAndPayWithGateCard
The modern crypto economy is rapidly evolving from a purely speculative market into a fully functional financial ecosystem where spending, earning, staking, and trading are all interconnected. One of the clearest examples of this transformation is the concept of “Tap and Pay with Gate Card”, combined with advanced reward structures such as 2x mining rate strategies and accumulation-based incentive systems.
At the center of this evolving ecosystem stands Gate.io, a global crypto exchange that has expanded far beyond trading into payments, earning products, and real-world crypto utility. The integration of crypto cards, staking rewards, and incentive-driven participation models represents a major shift in how users interact with digital assets.
1. What “Tap and Pay with Gate Card” Actually Means
The phrase “Tap and Pay with Gate Card” refers to a contactless crypto payment system where users can spend their digital assets in real-world transactions using a crypto-linked card.
In simple but complete terms, it means:
👉 You can pay directly using your crypto balance by tapping a card at a payment terminal, without manually converting crypto into fiat currency beforehand.
This is made possible through the infrastructure provided by platforms like Gate.io, which bridges the gap between blockchain assets and traditional financial payment systems.
How it works in real life:
You hold crypto assets in your exchange wallet
You link them to a crypto card system
You go to a shop or restaurant
You tap the card on a payment machine
The crypto is instantly converted and payment is completed
This removes friction and makes crypto behave like real money in everyday life.
2. Why Tap and Pay Systems Are Important in Crypto Evolution
The introduction of crypto cards and tap-to-pay systems represents a major milestone because it solves one of the biggest problems in crypto adoption: real-world usability.
Previously, crypto was mostly limited to:
Trading on exchanges
Long-term holding
Speculative investment
But now, with systems like Gate Card:
👉 Crypto becomes a daily spending tool instead of just a digital asset.
This shift is extremely important because it transforms crypto from an investment-only class into a functional currency ecosystem.
3. Strategy Accumulation & 2x Mining Rate Model
Alongside payment innovation, the crypto ecosystem also includes advanced earning systems like Strategy Accumulates 2x Mining Rate models.
This concept means:
Users are rewarded for holding and accumulating assets
The reward generation rate is doubled (2x mining output)
Passive income increases without increasing investment size
In practical terms:
If a user previously earned a small yield from staking or mining, under a 2x system, that yield becomes significantly higher while the same capital remains invested.
This creates a strong behavioral incentive:
👉 Hold more → Earn more → Stay longer in the ecosystem
4. How These Two Systems Work Together
When we combine Tap and Pay systems with 2x mining rate accumulation strategies, the result is a fully integrated financial loop:
(A) Earn Phase
Users earn rewards through staking, mining, or yield programs.
(B) Accumulate Phase
Users hold and grow their crypto holdings instead of selling.
(C) Spend Phase
Users spend crypto directly using Gate Card via tap and pay.
This creates a closed ecosystem where:
Crypto is earned
Crypto is held
Crypto is spent
Everything happens inside one financial cycle.
5. Role of Gate.io in This Ecosystem Transformation
Gate.io plays a central role in this evolution by offering a multi-layered crypto ecosystem that includes:
1. Advanced Trading Infrastructure
Gate.io provides deep liquidity, fast execution, and access to a wide range of crypto assets, making it a strong foundation for global traders.
2. Staking and Yield Products
Users can participate in:
Flexible staking
Locked earning programs
Liquidity mining
Dual investment strategies
These directly support accumulation-based strategies.
3. Real-World Crypto Payments (Gate Card Concept)
The integration of crypto payment solutions allows users to:
Spend crypto instantly
Avoid manual conversion steps
Use crypto like fiat currency in daily life
4. Early Access to Emerging Ecosystems
Gate.io is known for listing innovative tokens and providing early access to new DeFi and blockchain projects, allowing users to participate in reward systems before they become mainstream.
6. Impact on the Crypto Market
The combination of tap-and-pay systems and enhanced mining rewards creates a significant impact on the crypto market structure.
(A) Increased Crypto Utility
Crypto is no longer just a trading asset. It becomes:
A savings tool
An income generator
A payment method
(B) Stronger Holding Behavior
Because of accumulation rewards:
Users are less likely to sell
Circulating supply decreases
Market stability increases
(C) Higher Adoption Rate
As crypto becomes easier to spend through systems like Gate Card:
Retail adoption increases
Merchant acceptance grows
Real-world usage expands
(D) Liquidity Redistribution
Funds move from short-term trading into:
Staking pools
Earn programs
Payment ecosystems
This reduces speculative volatility over time.
7. Risks and Structural Considerations
Even though these systems are highly innovative, they also come with important risks:
(A) Reward Sustainability
High reward systems like 2x mining rates must be carefully balanced to avoid inflation.
(B) Market Dependency
Crypto spending systems still depend on market liquidity and asset price stability.
(C) Behavioral Risk
Users may focus only on rewards and ignore long-term fundamentals.
(D) Regulatory Environment
Crypto payment systems must adapt to global financial regulations and compliance frameworks.
8. Psychological and Behavioral Market Effects
These systems also influence investor psychology significantly:
“If I hold more, I earn more” mindset strengthens accumulation behavior
Instant payment capability increases confidence in crypto usability
Passive income perception attracts new retail investors
Fear of missing reward cycles drives participation spikes
This creates a powerful emotional cycle that impacts both price action and adoption trends.
9. Long-Term Outlook of This Ecosystem
If developed sustainably, the integration of:
Tap and Pay crypto cards
2x mining rate reward systems
Accumulation-based incentives
Exchange-driven infrastructure
can transform crypto into a fully functional global financial layer.
This means:
👉 Crypto will no longer exist only as an investment market
👉 It will function as a parallel financial system used in daily life
Platforms like Gate.io are positioning themselves at the center of this transformation by combining trading, earning, and payment solutions into one ecosystem.
Final Conclusion
The concepts of “Tap and Pay with Gate Card” and “Strategy Accumulates 2x Mining Rate” represent two sides of the same evolution: one focuses on spending crypto in real life, while the other focuses on earning and accumulating crypto efficiently.
When combined, they create a complete financial loop where:
Users earn crypto through rewards
They accumulate and grow holdings through enhanced mining rates
They spend crypto directly in real-world transactions using tap-and-pay systems
In this structure, Gate.io acts as a powerful ecosystem bridge, connecting blockchain technology with practical financial utility.
Final insight:
This is not just a trend — it is a structural shift toward a future where crypto behaves like a complete financial system rather than just a speculative asset class.
repost-content-media
  • Reward
  • Comment
  • Repost
  • Share
#EthereumFoundationUnstakes$48.9METH
The recent movement of approximately $48.9 million worth of ETH unstaked by the Ethereum Foundation has become one of the most discussed events in the crypto market. This is not just a routine on-chain transaction; it represents a significant liquidity adjustment by one of the most influential entities in the Ethereum ecosystem. When combined with prior OTC activity, staking milestones, and broader market conditions, this event forms a complex narrative around treasury management, market psychology, and potential futur
HighAmbition
#EthereumFoundationUnstakes$48.9METH
The recent movement of approximately $48.9 million worth of ETH unstaked by the Ethereum Foundation has become one of the most discussed events in the crypto market. This is not just a routine on-chain transaction; it represents a significant liquidity adjustment by one of the most influential entities in the Ethereum ecosystem. When combined with prior OTC activity, staking milestones, and broader market conditions, this event forms a complex narrative around treasury management, market psychology, and potential future price behavior.
At the center of this discussion lies a key question: is this a bearish signal indicating selling pressure, or a strategic liquidity repositioning designed to support long-term ecosystem development?
To answer this properly, we must analyze the mechanics, intent, market structure, sentiment, and institutional behavior surrounding this event in a unified framework.
1. What Actually Happened: The Core Unstaking Event
In late April 2026, the Ethereum Foundation executed a large-scale unstaking operation involving approximately $40M–$48.9M worth of ETH, equivalent to nearly 17,000 ETH. These assets were initially staked through liquid staking infrastructure such as Lido Finance and were later converted into wstETH withdrawals routed through Lido’s unstaking contract system.
On-chain data confirmed repeated transfers of structured batches, including approximately 811.206 wstETH per transaction, each valued in the multimillion-dollar range. Importantly, these movements did not immediately route funds to centralized exchanges, but instead entered a withdrawal pipeline that introduces a time delay before full liquidity is realized.
This distinction is critical:
👉 Unstaking does NOT equal selling
👉 It only converts locked staking positions into liquid, accessible assets
Therefore, the Foundation has increased optionality rather than executed liquidation.
2. Context Behind the Move: Treasury Strategy, Not Exit Behavior
To understand this action correctly, it must be placed within the Ethereum Foundation’s broader financial behavior pattern.
Shortly before this event, the Foundation had already executed an over-the-counter ETH sale worth approximately $23.8M, reinforcing the idea that this is part of a structured liquidity management cycle rather than an isolated action.
The Ethereum Foundation operates fundamentally as:
A protocol development funding entity
A research and grant allocator
A long-term ecosystem support organization
Rather than a speculative trader, it behaves like a treasury manager responsible for sustaining ecosystem growth.
Key motivations behind unstaking:
3. Operational Funding Requirements
The Foundation regularly funds:
Protocol upgrades
Research initiatives
Developer grants
Infrastructure support
These require liquid capital, which staking temporarily restricts.
4. Portfolio Rebalancing
Large institutional entities do not maintain static exposure. They periodically:
Stake assets for yield
Unstake for liquidity
Rebalance risk exposure
This is standard treasury behavior.
5. Strategic Optionality
By moving assets into withdrawal queues rather than exchanges, the Foundation maintains flexibility:
Sell if needed
Re-stake if conditions improve
Deploy into DeFi or ecosystem funding
This preserves strategic control rather than forcing immediate market impact.
6. Mechanics: From Staked ETH to Liquid Capital
The unstaking process follows a structured technical pathway:
Staked ETH is converted into wstETH (wrapped staked ETH)
wstETH is submitted to Lido’s withdrawal contract
Assets enter a queue with time-delayed redemption
ETH becomes fully liquid after processing delay
This system ensures that liquidity is released gradually rather than instantly, reducing systemic shock.
Importantly, the Ethereum Foundation did NOT immediately transfer funds to exchange wallets, which would have been a stronger bearish signal. Instead, the assets remain within controlled withdrawal infrastructure.
7. Market Interpretation: Capability vs Actual Selling
The market reaction was immediate, but largely driven by perception rather than confirmed action.
Traders tend to interpret:
👉 “Unstaking = future selling pressure”
However, this is incomplete.
The correct interpretation is:
👉 Unstaking = potential liquidity availability
👉 Not guaranteed distribution into open market
This distinction is why sentiment diverged into two camps:
Bearish Interpretation:
Unstaked ETH may eventually reach exchanges
Could increase supply pressure
Signals possible distribution phase
Neutral/Optimistic Interpretation:
No immediate exchange deposits detected
Structured treasury management behavior
Likely operational liquidity adjustment
So far, no confirmed large-scale selling followed the unstaking event.
8. Market Structure: Ethereum in Compression Phase
At the time of this event, Ethereum is trading around the $2,250–$2,300 range, showing mild weakness but no structural breakdown.
The broader market structure is best described as:
👉 Compression Phase (not trend expansion)
Technical characteristics:
Tight Bollinger Bands → volatility squeeze
Oversold short-term indicators → weakening selling momentum
Downward short-term trend → but stable macro structure
Strong accumulation behavior in long-term wallets
Key levels:
Support: $2,150 – $2,300
Resistance: $2,450 – $2,480
Breakout zone: $2,500+
Compression phases are historically significant because they often precede large directional moves. The market is currently building energy rather than committing to a clear direction.
9. Institutional Behavior: Hidden Demand Layer
While the Ethereum Foundation activity introduces uncertainty, institutional flows continue to provide structural support.
Large-scale accumulation trends include:
Increased ETH holdings by institutional entities
Continued staking participation from whales
ETF and structured product inflows
For example, major players such as BitMine Immersion Technologies have significantly expanded ETH exposure, while institutional products continue to absorb supply.
This creates a dual structure:
Short-term uncertainty from unstaking events
Long-term demand absorption from institutions
This balance prevents uncontrolled downside pressure.
10. Sentiment Dynamics: Fear Without Capitulation
Market sentiment has shifted toward caution but not panic.
Key psychological drivers:
Fear of potential supply entering exchanges
Increased attention from traders and analysts
Heightened discussion volume across platforms
Lack of confirmed selling activity creates uncertainty
This creates a unique condition:
👉 Market is reactive, not decisive
Historically, such environments often precede volatility expansion once direction becomes clear.
11. Scenario Analysis: Possible Market Paths
Scenario 1: Bearish Outcome
Unstaked ETH flows into exchanges
Combined with weak technical momentum
Leads to breakdown below support
Temporary acceleration of downside volatility
Scenario 2: Neutral Outcome
Funds remain in wallets or DeFi
No significant exchange inflows
Market remains range-bound
Compression continues
Scenario 3: Bullish Outcome
Institutional demand absorbs supply
ETH breaks resistance above $2,500–$2,800
Compression resolves upward
Potential trend expansion phase begins
The actual outcome depends entirely on where unstaked ETH eventually moves.
12. Broader Structural Interpretation
This event reflects a deeper evolution in Ethereum’s financial ecosystem.
Staking is no longer a passive activity. Instead, it is now part of:
Active treasury management
Institutional portfolio allocation
Dynamic liquidity engineering
The Ethereum Foundation behaves similarly to a sovereign digital treasury: it stakes, rebalances, and unlocks liquidity based on ecosystem needs rather than market sentiment.
This level of transparency is unique to blockchain systems, where every financial action is publicly visible and immediately analyzed.
13. Final Conclusion: Liquidity Event, Not Structural Breakdown
The unstaking of $48.9M ETH by the Ethereum Foundation should not be interpreted as a bearish collapse signal. Instead, it represents a controlled liquidity restructuring within a maturing ecosystem.
Key conclusions:
No confirmed exchange selling has occurred
Funds are still within withdrawal infrastructure
Institutional demand remains strong
Market is in compression, not distribution
Volatility is building, not resolving
Final insight:
👉 The market is not reacting to actual selling.
👉 It is reacting to potential selling.
And in crypto markets, perception often moves faster than reality.
What happens next depends entirely on the next on-chain movement: whether liquidity remains internal, or enters open-market circulation.
Until then, Ethereum remains in a structurally strong but sentiment-sensitive phase where uncertainty is high—but direction is not yet decided.
repost-content-media
  • Reward
  • Comment
  • Repost
  • Share
#WCTCTradingKingPK
Trading in modern financial markets—whether crypto, forex, or commodities—requires more than just luck or random entries. It demands structured planning, disciplined execution, risk control, and psychological stability. The idea behind “Trading King” is not about guessing the market, but about understanding structure, liquidity, and probability-based decision making.
This article provides a complete breakdown of how to approach trading like a professional, including market analysis methods, entry strategies, risk management systems, and long-term success planning.
1. Unders
PUMP5.06%
HighAmbition
#WCTCTradingKingPK
Trading in modern financial markets—whether crypto, forex, or commodities—requires more than just luck or random entries. It demands structured planning, disciplined execution, risk control, and psychological stability. The idea behind “Trading King” is not about guessing the market, but about understanding structure, liquidity, and probability-based decision making.
This article provides a complete breakdown of how to approach trading like a professional, including market analysis methods, entry strategies, risk management systems, and long-term success planning.
1. Understanding Modern Market Structure
Before entering any trade, you must understand how markets actually move.
Markets are driven by:
Liquidity (buy/sell orders)
Institutional participation
Market sentiment
News and macroeconomic events
Technical structure
In crypto and forex, price does NOT move randomly. It moves in cycles:
Market Phases:
Accumulation (smart money buying)
Expansion (strong trend movement)
Distribution (profit-taking phase)
Correction / Re-accumulation
👉 Smart traders always follow “smart money”, not retail emotions.
2. Core Trading Strategy Framework
A professional trading system is built on 4 pillars:
A. Trend Analysis
Always identify trend before entering:
Uptrend → Higher highs & higher lows
Downtrend → Lower highs & lower lows
Sideways → Range-bound market
👉 Rule: Never trade against the main trend unless scalping with strict risk control.
B. Support & Resistance Zones
These are key price levels where market reacts strongly.
Support = buying interest zone
Resistance = selling pressure zone
📌 Strategy:
Buy near support (confirmation required)
Sell near resistance (rejection confirmation required)
C. Liquidity Concept (Smart Money Concept)
Market often moves to collect liquidity:
Stop-loss hunting zones
Equal highs/lows
Breakouts followed by fakeouts
👉 Professional traders don’t chase price—they wait for liquidity grabs.
D. Market Structure Shift
A strong signal appears when:
Downtrend breaks structure → bullish shift
Uptrend breaks structure → bearish shift
This is one of the strongest confirmation tools in trading.
3. Entry Strategy (Step-by-Step Plan)
A good entry is not random—it is a confirmation-based process.
Step 1: Identify Trend
Use higher timeframe (4H / Daily)
Step 2: Mark Key Levels
Support
Resistance
Liquidity zones
Step 3: Wait for Price Reaction
Do NOT enter early.
Look for:
Rejection candle
Break & retest
Liquidity sweep
Step 4: Entry Trigger
Enter only when confirmation appears:
Bullish engulfing (buy setup)
Bearish engulfing (sell setup)
Break of structure confirmation
4. Risk Management (Most Important Part)
Even the best strategy fails without risk control.
Golden Rules:
Risk only 1–2% per trade
Never over-leverage
Always use stop-loss
Avoid revenge trading
Risk-to-Reward Ratio:
Minimum: 👉 1:2 or 1:3
Example:
Risk: $100
Target: $200–$300
If you maintain this discipline, even 40–50% win rate can be profitable.
5. Trading Styles Explained
A. Scalping (Fast Trading)
Timeframe: 1–5 minutes
Small profits, many trades
High stress
Best for experienced traders only.
B. Day Trading
Open and close trades within a day
Uses 15m–1H charts
Balanced strategy
C. Swing Trading
Holds trades for days or weeks
Uses 4H–Daily charts
Best for beginners and professionals
👉 Recommended style: Swing trading (most stable)
6. Psychological Mastery
Trading success is 70% psychology.
Common mistakes:
Fear of missing out (FOMO)
Overtrading
Emotional revenge trading
Lack of patience
Winning mindset:
Treat trading like a business
Follow rules strictly
Accept losses as part of system
Focus on consistency, not quick profits
7. Advanced Strategy: Smart Money Approach
Professional traders follow institutional behavior:
Key Concepts:
Liquidity grabs before major moves
False breakouts
Accumulation before pump
Distribution before crash
How to use:
Identify consolidation zone
Wait for fake breakout
Enter after reversal confirmation
Ride institutional move
8. Market Timing Strategy
Best trading times:
London session (high volatility)
New York session (trend continuation)
Avoid:
Low liquidity hours
Random emotional trading times
9. Trading Plan Example
Daily Routine:
Analyze Daily & 4H charts
Mark zones
Wait for setup
Enter only confirmed trade
Set SL & TP immediately
Weekly Plan:
Max 3–5 high quality trades
Review mistakes
Track performance
10. Final Trading Blueprint (Professional System)
A complete trading system looks like this:
✔ Trend Identification
✔ Liquidity Mapping
✔ Support/Resistance Zones
✔ Confirmation Entry
✔ Risk Management
✔ Emotional Control
✔ Exit Strategy
👉 If even one element is missing, system becomes weak.
Final Conclusion
Becoming a “Trading King” is not about predicting the market—it is about understanding probability, managing risk, and executing with discipline.
The real edge in trading comes from:
Patience over emotion
Structure over guessing
Risk control over greed
Consistency over randomness
Markets reward discipline, not excitement.
repost-content-media
  • Reward
  • Comment
  • Repost
  • Share
#IranProposesHormuzStraitReopeningTerms
The latest diplomatic development surrounding Iran’s proposal on the Strait of Hormuz marks one of the most strategically significant turning points in the ongoing 2026 geopolitical conflict involving the United States, Israel, and Iran. This is not a simple ceasefire suggestion or a routine diplomatic exchange; rather, it is a high-stakes geopolitical restructuring attempt centered on global energy security, maritime control, and nuclear negotiation sequencing.
At its core, Iran is attempting to separate immediate economic survival from long-term strat
HighAmbition
#IranProposesHormuzStraitReopeningTerms
The latest diplomatic development surrounding Iran’s proposal on the Strait of Hormuz marks one of the most strategically significant turning points in the ongoing 2026 geopolitical conflict involving the United States, Israel, and Iran. This is not a simple ceasefire suggestion or a routine diplomatic exchange; rather, it is a high-stakes geopolitical restructuring attempt centered on global energy security, maritime control, and nuclear negotiation sequencing.
At its core, Iran is attempting to separate immediate economic survival from long-term strategic concessions. The proposal reflects a calculated attempt to reopen global energy flows through the Strait of Hormuz while delaying nuclear negotiations to a later phase, effectively reshaping the order of diplomatic priorities in its favor.
1. Strategic Importance of the Strait of Hormuz in Global Energy Architecture
The Strait of Hormuz is one of the most critical maritime chokepoints in the world, controlling approximately 20% of global oil shipments and a significant portion of LNG (liquefied natural gas) flows. Any disruption in this region immediately translates into global macroeconomic shock.
In the current crisis scenario, following military escalation and naval blockades, the strait has effectively functioned under restricted conditions. Insurance premiums for shipping have surged dramatically, commercial traffic has declined sharply, and energy supply chains have been forced into rerouting or partial suspension.
This has created a structural supply shock that directly feeds into global inflation, energy insecurity, and industrial cost escalation across Europe, Asia, and North America.
2. Core Structure of Iran’s Proposal and Diplomatic Positioning
Iran’s proposal, reportedly communicated through Pakistani mediation channels, is built on three major pillars:
First, Iran demands the immediate lifting of US naval blockade operations targeting Iranian ports and maritime assets, which would allow the resumption of oil exports and import flows into Iran’s domestic economy. This is positioned as a humanitarian and economic stabilization requirement.
Second, Iran proposes a full cessation of hostilities or long-term ceasefire agreement, effectively freezing active military escalation in exchange for maritime normalization.
Third, and most controversially, Iran insists that nuclear program negotiations be deferred to a later diplomatic phase, explicitly separating energy corridor stabilization from nuclear disarmament or verification frameworks.
This sequencing is highly significant because it attempts to secure economic relief first while postponing the most sensitive security concessions to a future negotiation environment that may be more favorable to Tehran.
3. Economic Pressure Inside Iran and Motivations Behind the Proposal
Iran’s internal economic conditions play a central role in understanding the timing of this diplomatic move. Following sustained sanctions pressure, maritime restrictions, and oil export disruption, Iran has faced severe constraints on foreign currency inflows, essential imports, and domestic liquidity stability.
Reports indicate shortages in medical supplies, industrial inputs, and consumer goods, alongside a weakening fiscal position due to constrained oil revenue flows. Under these conditions, reopening maritime routes becomes not just a diplomatic objective but an economic necessity.
Earlier discussions about alternative transit toll mechanisms, including crypto-based settlement concepts, have now been sidelined in favor of a more direct geopolitical trade-off: access in exchange for de-escalation rather than monetization of passage rights.
4. US and Israeli Strategic Response and Red Lines
The United States has maintained a firm position that maritime freedom in international waters cannot be conditioned on unilateral geopolitical terms. The US administration, under President Trump’s 2026 policy framework, has emphasized that the naval blockade remains a strategic lever until Iran provides broader security assurances.
Secretary of State Marco Rubio and other officials have publicly rejected any arrangement that separates maritime access from nuclear compliance frameworks, arguing that partial agreements risk enabling Iran to regain operational capacity and re-escalate tensions later.
Israel’s response is even more rigid, viewing the proposal as a tactical maneuver designed to buy time. Israeli strategic assessments emphasize that any delay in nuclear constraints or missile program dismantlement could allow Iran to rebuild strategic capabilities, particularly with external support networks from Russia and China.
5. Global Energy Market Reaction and Oil Price Structure
The most immediate and visible impact of this crisis has been on global energy pricing.
Brent crude oil has remained elevated in the range of approximately $100 to $112 per barrel, with periodic spikes above this band during escalation phases. WTI crude has generally traded around $90 to $105 per barrel, reflecting tight physical supply conditions and elevated geopolitical risk premiums.
The disruption in the Strait of Hormuz has effectively introduced a structural supply shock premium of $15–$25 per barrel, depending on the intensity of maritime restrictions and shipping insurance costs.
6. Bitcoin, Gold, and Risk Asset Behavior Under Geopolitical Stress
Financial markets have responded in a highly volatile manner, with cross-asset correlations becoming increasingly sensitive to geopolitical headlines.
Bitcoin is currently trading around $76,400, fluctuating sharply with liquidity conditions and global risk sentiment shifts.
Gold has surged and is currently priced near $4,595 per ounce, reflecting strong safe-haven demand driven by geopolitical uncertainty and inflation concerns.
Equity markets have shown sectoral divergence, with energy stocks outperforming due to elevated oil prices, while consumer-driven and growth-oriented sectors face pressure from inflation expectations and higher input costs.
7. Shipping Industry, Insurance Shock, and Global Trade Disruption
The maritime shipping industry has been one of the most directly impacted sectors in this crisis. Insurance premiums for vessels passing through high-risk zones have increased multiple times compared to pre-crisis levels, in some cases exceeding several percentage points of cargo value.
Freight rerouting has led to longer shipping times, increased fuel consumption, and logistical inefficiencies across global trade routes. Even partial reopening signals have only temporarily reduced pressure, as uncertainty regarding enforcement and security guarantees remains high.
8. Diplomatic Complexity and Role of Mediating Powers
Pakistan’s role as a mediator highlights the multi-layered diplomatic environment surrounding the crisis. Acting as an intermediary between Washington and Tehran places Islamabad in a delicate position balancing economic interest, regional stability, and geopolitical alignment.
China and Russia have supported de-escalation narratives but remain strategically aligned with preserving their economic and energy ties with Iran. European and Asian economies, heavily dependent on stable energy imports, have pushed for interim maritime stabilization agreements even without resolving nuclear disputes.
9. Strategic Interpretation: Weakness vs Tactical Leverage
Analysts remain divided on the interpretation of Iran’s proposal.
One perspective views it as a sign of economic strain and internal pressure, suggesting that Iran is seeking immediate relief due to mounting domestic constraints.
Another interpretation frames it as a calculated strategic delay, designed to separate military-economic pressure from nuclear negotiations, thereby preserving long-term bargaining power.
The truth likely lies in a hybrid structure, where both economic necessity and strategic positioning influence decision-making simultaneously.
10. Final Outlook: High Uncertainty, High Market Sensitivity Environment
The situation remains highly fluid, with no guaranteed resolution path currently visible. The Strait of Hormuz continues to function as a central pressure point for global energy security, while diplomatic negotiations remain fragmented across multiple channels.
Oil markets remain structurally elevated due to supply risk premiums, Bitcoin continues to reflect liquidity-driven volatility, and gold maintains a partial safe-haven role under uncertain macro conditions.
Ultimately, the outcome of this proposal will depend on whether geopolitical actors prioritize immediate economic stabilization or long-term strategic security restructuring.
Until a binding agreement is reached, global markets will continue operating in a high-volatility, geopolitically sensitive regime where headlines can shift multi-billion-dollar price movements within hours.
repost-content-media
  • Reward
  • Comment
  • Repost
  • Share
#TapAndPayWithGateCard
Tap Into the Future of Payments with Gate Card 🚀
In a world where speed, convenience, and innovation define financial success, Gate.io has once again raised the bar with its Gate Card — a next-generation crypto payment solution designed to transform how you spend digital assets in everyday life.
This isn’t just a card. It’s a complete financial upgrade.
What Makes Gate Card a Game-Changer?
Gate Card, powered by Visa, allows you to seamlessly spend your crypto anywhere across 130M+ merchants worldwide. Whether it’s coffee, travel, shopping, or large purchases — your cry
BTC0.35%
ETH1.7%
GT0.41%
HighAmbition
#TapAndPayWithGateCard
Tap Into the Future of Payments with Gate Card 🚀
In a world where speed, convenience, and innovation define financial success, Gate.io has once again raised the bar with its Gate Card — a next-generation crypto payment solution designed to transform how you spend digital assets in everyday life.
This isn’t just a card. It’s a complete financial upgrade.
What Makes Gate Card a Game-Changer?
Gate Card, powered by Visa, allows you to seamlessly spend your crypto anywhere across 130M+ merchants worldwide. Whether it’s coffee, travel, shopping, or large purchases — your crypto is instantly converted into fiat at the moment of payment.
No manual conversions. No delays. Just smooth, real-world usability.
Tap. Pay. Done. ⚡
With full integration into Google Pay, Gate Card unlocks a truly effortless experience:
Simply unlock your phone and tap
No app switching, no friction
Works anywhere contactless payments are accepted
Built-in tokenization ensures maximum security
This is where crypto meets real-life convenience — instantly.
Designed for Power Users & Everyday Spenders
Gate Card isn’t limited — it’s built for scale:
Massive transaction limits (up to $500K per transaction)
Multi-asset support: BTC, ETH, USDT, GT & more
Global usability with automatic currency conversion
Physical + virtual card flexibility
Whether you're making micro-payments or executing high-value transactions, Gate Card adapts to your lifestyle.
Earn While You Spend 💰
Why just spend when you can earn back?
Gate Card offers an industry-leading cashback system:
Up to 5% cashback based on VIP tier
Rewards in BTC, ETH, USDT, or GT
Bonus promotions and travel perks
A true “Spend-to-Earn” ecosystem
Every transaction becomes an opportunity.
Security You Can Trust 🔐
Gate Card combines multiple layers of protection:
Visa-grade payment security
Google Pay tokenization
Real-time transaction tracking
Optional PIN & biometric authentication
Your funds stay protected — always.
Real-World Utility, Finally
Gate Card bridges the long-standing gap between crypto and daily life:
Buy groceries
Pay for transport
Shop online or in-store
Book hotels & flights
Withdraw cash when needed
Crypto is no longer just an investment — it’s spendable power.
Why Gate.io Stands Out
Gate.io continues to prove itself as a leader in innovation:
Strong global presence
Advanced financial products
User-first ecosystem
Continuous upgrades and rewards
Gate Card is another bold step toward making crypto practical, accessible, and rewarding.
Final Take
Gate Card isn’t just competing — it’s leading the evolution of crypto payments.
With seamless #TapAndPayWithGateCard functionality, high rewards, global acceptance, and powerful infrastructure, it delivers exactly what modern users demand: speed, flexibility, and real-world utility.
repost-content-media
  • Reward
  • Comment
  • Repost
  • Share
#WHCADinnerShootingIncident
WHCADinnerShootingIncident
On the evening of April 26, 2026, a shooting incident occurred at the White House Correspondents' Association (WHCA) Dinner held at the Washington Hilton Hotel in Washington, D.C. The suspect, identified as Cole Thomas Allen, opened fire near the main security screening area while attempting to force entry into the event. Armed with multiple firearms and knives, Allen engaged in a firefight with Secret Service agents, resulting in one agent being shot in his bulletproof vest before the suspect was apprehended and taken into custody.
Pres
BlackRiderCryptoLord
#WHCADinnerShootingIncident
WHCADinnerShootingIncident
On the evening of April 26, 2026, a shooting incident occurred at the White House Correspondents' Association (WHCA) Dinner held at the Washington Hilton Hotel in Washington, D.C. The suspect, identified as Cole Thomas Allen, opened fire near the main security screening area while attempting to force entry into the event. Armed with multiple firearms and knives, Allen engaged in a firefight with Secret Service agents, resulting in one agent being shot in his bulletproof vest before the suspect was apprehended and taken into custody.
President Donald Trump, First Lady Melania Trump, Vice President JD Vance, and numerous Cabinet officials were present at the dinner but were safely evacuated by Secret Service agents without sustaining any injuries. The incident prompted an immediate evacuation of the ballroom, with approximately 7-8 shots fired according to witnesses. The event, which typically features comedy performances and a satirical presidential speech, was abruptly canceled following the security breach.
Allen allegedly traveled from Torrance, California to Washington, D.C. specifically for this attack. According to White House officials, he sent a manifesto to family members beforehand stating his intent to target members of the Trump administration. Acting Attorney General Todd Blanche described the incident as a likely targeted attack on administration officials. The injured Secret Service agent was treated and released from the hospital.
The suspect is currently in custody and facing federal charges including assault on a federal officer using a dangerous weapon. His first court appearance was scheduled for April 27, 2026. The incident has drawn condemnation from leaders across the political spectrum, with WHCA President Weijia Jiang calling it a harrowing moment and announcing that the board would assess security protocols and determine how to proceed with future events. Some online conspiracy theories claiming the incident was staged have emerged, though these lack credible evidence. Investigations into the full circumstances and potential security lapses remain ongoing.
#WHCADinnerShootingIncident
repost-content-media
  • Reward
  • Comment
  • Repost
  • Share
🔥 🔥 Real-Time Market Discussion | Gate Hot Chat Community 🔥
Markets move fast — and so should your decisions.
Will Bitcoin (BTC) push back above the $79,000 resistance level and start a new bullish wave? Or is the market preparing for another correction phase?
Is the trending meme/altcoin $BSB still showing momentum today — or is it too late to chase the move? Traders are split, and sentiment is shifting rapidly.
In today’s volatile conditions, timing and sentiment reading matter more than ever. That’s why active traders are gathering in real-time to analyze charts, track flows, and react i
BTC0.35%
BlackRiderCryptoLord
🔥 🔥 Real-Time Market Discussion | Gate Hot Chat Community 🔥
Markets move fast — and so should your decisions.
Will Bitcoin (BTC) push back above the $79,000 resistance level and start a new bullish wave? Or is the market preparing for another correction phase?
Is the trending meme/altcoin $BSB still showing momentum today — or is it too late to chase the move? Traders are split, and sentiment is shifting rapidly.
In today’s volatile conditions, timing and sentiment reading matter more than ever. That’s why active traders are gathering in real-time to analyze charts, track flows, and react instantly to market changes.
repost-content-media
  • Reward
  • Comment
  • Repost
  • Share
#IranProposesHormuzStraitReopeningTerms
**Iran Offers US New Proposal to Reopen Strait of Hormuz: Key Terms and Implications**
Iran has reportedly presented a new diplomatic proposal to the United States aimed at resolving the ongoing crisis surrounding the Strait of Hormuz, according to multiple sources including Axios and Bloomberg. The proposal, delivered through Pakistani intermediaries, represents a significant shift in Tehran's negotiating posture as the closure of this critical maritime chokepoint enters its third month.
**Core Elements of the Proposal**
The Iranian offer centers on a
BlackRiderCryptoLord
#IranProposesHormuzStraitReopeningTerms
**Iran Offers US New Proposal to Reopen Strait of Hormuz: Key Terms and Implications**
Iran has reportedly presented a new diplomatic proposal to the United States aimed at resolving the ongoing crisis surrounding the Strait of Hormuz, according to multiple sources including Axios and Bloomberg. The proposal, delivered through Pakistani intermediaries, represents a significant shift in Tehran's negotiating posture as the closure of this critical maritime chokepoint enters its third month.
**Core Elements of the Proposal**
The Iranian offer centers on a phased approach to resolving the standoff. Under the proposed framework, discussions would prioritize reopening the Strait of Hormuz and ending the military blockade, while postponing nuclear program negotiations to a later stage. This sequencing represents a notable departure from previous Iranian positions that had insisted on addressing nuclear issues concurrently with any broader settlement.
According to IRGC-linked Tasnim News Agency and regional officials familiar with the mediation efforts, Iran's conditions for reopening the strait include several key demands: establishment of what Tehran terms a "new regime" for managing the strait (potentially implying Iranian oversight or toll mechanisms), compensation for damages sustained during the conflict, security guarantees to prevent renewed military attacks by the US or Israel, and the complete lifting of the US naval blockade on Iranian ports.
Additional reported conditions include the release of frozen Iranian assets held abroad and implementation of a ceasefire in Lebanon to end Hezbollah's involvement in the broader regional conflict.
**Current Strategic Context**
The Strait of Hormuz, through which approximately one-fifth of globally traded oil and natural gas passes during peacetime, has been effectively closed since early April 2026. This closure has precipitated what the International Energy Agency has characterized as the largest energy supply shock on record, with Brent crude prices exceeding $107 per barrel and WTI trading above $96 per barrel.
The US maintains an active naval blockade on Iranian ports while conducting mine-clearing operations targeting IRGC-deployed naval mines. Iran has responded by seizing vessels attempting passage through the strait and insists on maintaining control over the waterway pending a comprehensive agreement.
**Diplomatic Maneuvering**
Iranian Foreign Minister Abbas Araghchi engaged in intensive consultations over the weekend, visiting Pakistan and Oman in an effort to break the current impasse. However, these discussions ended without substantive progress, prompting President Trump to cancel a planned diplomatic trip. Araghchi is now expected to travel to Moscow for meetings with Russian President Vladimir Putin, potentially seeking additional diplomatic backing for Tehran's position.
President Trump is scheduled to convene a Situation Room meeting on Monday with his top national security and foreign policy team to evaluate the Iranian proposal and determine next steps. The administration faces a complex calculation: accepting the proposal would remove significant leverage in future negotiations over Iran's enriched uranium stockpile and enrichment activities, which remain primary US objectives.
**Market and Geopolitical Implications**
Oil markets have reacted with volatility to the news of potential talks, with prices paring some gains on optimism about a potential breakthrough. However, analysts caution that even if negotiations proceed, full reopening of the strait could take months given the technical challenges of clearing naval mines and establishing verification mechanisms for compliance.
The proposal's emphasis on postponing nuclear talks raises concerns among observers who note that lifting the blockade without addressing enrichment capabilities could allow Iran to consolidate its nuclear position while securing relief from economic pressure. Conversely, proponents argue that stabilizing energy markets and reducing regional military tensions should take immediate priority.
**Outlook**
The coming days will prove critical as Washington evaluates Tehran's offer. The phased approach proposed by Iran offers a potential pathway to de-escalation, but significant gaps remain between the parties' core demands. The US insists on Iran abandoning nuclear enrichment, opening the strait without tolls, ending support for Hezbollah, and presenting what the administration describes as a "unified proposal"—claims that Iranian leadership is fractured have been denied by Tehran.
With a fragile ceasefire holding indefinitely and both sides accusing each other of violations, the situation remains highly volatile. Traders and policymakers alike will be monitoring developments closely as the White House deliberates its response to this latest Iranian overture.
#IranHormuz
repost-content-media
  • Reward
  • Comment
  • Repost
  • Share
#CrudeOilPriceRose
**The Iran Ceasefire Situation and Its Impact on Global Oil Markets**
The United States and Iran reached a provisional two-week ceasefire agreement in early April 2026, mediated by Pakistan. This truce was designed to allow both sides to negotiate a more permanent settlement, with talks scheduled to take place in Islamabad. However, as the ceasefire deadline approached, negotiations stalled, creating significant uncertainty in global oil markets.
The ceasefire agreement initially caused oil prices to plunge from around $120 per barrel to approximately $90, as global investo
BlackRiderCryptoLord
#CrudeOilPriceRose
**The Iran Ceasefire Situation and Its Impact on Global Oil Markets**
The United States and Iran reached a provisional two-week ceasefire agreement in early April 2026, mediated by Pakistan. This truce was designed to allow both sides to negotiate a more permanent settlement, with talks scheduled to take place in Islamabad. However, as the ceasefire deadline approached, negotiations stalled, creating significant uncertainty in global oil markets.
The ceasefire agreement initially caused oil prices to plunge from around $120 per barrel to approximately $90, as global investors breathed a sigh of relief. Brent crude and WTI both experienced sharp declines as traders priced in the possibility of normalized oil flows through the Strait of Hormuz. However, this optimism was short-lived as diplomatic talks failed to materialize as planned, and President Trump extended the ceasefire unilaterally while maintaining a naval blockade on Iranian oil exports.
The Strait of Hormuz remains a critical chokepoint for global oil trade, handling roughly one-fifth of the world's oil shipments. Since the conflict began, Gulf crude oil production has more than halved, and approximately 12 million barrels per day of production have been disrupted. According to Citi Research, global crude and product inventories could decline by roughly 900 million barrels even if the conflict ended immediately, with both Strait of Hormuz flows and oil production recovering to normal levels by the end of June. If disruptions persist for an additional month, total inventory losses could rise to around 1.3 billion barrels, and a two-month extension could push losses to about 1.7 billion barrels, reaching the lowest inventory levels on record based on approximately 25 years of data.
**Current Market Conditions and Price Movements**
Oil prices have been extremely volatile, with Brent crude trading between $90 and $120 per barrel over the past four weeks. The market has shown a divergence between WTI and Brent, with Brent trading at a significant premium due to Middle East supply fears. This inverse spread reflects how regional fundamentals in the United States, where domestic production remains relatively stable, differ from global risk premiums tied to Middle East supply disruptions.
Goldman Sachs reports that Gulf crude oil production has more than halved since the Iran war began. The International Energy Agency indicates that global oil demand is on track for its sharpest monthly decline in five years, while traders estimate the supply loss could double next month to 5 million barrels per day, or 5% of world supplies.
**Traders' Perspectives and Trading Strategies**
Professional traders and analysts are expressing significant concern about the market's current pricing of this supply shock. Russell Hardy, chief executive of Vitol, described the disruption as the largest in his nearly 40-year career, noting that even if the conflict ended immediately, at least one billion barrels of oil and refined products have already been effectively wiped from global supply. He emphasized that today's market is tighter than during the 1990 Gulf crisis, and most spare capacity sits behind the Strait of Hormuz, amplifying the shock.
Traders are warning that the loss of flows through Hormuz could ripple across global supply chains, from fertilizer shortages linked to reduced Middle East gas output to disruptions in metals processing due to constrained sulphuric acid supplies. This raises the risk of a broader economic slowdown if the strait remains closed.
Rystad Energy has noted that if oil prices push through to and sustain $100 per barrel, it could unlock as much as 2.1 million barrels per day of new supply from South America. South America is now positioned as the world's most consequential source of incremental supply, according to Radhika Bansal, senior vice president at Rystad Energy.
**Scenarios: Ceasefire Success vs. Continued Conflict**
If the ceasefire holds and diplomatic talks succeed, oil prices could stabilize within the $80 to $100 range. The recovery of Strait of Hormuz flows would gradually normalize global supply, though inventories would remain depleted for months. In this scenario, traders would likely reduce risk premiums, and prices would trend lower as supply returns to market. However, even with an immediate resolution, the lost supply cannot be quickly replaced, supporting higher prices in the short term.
If negotiations fail and hostilities resume, the consequences would be severe. Oil prices could spike to $130 per barrel or higher by the second quarter, according to Citi Research. The continued closure of the Strait of Hormuz would exacerbate supply shortages, potentially triggering demand destruction as prices become prohibitively expensive for many consumers. The AA has noted that based on the fuel industry's rule of thumb of a 10 to 14-day lag between wholesale cost movements and retail prices, drivers should expect prices at the pump to level off by next weekend and then fall, providing the ceasefire holds.
**Conclusion**
The Iran ceasefire situation remains highly fluid, with significant implications for global oil markets. Traders are navigating an environment of extreme uncertainty, where diplomatic developments can cause rapid price swings. The market is currently pricing in a substantial risk premium due to the potential for supply disruptions to persist or worsen. Until there is clear direction on US-Iran negotiations, volatility in energy markets is likely to continue, keeping investors and consumers on edge. The stakes extend far beyond crude prices, with potential ripple effects across global supply chains and broader economic conditions.
repost-content-media
  • Reward
  • Comment
  • Repost
  • Share
#USMilitaryMaduroBettingScandal
US Military Maduro Betting Scandal: When Classified Intel Meets Prediction Markets
The intersection of military operations and decentralized finance has produced one of t
he most bizarre financial scandals of 2026. US Army Master Sergeant Gannon Ken Van Dyke, a special forces operative involved in the capture of Venezuelan President Nicolas Maduro, now faces federal charges for allegedly turning classified operational intelligence into a $400,000+ windfall on Polymarket.
The Operation and the Bet
Operation Absolute Resolve, the covert US military mission to ext
BlackRiderCryptoLord
#USMilitaryMaduroBettingScandal
US Military Maduro Betting Scandal: When Classified Intel Meets Prediction Markets
The intersection of military operations and decentralized finance has produced one of t
he most bizarre financial scandals of 2026. US Army Master Sergeant Gannon Ken Van Dyke, a special forces operative involved in the capture of Venezuelan President Nicolas Maduro, now faces federal charges for allegedly turning classified operational intelligence into a $400,000+ windfall on Polymarket.
The Operation and the Bet
Operation Absolute Resolve, the covert US military mission to extract Maduro from Caracas, was planned with extreme secrecy. Van Dyke allegedly had access to sensitive operational details from December 8, 2025 through January 6, 2026, including precise timing and tactical elements of the raid.
Rather than maintaining operational security, federal prosecutors claim Van Dyke opened a Polymarket account on December 26, 2025, and proceeded to place approximately 13 bets totaling $33,034. These wagers focused on specific outcomes: whether US forces would be deployed in Venezuela and whether Maduro would be removed from office by January 31, 2026. When the overnight raid succeeded in early January 2026, Van Dyke's positions reportedly yielded over $400,000 in profits.
Legal Implications and Charges
The Department of Justice has charged Van Dyke with mishandling classified information and what amounts to insider trading on geopolitical events. The indictment, unsealed April 23, 2026, highlights the serious national security risks of such actions. Had foreign intelligence detected unusual betting patterns or linked them to US military personnel, the entire operation could have been compromised.
President Trump, when asked about the case, drew a parallel to the Pete Rose scandal, stating he does not like the concept of betting and comparing it to athletes wagering on their own games. The comparison underscores the fundamental conflict of interest when participants bet on outcomes they can directly influence.
Polymarket's Response and Platform Accountability
Polymarket has stated they identified suspicious trading activity, alerted the DOJ, and cooperated fully with the investigation. This raises critical questions about prediction market platforms' responsibility to monitor for insider trading, particularly when government classified information may be involved.
The case exposes a regulatory gray area. Traditional securities markets have robust insider trading laws, but prediction markets on geopolitical events operate in largely uncharted territory. When classified military intelligence becomes the basis for financial speculation, existing legal frameworks struggle to address the hybrid nature of the offense.
Broader Implications for Prediction Markets
This scandal arrives at a pivotal moment for prediction markets. Platforms like Polymarket have gained mainstream attention for offering bets on elections, geopolitical events, and military conflicts. The Van Dyke case demonstrates how these markets can incentivize dangerous behavior: government officials with access to classified information may be tempted to monetize their knowledge.
Critics argue prediction markets on military operations create perverse incentives that could compromise national security. Supporters counter that markets aggregate information efficiently and that attempting to ban such markets simply pushes them underground where oversight is impossible.
The case also highlights the tension between transparency and secrecy in democratic societies. If military operations can be predicted with enough accuracy to support betting markets, what does that say about intelligence leaks and operational security?
Market Integrity and the Future
For prediction market enthusiasts, this scandal represents a serious reputational blow. The integrity of these markets depends on participants betting based on publicly available information and analysis, not classified intelligence. If markets become dominated by insiders with privileged government information, they lose their predictive value and become tools for illicit enrichment.
Regulatory responses are likely forthcoming. Congress may consider legislation specifically addressing betting on classified military operations, while platforms may implement enhanced KYC procedures and monitoring for government employees with security clearances.
The Van Dyke case serves as a stark reminder that in an era of decentralized finance and prediction markets, the traditional boundaries between military service and personal financial gain have become dangerously blurred. As these platforms expand into geopolitical betting, the challenge of maintaining both market integrity and national security will only intensify.
For traders and observers alike, the scandal underscores a fundamental principle: no matter how sophisticated the platform or attractive the returns, trading on classified information remains illegal, unethical, and potentially catastrophic for national security operations.
#Polymarket #MaduroScandal #PredictionMarkets
repost-content-media
  • Reward
  • Comment
  • Repost
  • Share
#TopCopyTradingScout
#TopCopyTradingScout**
Copy trading has evolved from a passive convenience into a strategic edge for traders seeking consistent returns without dedicating hours to chart analysis. The concept is straightforward yet powerful: identify proven performers, allocate capital proportionally, and let their expertise work for you.
**The Core Value Proposition**
What separates successful copy traders from those who struggle is selection discipline. Raw ROI percentages can be misleading. A trader showing 500% returns over 30 days might have achieved this through reckless leverage an
BlackRiderCryptoLord
#TopCopyTradingScout
#TopCopyTradingScout**
Copy trading has evolved from a passive convenience into a strategic edge for traders seeking consistent returns without dedicating hours to chart analysis. The concept is straightforward yet powerful: identify proven performers, allocate capital proportionally, and let their expertise work for you.
**The Core Value Proposition**
What separates successful copy traders from those who struggle is selection discipline. Raw ROI percentages can be misleading. A trader showing 500% returns over 30 days might have achieved this through reckless leverage and a single lucky trade. The metrics that matter are win rate consistency, maximum drawdown tolerance, and Sharpe ratio stability over extended periods.
Gate's copy trading infrastructure provides transparent access to these critical data points. Lead traders are categorized through multiple lenses: Star Traders undergo comprehensive metric reviews, Most Profitable rankings highlight those generating the highest absolute returns for followers, and Prudent Trader classifications identify balanced risk-reward profiles.
**Performance Landscape Snapshot**
Current platform data reveals substantial divergence in trader performance. Top-tier lead traders are demonstrating 30-day ROI figures exceeding 70%, with some approaching triple-digit returns. However, the more telling metric is copier profitability. The highest-performing lead traders by this measure have generated over 50,000 USDT in collective profits for their followers within 30 days, indicating sustainable strategy execution rather than isolated wins.
AUM (Assets Under Management) rankings provide additional insight. Traders managing 200,000+ USDT in follower capital demonstrate institutional confidence in their methodology. These figures suggest followers are not merely testing with minimal allocations but committing meaningful capital based on track records.
**Risk Management Imperatives**
Copy trading is not a set-and-forget solution. Even the most skilled traders experience losing streaks. Platform mechanics allow customization of copy parameters including margin limits, leverage caps, and stop-loss thresholds. These safeguards are essential. A lead trader operating at 20x leverage might suit aggressive risk profiles but could devastate conservative portfolios without proper constraints.
Minimum entry thresholds vary by trader, typically starting at 10 USDT but often requiring 50-300 USDT depending on the lead trader's preference. This flexibility accommodates various capital levels while ensuring meaningful position sizing.
**Selection Framework**
When evaluating potential lead traders to follow, consider this hierarchy:
1. Consistency over volatility. A trader delivering steady 5-15% monthly returns with controlled drawdowns outperforms one with sporadic 100% spikes followed by 80% corrections.
2. Trading style alignment. Tags indicate methodology: scalping, swing trading, trend following. Match these to your market view and time horizon.
3. Communication transparency. Lead traders providing rationale for positions enable better copier decision-making.
4. Risk-adjusted returns. High absolute profits mean little if achieved through excessive risk-taking.
**Operational Mechanics**
Once a lead trader is selected, the copy process is streamlined. Configure your allocation, set protective parameters, and positions automatically mirror the lead trader's actions in real-time. You retain control to manually close positions or pause copying if market conditions shift or strategy alignment diverges.
The platform supports futures copy trading specifically, offering exposure to perpetual contracts across major cryptocurrencies. This provides leverage amplification opportunities while maintaining the accessibility of spot-style position management.
**Strategic Considerations**
Diversification applies to copy trading as well. Following multiple lead traders with uncorrelated strategies can smooth portfolio volatility. However, avoid over-diversification that dilutes returns and increases complexity.
Monitor performance regularly but avoid reactionary switching. Every strategy experiences underperformance periods. Evaluate lead traders over 30-90 day windows rather than weekly fluctuations.
Consider the fee structure. Lead traders typically retain a percentage of copier profits as compensation. This aligns incentives but impacts net returns. Factor this into performance expectations.
**Market Context**
Current market conditions favor active management. Volatility creates opportunity but demands discipline. Lead traders with proven risk management frameworks are particularly valuable in choppy environments where emotional decision-making often leads to losses.
The copy trading ecosystem continues maturing. Platform tools for trader evaluation, risk customization, and performance tracking have improved substantially. This infrastructure supports informed decision-making but does not eliminate the need for personal due diligence.
**Final Perspective**
Copy trading represents a middle path between passive holding and active self-directed trading. It offers exposure to skilled execution without requiring equivalent expertise or time commitment. However, it is not risk-free. Capital preservation remains the primary responsibility of the copier, not the lead trader.
Approach copy trading as a portfolio component rather than a complete solution. Allocate capital you can afford to expose to leveraged futures risk. Maintain realistic expectations. Even the best traders experience drawdowns. The goal is consistent, sustainable growth over time, not overnight wealth creation.
The traders generating exceptional returns for their followers combine technical skill with psychological discipline. They manage risk first, let profits run second, and maintain emotional equilibrium through market turbulence. These are the profiles worth scouting.#
#CopyTrading #CryptoTrading #GateFutures #PassiveIncome
repost-content-media
  • Reward
  • Comment
  • Repost
  • Share
#AaveLaunchesrsETHRecoveryPlan
🚨 Aave Launches rsETH Recovery Plan — “DeFi United” Becomes a Defining Moment
The launch of Aave’s rsETH Recovery Plan under the “DeFi United” initiative is more than just a response to a hack — it’s a stress test of DeFi’s ability to self-heal under pressure.
Following the $163M KelpDAO LayerZero bridge exploit on April 18, 2026, the ecosystem faced a critical question:
👉 Can decentralized finance actually protect users when things break?
This recovery plan is the answer — and it may redefine how DeFi handles crises going forward.
🔍 What Actually Happened?
A
AAVE-0.61%
ZRO3.46%
BlackRiderCryptoLord
#AaveLaunchesrsETHRecoveryPlan
🚨 Aave Launches rsETH Recovery Plan — “DeFi United” Becomes a Defining Moment
The launch of Aave’s rsETH Recovery Plan under the “DeFi United” initiative is more than just a response to a hack — it’s a stress test of DeFi’s ability to self-heal under pressure.
Following the $163M KelpDAO LayerZero bridge exploit on April 18, 2026, the ecosystem faced a critical question:
👉 Can decentralized finance actually protect users when things break?
This recovery plan is the answer — and it may redefine how DeFi handles crises going forward.
🔍 What Actually Happened?
A vulnerability in the LayerZero bridge integration used by KelpDAO was exploited
Result: ~$163M shortfall impacting rsETH backing
Immediate effect:
Depegging pressure on rsETH
Liquidity instability across lending markets
Rising systemic risk, especially on Aave
This wasn’t just a protocol issue — it became a multi-protocol contagion threat
🛠️ The “DeFi United” Recovery Strategy
Instead of isolated damage control, Aave coordinated a cross-ecosystem recovery effort:
Key Components:
1. Treasury-backed Compensation
Aave DAO and partners stepping in to partially back losses
Signals strong commitment to user protection
2. Liquidity Stabilization
Incentives introduced to restore rsETH liquidity depth
Prevents cascading liquidations
3. Cross-Protocol Coordination
Collaboration between:
Lending protocols
Liquid staking ecosystems
Bridge infrastructure providers
4. Risk Parameter Adjustments
Temporary tightening of collateral factors
Defensive positioning against volatility
📊 Why This Matters (Big Picture)
1. DeFi’s “Too Big to Fail” Moment?
This is one of the first times we’ve seen:
Multiple protocols coordinate like a central bank-style response
Systemic risk managed collectively
👉 This sets a precedent: DeFi is no longer purely fragmented — it can act as a unified financial system
2. Reputation Layer > Code Layer
Even in a “trustless” ecosystem:
Users stayed because Aave acted fast
Trust shifted from code only → code + governance + reputation
👉 The real moat in DeFi is now credibility during crisis
3. Restaking & LSD Risks Exposed
rsETH is part of the restaking narrative, which is still evolving.
This event highlights:
Hidden risks in composability
Over-reliance on bridges and external layers
Fragility of synthetic staking derivatives
👉 Expect stricter scrutiny on:
Restaking protocols
Bridge security models
Collateral design
⚠️ Key Risks Still in Play
Even with recovery efforts:
❗ Full backing restoration may take time
❗ Market confidence is still fragile
❗ Another exploit could trigger deeper contagion
❗ Governance decisions could face criticism
This is not “resolved” — it’s actively being managed
🔥 Market Impact & Sentiment
Short-term:
Volatility in rsETH and related assets
Defensive positioning by whales
Increased borrowing caution
Mid-term:
Stronger protocols gain dominance
Weak designs get flushed out
Long-term: 👉 This could become a turning point for institutional trust in DeFi
💡 The Bigger Narrative
“DeFi United” isn’t just a recovery plan — it’s a proof of concept:
Coordination without central authority
Crisis response without government bailout
Incentive alignment across independent protocols
👉 If successful, this becomes: DeFi’s version of a financial crisis response framework
🧠 Final Take
This moment separates experimental DeFi from maturing financial infrastructure.
Aave didn’t just react — it led a systemic response
Now the real question is:
👉 Will DeFi continue evolving into a coordinated financial network… or revert back to isolated risk silos?
repost-content-media
  • Reward
  • Comment
  • Repost
  • Share
#CryptoMarketsDipSlightly
From 79K to 76K
Market Overview
The cryptocurrency market witnessed a controlled but sharp pullback on April 27, 2026, as Bitcoin declined from the 79,000–80,000 range to test a key support zone between 76,000 and 76,600 dollars. The move marked an approximate 2.8–3 percent intraday correction, with price briefly touching 76,456 before stabilizing.
Ethereum mirrored this weakness, dropping around 4.4 percent from local highs near 2,394 to trade around 2,280–2,300. Altcoins experienced even deeper corrections, reflecting broader risk-off sentiment across the digital
BTC0.35%
ETH1.7%
HighAmbition
#CryptoMarketsDipSlightly
From 79K to 76K
Market Overview
The cryptocurrency market witnessed a controlled but sharp pullback on April 27, 2026, as Bitcoin declined from the 79,000–80,000 range to test a key support zone between 76,000 and 76,600 dollars. The move marked an approximate 2.8–3 percent intraday correction, with price briefly touching 76,456 before stabilizing.
Ethereum mirrored this weakness, dropping around 4.4 percent from local highs near 2,394 to trade around 2,280–2,300. Altcoins experienced even deeper corrections, reflecting broader risk-off sentiment across the digital asset space.
Total crypto market capitalization declined by nearly 50 billion dollars, while volatility spiked due to thin liquidity conditions.
Primary Catalyst: Geopolitical Shock
The key driver behind this dip was the breakdown in negotiations between the United States and Iran.
Iranian delegates abruptly exited talks in Pakistan
Donald Trump canceled engagement plans
Tensions escalated rapidly, triggering global uncertainty
This led to a classic risk-off environment, where investors moved capital away from volatile assets like crypto into safer alternatives.
A major concern was potential disruption in the Strait of Hormuz—a critical oil supply route.
Oil Market Reaction & Macro Pressure
Oil markets reacted aggressively:
Brent crude surged above 107–108 dollars
Energy volatility increased inflation concerns
Macro uncertainty pressured risk assets globally
Higher oil prices often tighten liquidity expectations, indirectly impacting crypto markets by reducing speculative appetite.
Market Structure & Liquidations
Several technical and structural factors amplified the drop:
1. Weekend Liquidity Trap
Low trading volume exaggerated price swings
Fewer institutional participants increased volatility
2. “Sunday Pump → Monday Dump” Pattern
Weekend bullish sentiment reversed quickly
Profit-taking intensified at resistance zones
3. Liquidation Cascade
Approximately 140–150 million dollars in long positions wiped out
Forced selling accelerated downward momentum
Institutional Demand Still Strong
Despite short-term weakness, big money continues accumulating:
MicroStrategy (Strategy) bought 3,273 BTC (~255M dollars)
Total holdings now exceed 818,000 BTC
Major ETH accumulation by public companies continues
ETF flows remain bullish:
Over 1.2 billion dollars in weekly inflows
BlackRock, Fidelity Investments, and ARK Invest continue strong participation
Low exchange balances indicate no panic selling, reinforcing long-term bullish structure.
Technical Analysis: Key Levels
Bitcoin
Support: 76,000 (critical demand zone)
Below Support: 75,000 → 72,500 possible
Resistance: 78,500 → 80,000
Ethereum
Support: 2,250–2,280
Resistance: 2,350 → 2,400
The 76K zone is a high-volume node, meaning strong historical buying interest exists here.
Market Sentiment
Fear & Greed Index: 33 (Fear Zone)
Not extreme panic → suggests controlled correction, not market breakdown
Smart money is accumulating while retail shows hesitation
Forward Outlook
Key Drivers to Watch
US–Iran developments (primary trigger)
Oil price stability above/below 107
Federal Reserve signals on liquidity
ETF inflows continuation
Trading Strategy: What’s Next?
Scenario 1: Bullish Continuation (Preferred Case)
If BTC holds above 76K:
Entry Zone: 76K–76.5K
Target 1: 78.5K
Target 2: 80K+ breakout
Stop Loss: Below 75K
Strategy: Buy the dip, scale in gradually
Confirmation: Volume increase + reclaim of 78K
Scenario 2: Breakdown & Deeper Correction
If BTC loses 76K decisively:
Next Support: 75K → 72.5K
Possible panic extension to 70K
Strategy:
Avoid aggressive longs
Look for short opportunities on retests
Re-enter at lower support zones
Scenario 3: Sideways Consolidation
Most likely short-term outcome:
Range: 75K – 78.5K
Choppy price action
Strategy:
Range trading (buy support, sell resistance)
Avoid over-leverage
Focus on high-probability setups
Altcoin Strategy
Expect higher volatility than BTC
Avoid chasing pumps
Focus on strong narratives (AI, ETH ecosystem)
Rotate into strength, cut weak positions early
Risk Management Plan
Use low leverage (2x–5x max)
Always define stop loss
Avoid emotional trading during news-driven volatility
Keep capital ready for deeper dips
Conclusion
This dip from 79K to 76K is primarily a macro-driven correction, not a structural breakdown.
Geopolitical tension triggered the sell-off
Liquidations accelerated the move
But institutional demand remains intact
As long as 76K holds, the market structure remains bullish with short-term caution.
The next major move will depend on whether geopolitical tensions ease or escalate. Until then, traders should stay flexible, disciplined, and focused on key levels rather than emotions.
repost-content-media
  • Reward
  • Comment
  • Repost
  • Share
#DailyPolymarketHotspot :
Understanding the Daily Polymarket Hotspot: A Comprehensive Guide to Prediction Markets
In the modern digital economy, where information moves faster than ever, platforms like Polymarket are redefining how people interpret news, risk, and future outcomes. Polymarket is not just another crypto platform; it is a decentralized prediction market where users trade on the probability of real-world events using cryptocurrency. Unlike traditional trading, where assets represent value, here the assets represent beliefs about the future.
The concept may sound simple, but its im
BTC0.35%
ETH1.7%
HighAmbition
#DailyPolymarketHotspot :
Understanding the Daily Polymarket Hotspot: A Comprehensive Guide to Prediction Markets
In the modern digital economy, where information moves faster than ever, platforms like Polymarket are redefining how people interpret news, risk, and future outcomes. Polymarket is not just another crypto platform; it is a decentralized prediction market where users trade on the probability of real-world events using cryptocurrency. Unlike traditional trading, where assets represent value, here the assets represent beliefs about the future.
The concept may sound simple, but its implications are profound. When thousands of participants place money on an outcome, the resulting price becomes a real-time reflection of collective expectation. This is why many analysts consider prediction markets to be more accurate than polls or expert opinions, because participants are financially incentivized to be correct rather than just expressive.
What is the Daily Polymarket Hotspot?
The Daily Hotspot on Polymarket is essentially a curated list of the most active, high-volume, and trending markets at any given time. It shows where attention, liquidity, and conviction are concentrated. This includes markets from crypto, geopolitics, macroeconomics, sports, and technology.
However, it is important to understand that the hotspot is not random. It is driven by real-world events and narratives. When a major development occurs, traders immediately move capital into related markets, causing them to trend. Therefore, the hotspot becomes a mirror of global focus.
For example, during periods of geopolitical tension between the United States and Iran, markets related to war probability, oil disruption, or military action suddenly dominate the hotspot. Similarly, during crypto volatility, price prediction markets take over.
How Polymarket Actually Works
Polymarket operates using a very straightforward mechanism. Each market is framed as a question with binary outcomes such as “Yes” or “No.” Traders buy shares in either outcome, and the price of those shares ranges between 0 and 1 dollar, representing probability.
For instance, if a market is trading at 0.70 dollars for “Yes,” it means the market believes there is a 70 percent chance that the event will happen. If the event occurs, “Yes” shares pay out 1 dollar; if it does not, they become worthless.
All transactions are conducted using USDC stablecoin, and the platform runs on the Polygon network, which ensures low transaction fees and fast execution. Markets are resolved using verified data sources, making the process transparent and automated.
Exact Crypto Market Example (Realistic Scenario)
To understand this better, let us consider a realistic crypto-based hotspot example involving Bitcoin.
Imagine the market question is:
“Will Bitcoin close above 80,000 dollars on April 30?”
Now suppose:
“Yes” is trading at 0.42
“No” is trading at 0.58
This means the market currently believes there is a 42 percent probability that Bitcoin will close above 80K.
Now let us connect this to actual market behavior. If Bitcoin is currently trading around 76K and suddenly breaks above 78K with strong momentum, traders may start buying “Yes” shares aggressively. This could push the probability from 42 percent to 55 percent within minutes.
On the other hand, if macro news hits—such as rising oil prices or geopolitical tension—the market may turn bearish. Traders would then sell “Yes” and buy “No,” pushing probability lower.
This is where Polymarket becomes extremely powerful. It does not just reflect price; it reflects expectation of future price, which is often more valuable.
Why the Hotspot Matters in Crypto Trading
The Daily Hotspot becomes especially important for crypto traders because it acts as a sentiment indicator.
For example:
If most hotspot markets are bullish on Bitcoin, it indicates optimism
If probabilities are declining across multiple price targets, it signals caution
If volumes spike suddenly, it often means smart money is reacting to new information
In many cases, Polymarket probabilities move before the actual market price, giving traders an informational edge.
Debate: Is Polymarket Really Reliable?
There is an ongoing debate about whether prediction markets like Polymarket are truly accurate.
Argument in Favor
Supporters argue that markets are efficient because they combine information from thousands of participants. Since money is involved, people tend to research before placing trades, making the outcome more reliable than social media opinions or surveys.
Argument Against
Critics argue that markets can be manipulated, especially in low-liquidity conditions. Large traders can temporarily influence probabilities, and not all participants are equally informed. Additionally, emotional trading and herd behavior can distort accuracy.
The truth likely lies in between. Polymarket is not perfect, but it is one of the fastest and most dynamic indicators of sentiment available today.
Institutional and Macro Influence
Another important factor is how macro events influence hotspot activity. For example:
Rising oil prices can push bearish crypto probabilities
Federal Reserve decisions can shift macro markets instantly
ETF inflows can increase bullish sentiment
Large institutions and funds are also indirectly influencing these markets, as their actions in spot markets affect trader expectations.
Risk and Reality
It is important to understand that Polymarket is not a guaranteed profit system. In fact, data shows that only a small percentage of users are consistently profitable.
This is because:
Markets are highly competitive
Information moves quickly
Emotional decisions lead to losses
Successful traders usually combine:
News analysis
Market structure understanding
Risk management
Conclusion
The Daily Polymarket Hotspot is more than just a list of trending markets. It is a real-time reflection of global sentiment, financial conviction, and collective intelligence.
In the context of crypto, especially assets like Ethereum and Bitcoin, it provides a unique layer of insight that goes beyond charts and indicators. It shows what traders believe will happen next, not just what has already happened.
As prediction markets continue to evolve, they may become one of the most important tools for understanding financial markets. However, like any tool, they must be used with caution, critical thinking, and proper risk management.
repost-content-media
  • Reward
  • Comment
  • Repost
  • Share
#EthereumMarketAnalysis
Comprehensive Ethereum (ETH) Market Analysis
Current Market Status
Ethereum is currently trading around $2,332, showing modest positive movement with a 0.53% gain over the past 24 hours. The price has been consolidating within a narrow range between $2,301 and $2,337, reflecting a period of indecision as market participants await clearer directional catalysts. Trading volume remains healthy at approximately $113 million in 24-hour quote volume, indicating sustained interest despite the sideways price action.
US-Iran Peace Talks and Geopolitical Impact
The stalled US-Ir
ETH1.7%
BTC0.35%
AAVE-0.61%
ARB2.55%
HighAmbition
#EthereumMarketAnalysis
Comprehensive Ethereum (ETH) Market Analysis
Current Market Status
Ethereum is currently trading around $2,332, showing modest positive movement with a 0.53% gain over the past 24 hours. The price has been consolidating within a narrow range between $2,301 and $2,337, reflecting a period of indecision as market participants await clearer directional catalysts. Trading volume remains healthy at approximately $113 million in 24-hour quote volume, indicating sustained interest despite the sideways price action.
US-Iran Peace Talks and Geopolitical Impact
The stalled US-Iran peace negotiations represent a significant overhang on risk assets including Ethereum. Recent reports indicate that talks in Islamabad ended without breakthrough, with Iran blaming US naval blockades for the impasse. This geopolitical uncertainty has created a risk-off environment where institutional capital tends to retreat from high-beta assets like cryptocurrencies.
The connection between these talks and ETH valuation operates through multiple channels. First, successful negotiations would likely reduce oil prices and inflationary pressures, potentially allowing central banks to maintain or lower interest rates. Lower rates generally benefit crypto markets by reducing the opportunity cost of holding non-yielding assets and improving liquidity conditions. Conversely, failed talks or escalating tensions could trigger safe-haven flows into traditional assets while pressuring risk-on positions.
Recent market behavior suggests crypto may be developing resilience to geopolitical shocks. During the latest Iran-related flare-up, Bitcoin and Ethereum showed more muted reactions compared to traditional markets like oil and equities. This divergence could indicate that crypto holders who were inclined to sell on geopolitical headlines have already exited, or that spot ETF inflows are providing a more stable demand floor than previous cycles dominated by futures-driven volatility.
Technical Analysis and Key Levels
From a technical perspective, Ethereum faces immediate resistance at $2,340-$2,375, which aligns with the 21-period simple moving average and the upper band of a descending trend channel that formed in mid-April. Support levels are clustered around $2,300, $2,230 (near the 200-period EMA), and $2,180 at the lower band of the descending channel.
The price structure shows ETH trading below its 21 SMA while remaining within a descending trend channel, suggesting near-term weakness. However, the realized price around $2,340 has been acting as dynamic support, and holding above this level could signal potential for macro expansion. A decisive break below $2,230 would invalidate the bullish structure and potentially target $1,845, while a sustained move above $2,375 could open the path toward $2,900 resistance.
Factors Impacting Ethereum
Multiple fundamental factors are currently influencing Ethereum's price trajectory. On the positive side, institutional adoption continues through spot ETF inflows and increased staking participation. Major institutions like Grayscale and BitMine have expanded their ETH holdings, while the DeFi ecosystem shows resilience with initiatives like Aave's DeFi United raising substantial ETH for risk mitigation.
Technological developments also support the bull case. The Pectra upgrade has improved network efficiency, while Layer 2 scaling solutions including Arbitrum, Optimism, and Base are processing millions of transactions daily at reduced costs. Uniswap V4 Hooks and privacy proposals like EIP-8182 demonstrate ongoing innovation within the ecosystem.
Conversely, bearish pressures include tightening liquidity conditions, negative funding rates in derivatives markets, and rising Bitcoin dominance which often correlates with ETH underperformance. The broader DeFi sector faces systemic risk concerns following recent security incidents, though community responses like the DeFi United initiative show the ecosystem's capacity for collaborative problem-solving.
Trading Strategy Recommendations
For active traders, the current environment suggests a cautious approach with clear risk management parameters. Short-term traders might consider short positions if ETH rejects at the $2,375 resistance level, targeting $2,300 and potentially $2,230 on breaks below the ascending trend channel. Stop-losses should be placed above $2,400 to protect against false breakouts.
Long-term position traders may find accumulation opportunities on any dips toward the $2,200-$2,300 range, particularly if the price holds above the 200 EMA. The confluence of realized price support and long-term technical structure suggests this zone could represent favorable risk-reward entry points for multi-month positions.
Risk management remains paramount given the geopolitical overhang. Position sizing should reflect the elevated uncertainty, with traders prepared for potential volatility spikes if US-Iran talks show meaningful progress or deterioration. Monitoring funding rates, perpetual swap premiums, and options market skew can provide early signals of shifting sentiment.
Outlook and Conclusion
Ethereum sits at a critical juncture where near-term technical weakness contrasts with longer-term fundamental strength. The stalled US-Iran negotiations create uncertainty that could persist until diplomatic clarity emerges, potentially capping upside until resolved. However, the ecosystem's institutional adoption, technological progress, and demonstrated resilience to geopolitical shocks suggest underlying support.
Traders should remain flexible, prepared to adjust positions based on both technical breaks and geopolitical developments. The $2,230-$2,375 range defines the current battleground, with breaks in either direction likely to establish the next significant trend. Patience and disciplined risk management will be essential until clearer directional signals emerge from both technical patterns and macro developments.
repost-content-media
  • Reward
  • Comment
  • Repost
  • Share
#rsETHAttackUpdate
A Defining Shock for DeFi in 2026
The rsETH exploit on April 18, 2026, didn’t just hit one protocol—it exposed a critical structural weakness across the entire decentralized finance ecosystem. What initially appeared to be an isolated bridge issue quickly evolved into a systemic liquidity crisis affecting lending markets, restaking protocols, and cross-chain infrastructure.
At the center of this crisis was Kelp DAO, which suffered a devastating loss of approximately $292 million, making it the largest DeFi exploit of 2026 so far. The attackers drained 116,500 rsETH tokens,
ZRO3.46%
ETH1.7%
HighAmbition
#rsETHAttackUpdate
A Defining Shock for DeFi in 2026
The rsETH exploit on April 18, 2026, didn’t just hit one protocol—it exposed a critical structural weakness across the entire decentralized finance ecosystem. What initially appeared to be an isolated bridge issue quickly evolved into a systemic liquidity crisis affecting lending markets, restaking protocols, and cross-chain infrastructure.
At the center of this crisis was Kelp DAO, which suffered a devastating loss of approximately $292 million, making it the largest DeFi exploit of 2026 so far. The attackers drained 116,500 rsETH tokens, representing nearly 18% of the total circulating supply, immediately destabilizing confidence in liquid restaking assets.
Root Cause: Not a Smart Contract Bug, But Infrastructure Failure
Unlike many previous exploits, this attack did not originate from a flaw in smart contracts or lending logic. Instead, it targeted a weaker layer—cross-chain communication infrastructure powered by LayerZero Version 2.
The most critical vulnerability was the 1-of-1 verifier setup, meaning only a single validator was responsible for confirming cross-chain messages. This created a dangerous single point of failure in an otherwise decentralized system.
Step-by-Step Attack Breakdown
The attack was highly coordinated and executed with precision:
Attack initiated at Ethereum block 24,908,285
Target: Bridge route between Unichain and Ethereum
Attackers compromised two RPC nodes
Malicious software replaced legitimate node infrastructure
Simultaneous denial-of-service attacks disabled clean nodes
System was forced to rely on compromised data feeds
This allowed attackers to forge a fake cross-chain message, tricking the bridge into releasing real assets on Ethereum without any backing.
The result:
➡️ 116,500 rsETH minted out of thin air
➡️ Sent directly to attacker-controlled wallets
➡️ Logs erased, malware self-deleted
This wasn’t just hacking—it was infrastructure manipulation at a deep level.
Exploitation Phase: Turning Fake Assets Into Real Liquidity
Once the attackers had unbacked rsETH, they moved rapidly to extract value.
They deposited around 89,567 rsETH into lending protocols like Aave V3, primarily on Ethereum and Arbitrum.
From there, they borrowed:
~82,650 WETH
Additional wstETH positions
Total borrowed value: ~$236 million
These positions were engineered with extremely tight health factors (1.01–1.03), making liquidation difficult and prolonging systemic stress.
Immediate Market Reaction: Liquidity Crisis Unfolds
Although Aave was not directly hacked, it became the primary shock absorber.
Key Impacts:
100% utilization reached in multiple WETH pools
Borrow rates adjusted downward to stabilize liquidity
rsETH collateral frozen across 11 deployments
Loan-to-value (LTV) ratios set to zero
This triggered a cascade:
Massive withdrawals across DeFi
Total Value Locked (TVL) dropped $5B–$10B+
“Bank-run” behavior spread across protocols
A notable withdrawal of ~$154 million, reportedly linked to Justin Sun, intensified panic sentiment.
Price Impact Across the Market
Ethereum (ETH)
Dropped 2%–3.7%
Traded near $2,300–$2,380
Decline driven by sentiment and liquidity stress—not protocol failure
Bitcoin (BTC)
Held relatively stable around $78,980
Acted as a risk-off safe haven within crypto
AAVE Token
Fell 16%–20%
Traded between $95–$105
Reflected direct exposure to lending ecosystem risk
Bad Debt Scenarios: Systemic Risk Quantified
Analysts modeled multiple outcomes:
Scenario 1: Distributed Loss Model
Bad debt: ~$123.7 million
Implies ~15% depeg in rsETH
Scenario 2: Isolated L2 Loss Model
Bad debt: ~$230 million
Severe impact on:
Arbitrum: up to 27% shortfall
Base: ~23%
Mantle: extreme cases up to 71%
Aave-specific exposure
Estimated between $177M–$200M
Rapid Response: DeFi Coordination in Action
Despite the scale of the attack, response speed was critical.
Kelp DAO Actions
Emergency pause activated within 46 minutes
Prevented additional $95M–$100M loss
Halted minting and bridging
Recovery Efforts – “DeFi United”
Industry-wide collaboration to restore backing
Key contributions:
Arbitrum recovered 30,000+ ETH
Mantle proposed 30,000 ETH credit facility
Aave DAO considered 25,000 ETH support
Contributions from Lido, EtherFi, Golem Foundation
Total pledged: ➡️ 43,500+ ETH (~$100M+)
Security Attribution and Investigation
Lazarus Group was identified with high confidence as the attacker.
This aligns with previous high-profile crypto exploits, reinforcing a growing trend:
➡️ Nation-state actors targeting DeFi infrastructure
➡️ Focus shifting from smart contracts to off-chain systems
Key Lessons for DeFi and Cross-Chain Systems
This exploit revealed several critical weaknesses:
1. Single Verifier = Systemic Risk
Decentralization must extend beyond smart contracts into validation layers.
2. RPC Node Security is Critical
Attackers didn’t break code—they corrupted data sources.
3. Cross-Chain Complexity Multiplies Risk
Operating across 20+ chains introduces exponential attack surfaces.
4. Liquidity Layer is Fragile
Even safe protocols like Aave can face stress under extreme conditions.
Market Psychology: Fear, Liquidity, and Trust
The exploit triggered three key psychological phases:
Shock Phase – Immediate panic and withdrawals
Liquidity Crunch – Borrowing pressure and frozen markets
Stabilization – Governance actions and recovery pledges
Interestingly, no widespread retail wallet losses occurred. The damage was protocol-level, not user-level—an important distinction that helped prevent deeper panic.
Current Status (Late April 2026)
Gradual unfreezing of assets underway
Governance votes determining final loss distribution
rsETH partially stabilized but still under scrutiny
Security upgrades being implemented across bridges
Forward Outlook: What Comes Next?
Short-Term
Continued volatility in ETH-linked assets
Tight liquidity conditions persist
DeFi TVL recovery will be gradual
Mid-Term
Mandatory multi-verifier bridge standards
Increased audits of infrastructure layers
Higher risk premiums on restaking assets
Long-Term
Stronger, more resilient cross-chain systems
Institutional confidence returns with safeguards
DeFi evolves toward security-first architecture
Final Takeaway
The rsETH exploit was not just another hack—it was a stress test for the entire DeFi ecosystem.
Despite:
$292M drained
$200M+ bad debt risk
Billions in liquidity shifts
The system did not collapse.
Instead, it coordinated, adapted, and began recovery.
That’s the real story here:
➡️ DeFi is fragile—but resilient
➡️ Interconnected—but responsive
➡️ Risky—but evolving fast
repost-content-media
  • Reward
  • Comment
  • Repost
  • Share