#SOXL
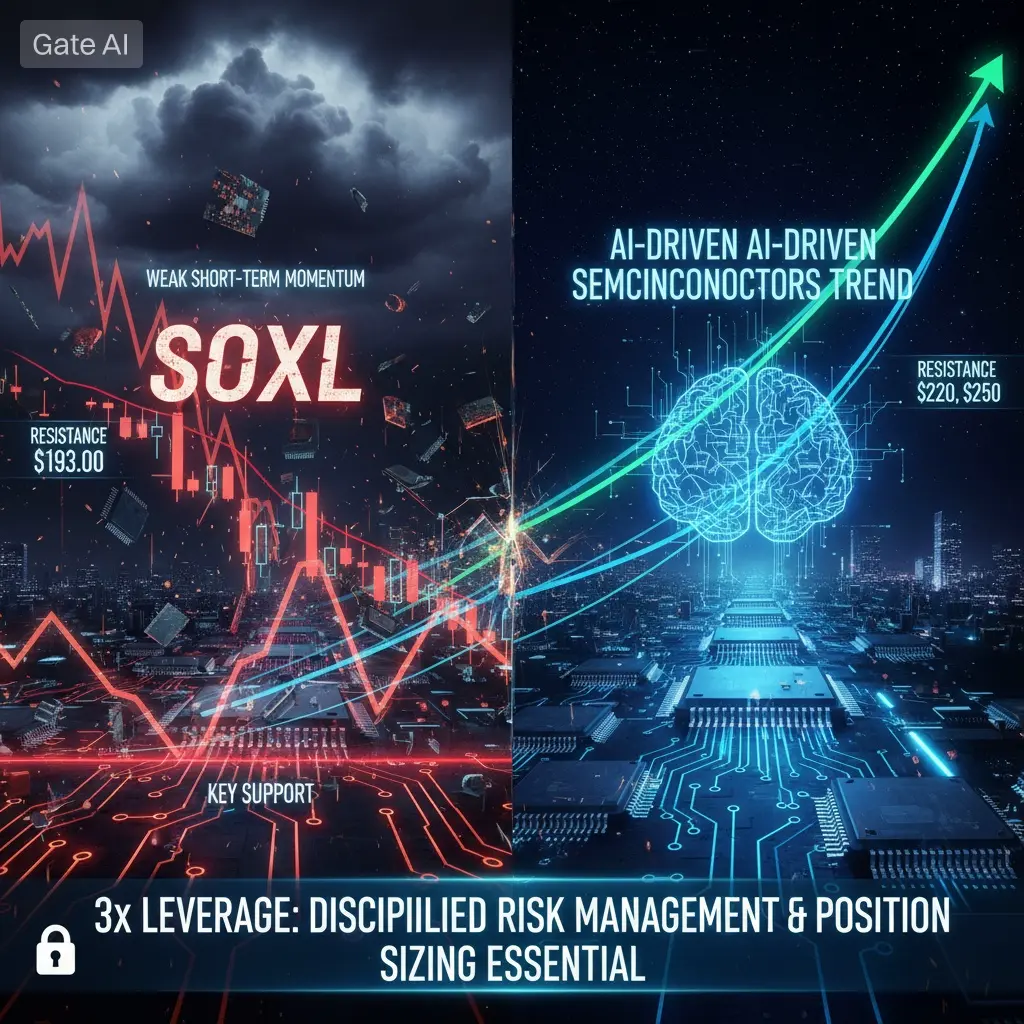
SOXL which stands for Direxion Daily Semiconductor Bull 3X Shares is a leveraged exchange traded fund that provides three times the daily performance of the ICE Semiconductor Index. This ETF has become one of the most closely watched instruments in the market due to its high volatility and potential for amplified returns. The current price of SOXL is approximately 193 dollars which represents a significant position within the broader semiconductor sector rally.
Understanding SOXL Structure and Mechanics
SOXL operates as a triple leveraged ETF meaning it aims to deliver 300 percent of the daily returns of its underlying benchmark index. This leverage is achieved through the use of financial derivatives including swaps and futures contracts. It is crucial for traders to understand that SOXL rebalances daily which exposes it to volatility decay in sideways markets. The fund tracks 30 of the largest United States listed semiconductor companies with heavy weightings toward industry leaders such as NVIDIA AMD Broadcom and Intel. The performance of these underlying holdings directly impacts SOXL price movements making it essential to monitor earnings reports and guidance from these semiconductor giants.
Current Market Performance and Recent Price Action
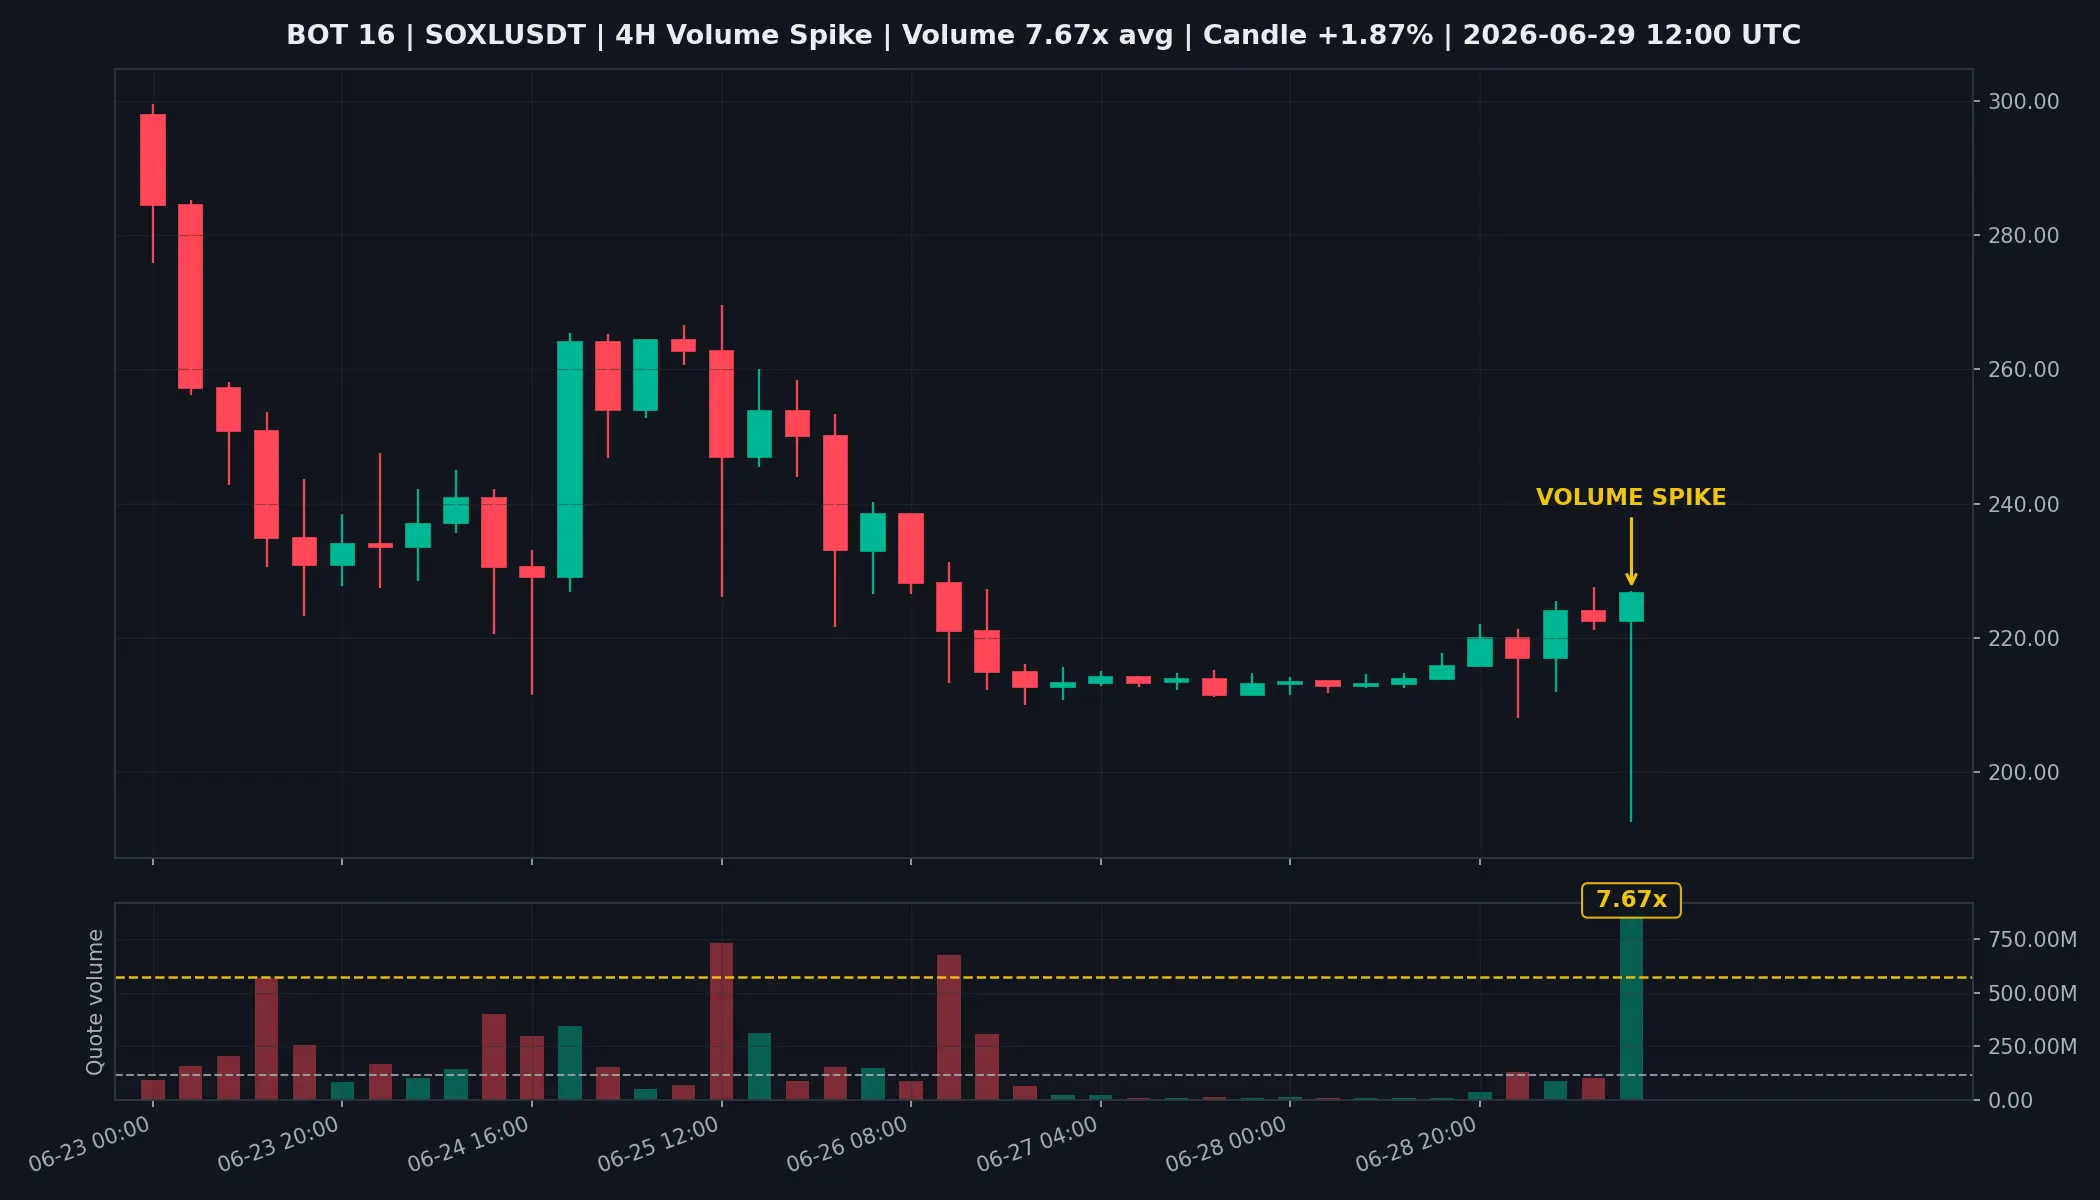
SOXL has demonstrated remarkable volatility in recent trading sessions. The ETF experienced an 11.25 percent intraday fluctuation with a day low of 158.87 dollars and a day high of 176.75 dollars in recent sessions. Volume has remained elevated with approximately 62 million shares traded representing roughly 10.77 billion dollars in notional value. Despite recent pullbacks SOXL delivered an impressive 56.30 percent annual gain in 2025 reflecting renewed confidence in the semiconductor sector. The fund has gained 5.77 percent in the most recent trading day climbing from 165.28 dollars to 174.82 dollars showing resilience despite broader market uncertainty.
Key Support and Resistance Levels
Technical analysis reveals several critical price zones that traders must monitor closely. The immediate support level sits at 168.02 dollars which represents the lower trend floor of the current rising channel. A breakdown below this level would indicate a slower upward trajectory and potentially signal a deeper correction. The next significant support zone is located at 158.87 dollars which marked the recent day low and serves as a psychological barrier for bullish sentiment. Further down the 150 dollar level represents a major support area that if breached could trigger accelerated selling pressure toward the 140 dollar zone.
On the resistance side the first major hurdle appears at 200 dollars which represents a round number resistance and psychological barrier. Above that the 220 dollar level marks the previous swing high area and would require significant buying pressure to overcome. The ultimate resistance target for the current cycle sits between 338.94 dollars and 667.45 dollars based on statistical price projections with a 90 percent probability range over the next three months. These projections suggest that if bullish momentum continues SOXL could potentially more than double from current levels.
RSI Analysis and Momentum Indicators
The Relative Strength Index for SOXL has shown mixed signals in recent sessions. The 10 day RSI oscillator moved out of overbought territory on June 5th 2026 which historically has preceded downward moves in the majority of cases. However the stochastic oscillator has indicated that the ticker has stayed in the oversold zone for multiple days suggesting that a price bounce could occur in the near future. The momentum indicator moved below the zero level on June 30th 2026 which is typically interpreted as a bearish signal. Additionally the Moving Average Convergence Divergence histogram turned negative on June 24th 2026 further supporting cautious sentiment. Despite these bearish signals there are indications that momentum could shift positive as the stochastic oscillator suggests oversold conditions may lead to a rebound.
Moving Average Analysis
SOXL moved below its 50 day moving average on July 2nd 2026 indicating a shift from an upward trend to a downward trend in the short term. Both short term and long term moving averages are currently generating sell signals which presents a more negative forecast for the ETF. However the price remains in the lower portion of a very wide and strong rising trend which historically has presented good buying opportunities for patient investors. The 200 day moving average continues to provide structural support suggesting that the longer term trend remains intact despite recent weakness.
Trading Strategy and Price Forecast
Based on current technical and fundamental analysis SOXL is expected to rise 101.73 percent during the next three months according to statistical models. With a 90 percent probability the price is projected to hold between 338.94 dollars and 667.45 dollars at the end of this three month period. This forecast assumes that the semiconductor sector continues to benefit from artificial intelligence driven demand and that macroeconomic conditions remain supportive.
For traders looking to capitalize on SOXL movements a strategic approach is essential. The ETF is currently positioned as a sell candidate according to some technical models with a loss of 19.64 percent since July 1st 2026. However the strong underlying trend in semiconductors suggests that pullbacks may represent buying opportunities for those with appropriate risk tolerance.
Stop Loss and Take Profit Levels
For risk management traders should consider multiple stop loss levels based on their individual risk appetite. Stop Loss Level 1 at 185 dollars represents a tight stop for active traders looking to limit downside exposure. Stop Loss Level 2 at 175 dollars aligns with recent support clusters and would indicate a breakdown of the current consolidation pattern. Stop Loss Level 3 at 165 dollars provides wider protection and corresponds to the recent swing low area offering a more conservative exit point.
On the profit taking side Take Profit Level 1 at 220 dollars targets the previous resistance zone and offers a 13.99 percent gain from current levels. Take Profit Level 2 at 250 dollars represents a significant psychological level and would deliver a 29.53 percent return. Take Profit Level 3 at 300 dollars aligns with the upper range of statistical projections and offers a 55.44 percent upside potential for longer term holders.
Fundamental Drivers and Market Sentiment
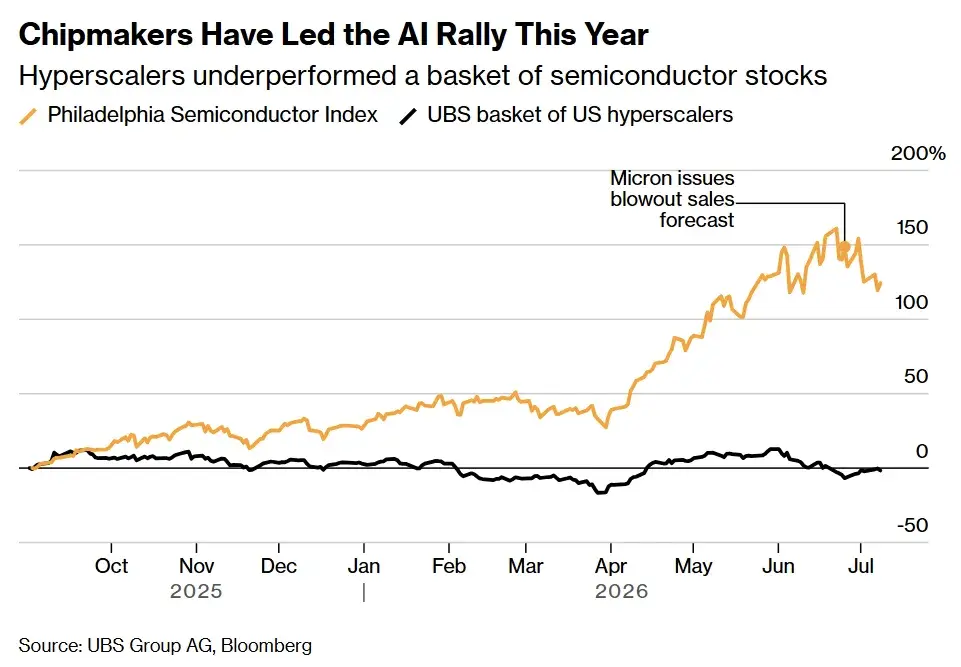
The semiconductor sector continues to be driven by unprecedented demand for artificial intelligence infrastructure. Major technology companies are investing billions of dollars in data center expansion which directly benefits the holdings within SOXL. NVIDIA AMD and Broadcom continue to exceed earnings expectations reinforcing confidence across the entire semiconductor value chain. The transition from artificial intelligence experimentation to full scale deployment across enterprises ensures sustained demand for graphics processing units and specialized artificial intelligence accelerators.
Additional growth drivers include the expansion of 5G infrastructure the rise of electric vehicles which require significantly more chips than traditional automobiles and the recovery of personal computer and smartphone markets. These multiple growth pillars provide diversification and buffer against downturns in any single sub sector.
Risk Factors and Considerations
Traders must remain aware of several risk factors that could impact SOXL performance. Macroeconomic pressures including interest rate uncertainty affect the cost of capital for capital intensive chip fabrication plants and can lead to valuation compression for high growth stocks. Geopolitical tensions particularly regarding United States China chip trade policies pose significant risks as export controls on high end artificial intelligence chips could disrupt revenues for major SOXL holdings.
The reality of volatility decay means that in choppy markets SOXL can lose value even if the underlying index remains flat over time. This mathematical effect makes SOXL better suited for tactical trading rather than long term buy and hold strategies. The fund experienced an 80.01 percent drawdown at one point in 2025 demonstrating the extreme risks involved with leveraged products.
Trader Sentiment and Institutional Activity
Institutional interest in semiconductor ETFs remains robust with significant inflows recorded throughout the latter half of 2025. Retail sentiment is often driven by fear of missing out during artificial intelligence rallies while institutional investors focus on strong buy ratings assigned to top holdings like NVIDIA. Professional forecasting platforms generally maintain a positive outlook though they emphasize that SOXL should only represent a small tactical portion of a diversified portfolio due to its inherent volatility.
Conclusion and Trading Plan
SOXL at approximately 193 dollars presents both significant opportunity and substantial risk for traders. The technical outlook suggests potential for substantial upside with statistical models projecting gains exceeding 100 percent over the next three months. However current bearish signals from moving averages and momentum indicators suggest caution in the immediate term.
Traders should consider waiting for confirmation of support at the 168 to 175 dollar zone before establishing new long positions. Those already holding positions should monitor the 185 dollar level closely as a breakdown could signal further weakness. The artificial intelligence driven semiconductor bull run remains intact from a fundamental perspective but the leveraged nature of SOXL requires disciplined risk management and appropriate position sizing.
The path forward for SOXL will likely mirror the broader semiconductor sector which continues to benefit from transformative technological trends. However traders must remain prepared for extreme volatility and potential rapid price swings in either direction. Success with SOXL requires constant monitoring of technical levels earnings reports from underlying holdings and broader macroeconomic conditions that could impact risk appetite across equity markets.@Gate_Square
SOXL which stands for Direxion Daily Semiconductor Bull 3X Shares is a leveraged exchange traded fund that provides three times the daily performance of the ICE Semiconductor Index. This ETF has become one of the most closely watched instruments in the market due to its high volatility and potential for amplified returns. The current price of SOXL is approximately 193 dollars which represents a significant position within the broader semiconductor sector rally.
Understanding SOXL Structure and Mechanics
SOXL operates as a triple leveraged ETF meaning it aims to deliver 300 percent of the daily returns of its underlying benchmark index. This leverage is achieved through the use of financial derivatives including swaps and futures contracts. It is crucial for traders to understand that SOXL rebalances daily which exposes it to volatility decay in sideways markets. The fund tracks 30 of the largest United States listed semiconductor companies with heavy weightings toward industry leaders such as NVIDIA AMD Broadcom and Intel. The performance of these underlying holdings directly impacts SOXL price movements making it essential to monitor earnings reports and guidance from these semiconductor giants.
Current Market Performance and Recent Price Action
SOXL has demonstrated remarkable volatility in recent trading sessions. The ETF experienced an 11.25 percent intraday fluctuation with a day low of 158.87 dollars and a day high of 176.75 dollars in recent sessions. Volume has remained elevated with approximately 62 million shares traded representing roughly 10.77 billion dollars in notional value. Despite recent pullbacks SOXL delivered an impressive 56.30 percent annual gain in 2025 reflecting renewed confidence in the semiconductor sector. The fund has gained 5.77 percent in the most recent trading day climbing from 165.28 dollars to 174.82 dollars showing resilience despite broader market uncertainty.
Key Support and Resistance Levels
Technical analysis reveals several critical price zones that traders must monitor closely. The immediate support level sits at 168.02 dollars which represents the lower trend floor of the current rising channel. A breakdown below this level would indicate a slower upward trajectory and potentially signal a deeper correction. The next significant support zone is located at 158.87 dollars which marked the recent day low and serves as a psychological barrier for bullish sentiment. Further down the 150 dollar level represents a major support area that if breached could trigger accelerated selling pressure toward the 140 dollar zone.
On the resistance side the first major hurdle appears at 200 dollars which represents a round number resistance and psychological barrier. Above that the 220 dollar level marks the previous swing high area and would require significant buying pressure to overcome. The ultimate resistance target for the current cycle sits between 338.94 dollars and 667.45 dollars based on statistical price projections with a 90 percent probability range over the next three months. These projections suggest that if bullish momentum continues SOXL could potentially more than double from current levels.
RSI Analysis and Momentum Indicators
The Relative Strength Index for SOXL has shown mixed signals in recent sessions. The 10 day RSI oscillator moved out of overbought territory on June 5th 2026 which historically has preceded downward moves in the majority of cases. However the stochastic oscillator has indicated that the ticker has stayed in the oversold zone for multiple days suggesting that a price bounce could occur in the near future. The momentum indicator moved below the zero level on June 30th 2026 which is typically interpreted as a bearish signal. Additionally the Moving Average Convergence Divergence histogram turned negative on June 24th 2026 further supporting cautious sentiment. Despite these bearish signals there are indications that momentum could shift positive as the stochastic oscillator suggests oversold conditions may lead to a rebound.
Moving Average Analysis
SOXL moved below its 50 day moving average on July 2nd 2026 indicating a shift from an upward trend to a downward trend in the short term. Both short term and long term moving averages are currently generating sell signals which presents a more negative forecast for the ETF. However the price remains in the lower portion of a very wide and strong rising trend which historically has presented good buying opportunities for patient investors. The 200 day moving average continues to provide structural support suggesting that the longer term trend remains intact despite recent weakness.
Trading Strategy and Price Forecast
Based on current technical and fundamental analysis SOXL is expected to rise 101.73 percent during the next three months according to statistical models. With a 90 percent probability the price is projected to hold between 338.94 dollars and 667.45 dollars at the end of this three month period. This forecast assumes that the semiconductor sector continues to benefit from artificial intelligence driven demand and that macroeconomic conditions remain supportive.
For traders looking to capitalize on SOXL movements a strategic approach is essential. The ETF is currently positioned as a sell candidate according to some technical models with a loss of 19.64 percent since July 1st 2026. However the strong underlying trend in semiconductors suggests that pullbacks may represent buying opportunities for those with appropriate risk tolerance.
Stop Loss and Take Profit Levels
For risk management traders should consider multiple stop loss levels based on their individual risk appetite. Stop Loss Level 1 at 185 dollars represents a tight stop for active traders looking to limit downside exposure. Stop Loss Level 2 at 175 dollars aligns with recent support clusters and would indicate a breakdown of the current consolidation pattern. Stop Loss Level 3 at 165 dollars provides wider protection and corresponds to the recent swing low area offering a more conservative exit point.
On the profit taking side Take Profit Level 1 at 220 dollars targets the previous resistance zone and offers a 13.99 percent gain from current levels. Take Profit Level 2 at 250 dollars represents a significant psychological level and would deliver a 29.53 percent return. Take Profit Level 3 at 300 dollars aligns with the upper range of statistical projections and offers a 55.44 percent upside potential for longer term holders.
Fundamental Drivers and Market Sentiment
The semiconductor sector continues to be driven by unprecedented demand for artificial intelligence infrastructure. Major technology companies are investing billions of dollars in data center expansion which directly benefits the holdings within SOXL. NVIDIA AMD and Broadcom continue to exceed earnings expectations reinforcing confidence across the entire semiconductor value chain. The transition from artificial intelligence experimentation to full scale deployment across enterprises ensures sustained demand for graphics processing units and specialized artificial intelligence accelerators.
Additional growth drivers include the expansion of 5G infrastructure the rise of electric vehicles which require significantly more chips than traditional automobiles and the recovery of personal computer and smartphone markets. These multiple growth pillars provide diversification and buffer against downturns in any single sub sector.
Risk Factors and Considerations
Traders must remain aware of several risk factors that could impact SOXL performance. Macroeconomic pressures including interest rate uncertainty affect the cost of capital for capital intensive chip fabrication plants and can lead to valuation compression for high growth stocks. Geopolitical tensions particularly regarding United States China chip trade policies pose significant risks as export controls on high end artificial intelligence chips could disrupt revenues for major SOXL holdings.
The reality of volatility decay means that in choppy markets SOXL can lose value even if the underlying index remains flat over time. This mathematical effect makes SOXL better suited for tactical trading rather than long term buy and hold strategies. The fund experienced an 80.01 percent drawdown at one point in 2025 demonstrating the extreme risks involved with leveraged products.
Trader Sentiment and Institutional Activity
Institutional interest in semiconductor ETFs remains robust with significant inflows recorded throughout the latter half of 2025. Retail sentiment is often driven by fear of missing out during artificial intelligence rallies while institutional investors focus on strong buy ratings assigned to top holdings like NVIDIA. Professional forecasting platforms generally maintain a positive outlook though they emphasize that SOXL should only represent a small tactical portion of a diversified portfolio due to its inherent volatility.
Conclusion and Trading Plan
SOXL at approximately 193 dollars presents both significant opportunity and substantial risk for traders. The technical outlook suggests potential for substantial upside with statistical models projecting gains exceeding 100 percent over the next three months. However current bearish signals from moving averages and momentum indicators suggest caution in the immediate term.
Traders should consider waiting for confirmation of support at the 168 to 175 dollar zone before establishing new long positions. Those already holding positions should monitor the 185 dollar level closely as a breakdown could signal further weakness. The artificial intelligence driven semiconductor bull run remains intact from a fundamental perspective but the leveraged nature of SOXL requires disciplined risk management and appropriate position sizing.
The path forward for SOXL will likely mirror the broader semiconductor sector which continues to benefit from transformative technological trends. However traders must remain prepared for extreme volatility and potential rapid price swings in either direction. Success with SOXL requires constant monitoring of technical levels earnings reports from underlying holdings and broader macroeconomic conditions that could impact risk appetite across equity markets.@Gate_Square