#$LAB
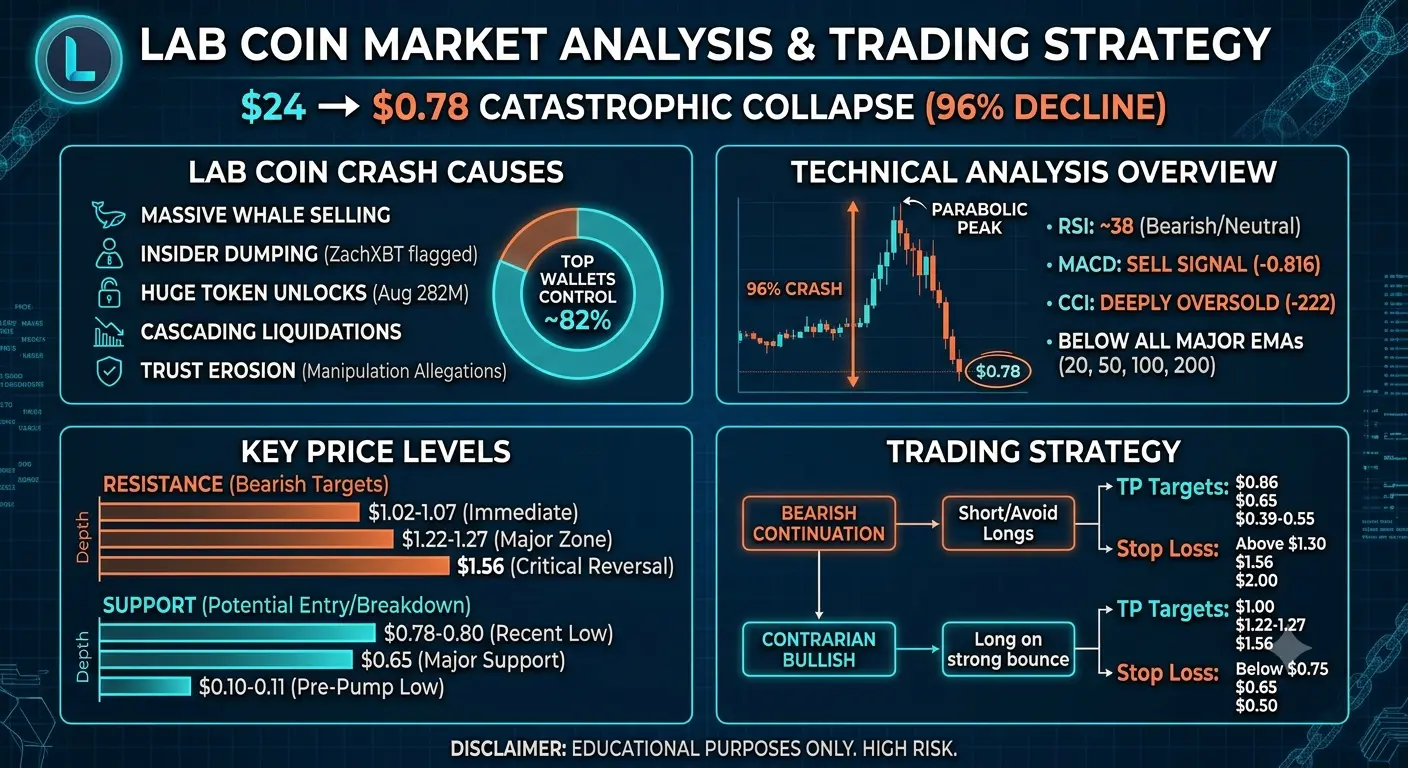
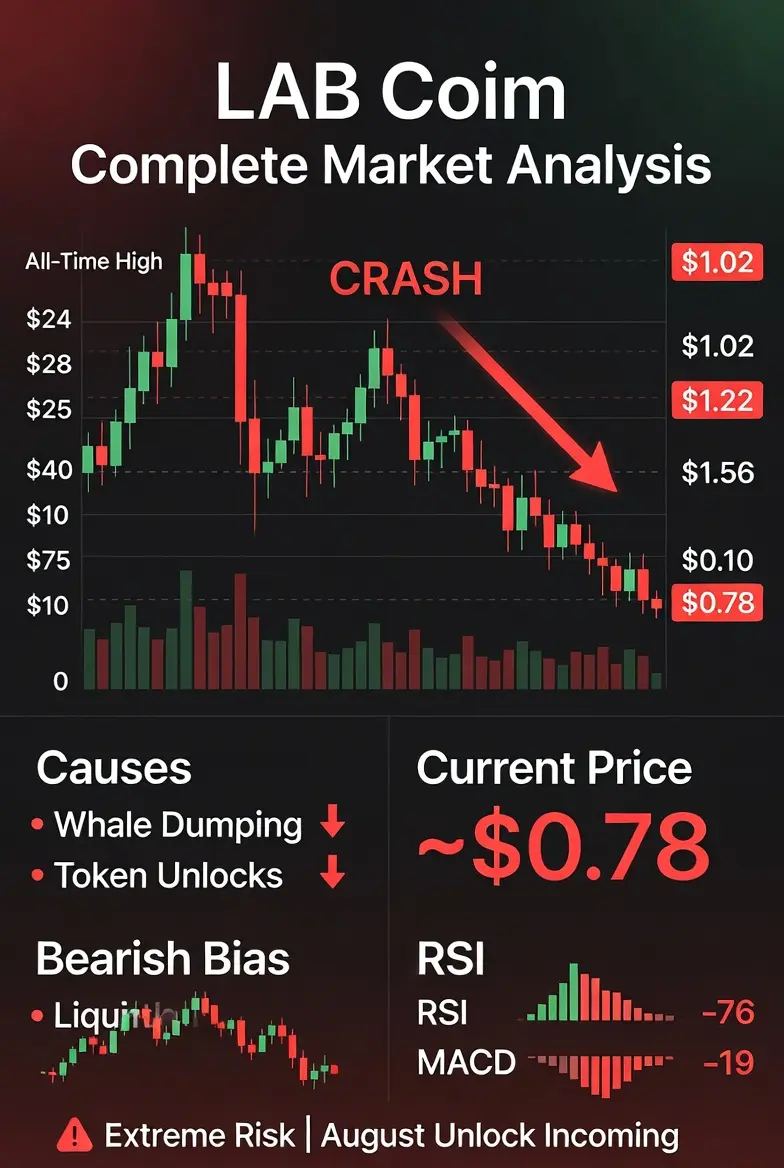
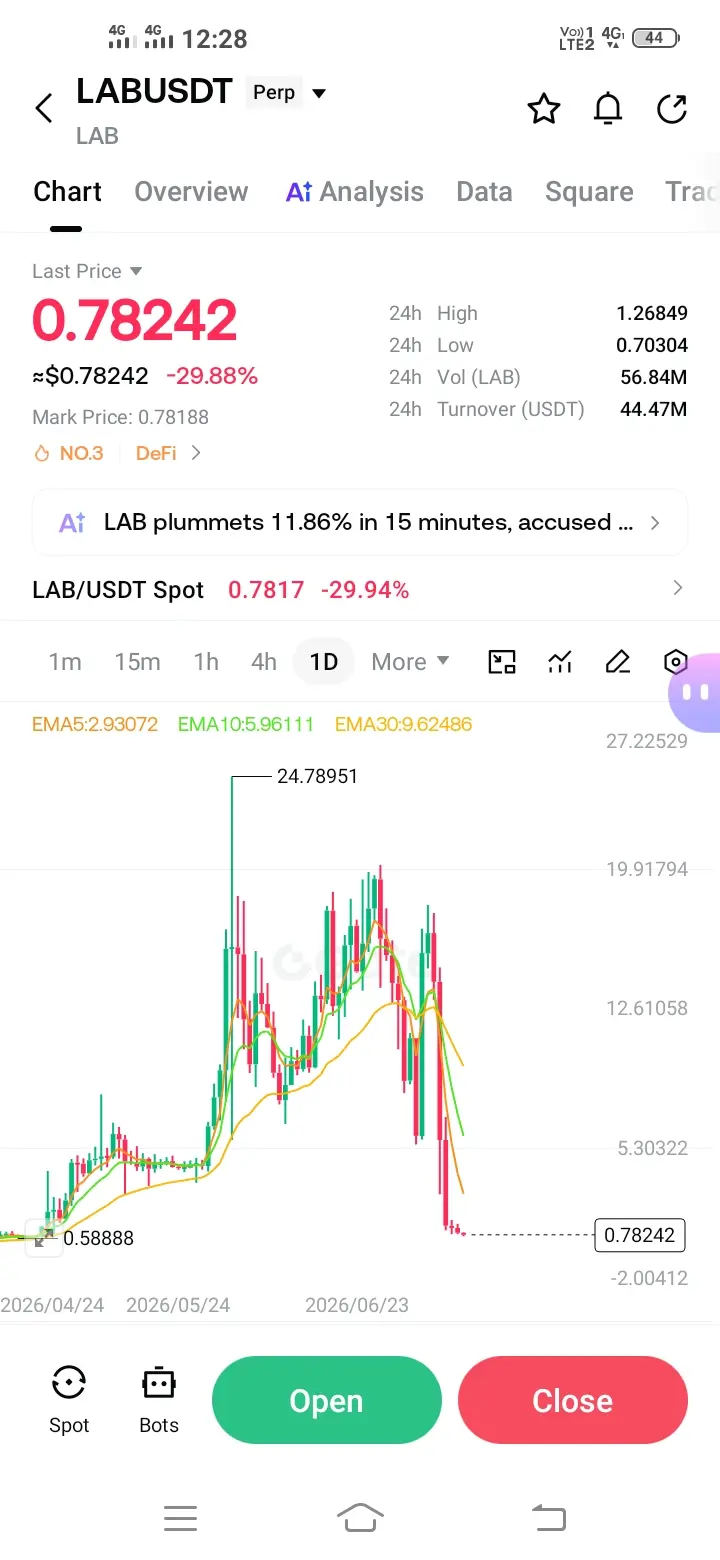
LAB coin has experienced one of the most dramatic crashes in cryptocurrency history. The token reached an all-time high of approximately $24 (some sources cite $16-20 range) and has now collapsed to around $0.78, representing a devastating 96% decline from its peak. This analysis covers everything traders need to understand about this catastrophic price movement.
What Caused the LAB Coin Crash
The crash was not caused by a single event but rather a combination of multiple factors that created a perfect storm for price destruction. Understanding these causes is essential for any trader considering entry into this asset.
Whale and insider selling pressure stands as the primary catalyst. Large holders and market makers dumped massive quantities of tokens simultaneously. Reports indicate that the top six wallets controlled approximately 82% of the total supply, with holdings ranging from 138 million to 200 million tokens each. On a single day, 248 million tokens representing 25% of the entire supply moved between wallets. ZachXBT, a well-known blockchain investigator, flagged suspicious centralized exchange deposits, over-the-counter allocations, and market maker manipulation activities.
Token unlock schedules created significant supply overhang fears. Linear unlocks of 8-9% of circulating supply occurred in July, with a massive unlock of approximately 282 million tokens scheduled for mid-August. This created continuous selling pressure as early investors and team members became eligible to sell their holdings. The fully diluted valuation remained elevated at around $920 million while circulating supply concerns grew exponentially.
Cascading liquidations amplified the selling pressure. Over $14 million in long positions were liquidated as the price fell, causing open interest to collapse and funding rates to turn negative. Thin liquidity transformed the decline into a liquidity spiral where each drop triggered more liquidations, which pushed prices lower, creating more liquidations in a vicious cycle.
Extreme token concentration and trust erosion completed the collapse. The extreme centralization of supply in few wallets combined with allegations of insider-linked supply movements led to a complete breakdown in market confidence. Many community members labeled the event as manipulation or compared it to typical cryptocurrency rug pull dynamics, though the team officially denied any hack or malicious activity.
Current Technical Analysis and Price Levels
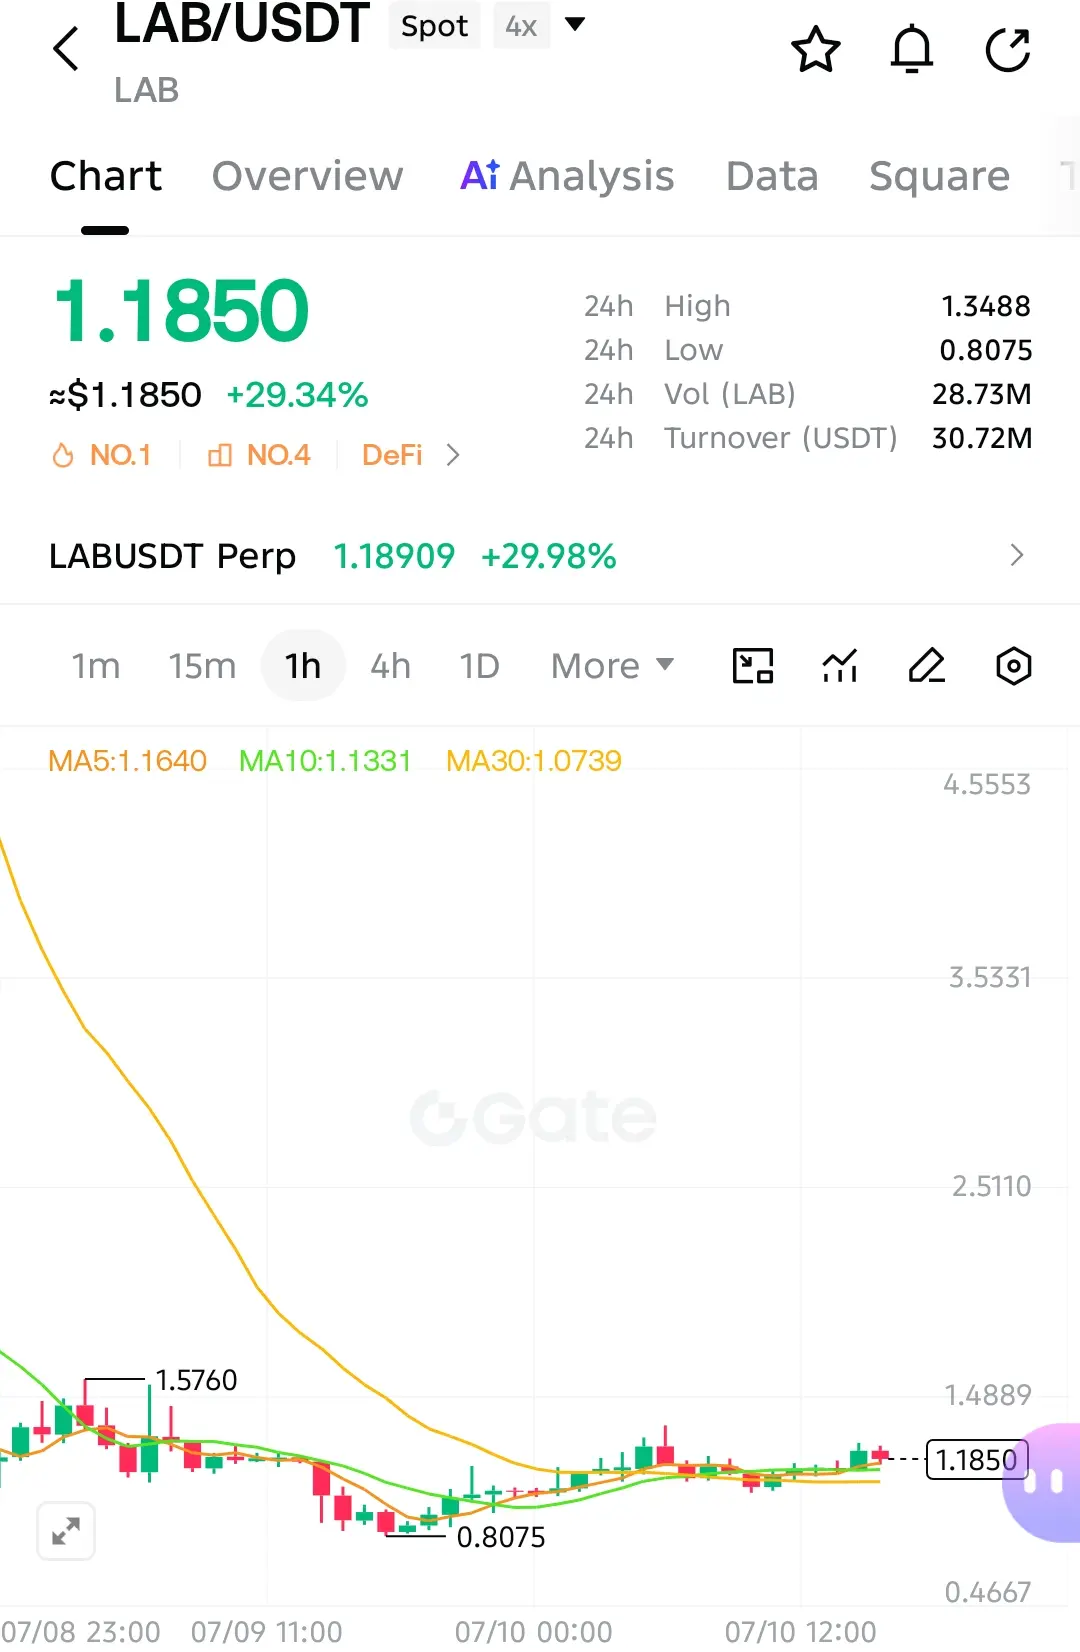
LAB coin is currently trading around $0.78 to $1.20 range, having found temporary stabilization after the violent decline. The technical picture remains overwhelmingly bearish across all timeframes.
The Relative Strength Index currently reads approximately 38, indicating neutral to bearish momentum conditions. After the crash, RSI readings hit extremely oversold levels below 20, suggesting the initial selling was overdone, but the recovery has been weak and unsustainable. The MACD indicator shows a sell signal at negative 0.816, confirming bearish momentum persists. The Commodity Channel Index reads negative 222, which technically generates a buy signal at extreme levels, but in this context suggests deeply oversold conditions that may persist.
Moving average analysis reveals the severity of the downtrend. Price currently trades below the 20 EMA at $1.95, 50 EMA at $5.07, 100 EMA at $8.08, and 200 EMA at $10.35. This configuration confirms the major trend remains bearish, and buyers would need to reclaim the 20 EMA just to establish any short-term bullish momentum.
Key Support and Resistance Levels
Support levels for LAB coin are critical to monitor for potential entry points or breakdown confirmation. The immediate support sits at $0.78 to $0.80, which represents the recent low where some buying interest emerged. Below this, the next major support zone exists at $0.65, which previously acted as demand during the crash. The final significant support lies at $0.10 to $0.11, representing the price level before the massive pump began. A break below $0.65 could accelerate selling toward these lower levels.
Resistance levels present significant challenges for any recovery attempt. The first resistance zone exists at $1.02 to $1.07, representing recent rejection points where selling pressure emerged. Above this, the next major resistance sits at $1.22 to $1.27, which aligns with previous consolidation areas. The critical resistance to reclaim for any meaningful bullish reversal exists at $1.56, which represents a psychological barrier and technical confluence zone. Until price reclaims and holds above $1.56, the overall bias remains bearish.
Trading Strategy with Stop Loss and Take Profit Levels
For traders considering LAB coin, risk management is absolutely critical given the extreme volatility and manipulation risks. The following strategy provides a framework for both bearish and potential bullish scenarios.
Bearish continuation strategy remains the higher probability setup. Entry points for short positions or avoiding longs include rallies toward the $1.02 to $1.07 resistance zone or the $1.22 to $1.27 area on rejections. Stop Loss 1 should be placed above $1.30, representing a buffer above recent swing highs. Stop Loss 2 at $1.56 provides protection if the price reclaims the critical resistance level. Stop Loss 3 at $2.00 accounts for the possibility of a stronger relief rally toward the 20 EMA.
Take profit targets for bearish trades include TP1 at $0.86 to $0.90, representing the first demand zone below current price. TP2 at $0.65 aligns with the major support level where some consolidation may occur. TP3 at $0.39 to $0.55 targets the lower support zones if selling pressure accelerates and liquidity dries up further.
Contrarian bullish strategy carries extreme risk but may appeal to traders seeking high-reward opportunities. Entry for long positions could be considered on strong bounce signals from the $0.78 to $0.84 support zone with confirmation from volume and candlestick patterns. Stop Loss 1 should be placed below $0.75 to protect against breakdown below the recent low. Stop Loss 2 at $0.65 provides additional protection if the first support fails. Stop Loss 3 at $0.50 accounts for total capitulation scenarios.
Take profit targets for bullish trades include TP1 at $1.00, representing a psychological round number and initial resistance. TP2 at $1.22 to $1.27 aligns with the first major resistance zone. TP3 at $1.56 targets the critical resistance level that must be reclaimed for trend reversal consideration.
Will LAB Coin Surge Again
The probability of LAB coin surging back to previous highs appears extremely low in the near term based on current evidence. Several factors support this cautious outlook.
Token unlock schedules continue to pose significant headwinds. With approximately 282 million tokens unlocking in mid-August, additional selling pressure seems inevitable unless the team implements new lockup mechanisms or burn programs. The team did burn 10 million tokens worth approximately $11.3 million in an attempt to restore confidence, but this represents only a small fraction of the total supply concerns.
Market sentiment remains deeply negative. The community has lost trust in the project following the crash, with many traders experiencing substantial losses. Rebuilding this trust requires time, transparency, and consistent delivery on roadmap promises. The team has stated they remain committed to their product roadmap, but words alone cannot restore market confidence.
Technical structure shows no signs of bottoming formation. Price action continues to make lower lows and lower highs on most timeframes. Volume patterns show distribution rather than accumulation. Until a clear bottoming pattern emerges with sustained buying volume, any rallies should be treated as relief bounces within a larger downtrend rather than trend reversals.
Risk Management Considerations
Trading LAB coin requires extreme caution and strict risk management protocols. The following guidelines are essential for anyone considering exposure to this asset.
Position sizing should be minimal given the risks involved. Never risk more than 1% of total trading capital on any single LAB coin trade. The extreme volatility means prices can move 20-50% in minutes, making large positions extremely dangerous.
Use guaranteed stop losses whenever possible. Standard stop losses may experience significant slippage during volatile periods. Consider using smaller position sizes to accommodate wider stop losses and avoid being stopped out by normal volatility.
Monitor exchange risk carefully. Some exchanges may delist tokens experiencing extreme volatility or manipulation concerns. Diversify exchange exposure and avoid holding large amounts on any single platform.
Stay informed about token unlock schedules and team announcements. The August unlock represents a major risk event that could trigger additional selling. Adjust positions accordingly ahead of such events.
Consider the possibility of total loss. Tokens that experience 96% declines sometimes recover partially, but many never return to previous highs. Only invest what you can afford to lose completely.
LAB coin represents a cautionary tale about the risks of highly concentrated token distributions and the dangers of chasing parabolic price moves. The crash from $24 to $0.78 destroyed billions in market value and wiped out countless traders who bought near the top.
For current traders, the technical setup favors bearish continuation with key resistances at $1.02-$1.07 and $1.22-$1.27. Support levels at $0.78-$0.80 and $0.65 provide potential downside targets. Any recovery would need to reclaim $1.56 to suggest trend reversal potential.
The August token unlock remains the critical event to monitor. If large holders continue selling, prices could break below current support and test lower levels near $0.39-$0.55. If the team successfully manages the unlock and rebuilds community trust, a stabilization phase could emerge.
Traders should approach LAB coin with extreme caution, use strict risk management, and never risk more than they can afford to lose completely. The high concentration of supply in few wallets and ongoing manipulation concerns make this one of the riskiest assets in the cryptocurrency market.@Gate_Square
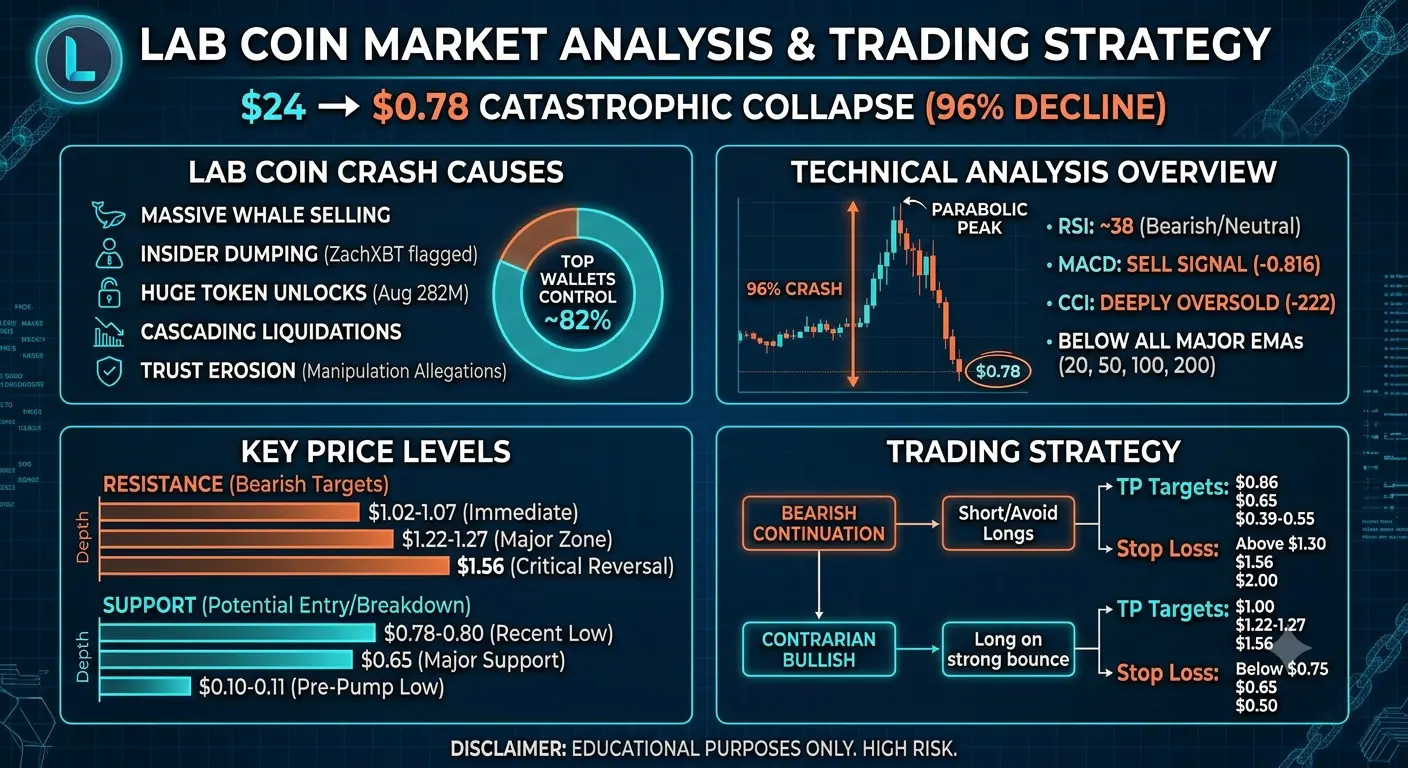
LAB coin has experienced one of the most dramatic crashes in cryptocurrency history. The token reached an all-time high of approximately $24 (some sources cite $16-20 range) and has now collapsed to around $0.78, representing a devastating 96% decline from its peak. This analysis covers everything traders need to understand about this catastrophic price movement.
What Caused the LAB Coin Crash
The crash was not caused by a single event but rather a combination of multiple factors that created a perfect storm for price destruction. Understanding these causes is essential for any trader considering entry into this asset.
Whale and insider selling pressure stands as the primary catalyst. Large holders and market makers dumped massive quantities of tokens simultaneously. Reports indicate that the top six wallets controlled approximately 82% of the total supply, with holdings ranging from 138 million to 200 million tokens each. On a single day, 248 million tokens representing 25% of the entire supply moved between wallets. ZachXBT, a well-known blockchain investigator, flagged suspicious centralized exchange deposits, over-the-counter allocations, and market maker manipulation activities.
Token unlock schedules created significant supply overhang fears. Linear unlocks of 8-9% of circulating supply occurred in July, with a massive unlock of approximately 282 million tokens scheduled for mid-August. This created continuous selling pressure as early investors and team members became eligible to sell their holdings. The fully diluted valuation remained elevated at around $920 million while circulating supply concerns grew exponentially.
Cascading liquidations amplified the selling pressure. Over $14 million in long positions were liquidated as the price fell, causing open interest to collapse and funding rates to turn negative. Thin liquidity transformed the decline into a liquidity spiral where each drop triggered more liquidations, which pushed prices lower, creating more liquidations in a vicious cycle.
Extreme token concentration and trust erosion completed the collapse. The extreme centralization of supply in few wallets combined with allegations of insider-linked supply movements led to a complete breakdown in market confidence. Many community members labeled the event as manipulation or compared it to typical cryptocurrency rug pull dynamics, though the team officially denied any hack or malicious activity.
Current Technical Analysis and Price Levels
LAB coin is currently trading around $0.78 to $1.20 range, having found temporary stabilization after the violent decline. The technical picture remains overwhelmingly bearish across all timeframes.
The Relative Strength Index currently reads approximately 38, indicating neutral to bearish momentum conditions. After the crash, RSI readings hit extremely oversold levels below 20, suggesting the initial selling was overdone, but the recovery has been weak and unsustainable. The MACD indicator shows a sell signal at negative 0.816, confirming bearish momentum persists. The Commodity Channel Index reads negative 222, which technically generates a buy signal at extreme levels, but in this context suggests deeply oversold conditions that may persist.
Moving average analysis reveals the severity of the downtrend. Price currently trades below the 20 EMA at $1.95, 50 EMA at $5.07, 100 EMA at $8.08, and 200 EMA at $10.35. This configuration confirms the major trend remains bearish, and buyers would need to reclaim the 20 EMA just to establish any short-term bullish momentum.
Key Support and Resistance Levels
Support levels for LAB coin are critical to monitor for potential entry points or breakdown confirmation. The immediate support sits at $0.78 to $0.80, which represents the recent low where some buying interest emerged. Below this, the next major support zone exists at $0.65, which previously acted as demand during the crash. The final significant support lies at $0.10 to $0.11, representing the price level before the massive pump began. A break below $0.65 could accelerate selling toward these lower levels.
Resistance levels present significant challenges for any recovery attempt. The first resistance zone exists at $1.02 to $1.07, representing recent rejection points where selling pressure emerged. Above this, the next major resistance sits at $1.22 to $1.27, which aligns with previous consolidation areas. The critical resistance to reclaim for any meaningful bullish reversal exists at $1.56, which represents a psychological barrier and technical confluence zone. Until price reclaims and holds above $1.56, the overall bias remains bearish.
Trading Strategy with Stop Loss and Take Profit Levels
For traders considering LAB coin, risk management is absolutely critical given the extreme volatility and manipulation risks. The following strategy provides a framework for both bearish and potential bullish scenarios.
Bearish continuation strategy remains the higher probability setup. Entry points for short positions or avoiding longs include rallies toward the $1.02 to $1.07 resistance zone or the $1.22 to $1.27 area on rejections. Stop Loss 1 should be placed above $1.30, representing a buffer above recent swing highs. Stop Loss 2 at $1.56 provides protection if the price reclaims the critical resistance level. Stop Loss 3 at $2.00 accounts for the possibility of a stronger relief rally toward the 20 EMA.
Take profit targets for bearish trades include TP1 at $0.86 to $0.90, representing the first demand zone below current price. TP2 at $0.65 aligns with the major support level where some consolidation may occur. TP3 at $0.39 to $0.55 targets the lower support zones if selling pressure accelerates and liquidity dries up further.
Contrarian bullish strategy carries extreme risk but may appeal to traders seeking high-reward opportunities. Entry for long positions could be considered on strong bounce signals from the $0.78 to $0.84 support zone with confirmation from volume and candlestick patterns. Stop Loss 1 should be placed below $0.75 to protect against breakdown below the recent low. Stop Loss 2 at $0.65 provides additional protection if the first support fails. Stop Loss 3 at $0.50 accounts for total capitulation scenarios.
Take profit targets for bullish trades include TP1 at $1.00, representing a psychological round number and initial resistance. TP2 at $1.22 to $1.27 aligns with the first major resistance zone. TP3 at $1.56 targets the critical resistance level that must be reclaimed for trend reversal consideration.
Will LAB Coin Surge Again
The probability of LAB coin surging back to previous highs appears extremely low in the near term based on current evidence. Several factors support this cautious outlook.
Token unlock schedules continue to pose significant headwinds. With approximately 282 million tokens unlocking in mid-August, additional selling pressure seems inevitable unless the team implements new lockup mechanisms or burn programs. The team did burn 10 million tokens worth approximately $11.3 million in an attempt to restore confidence, but this represents only a small fraction of the total supply concerns.
Market sentiment remains deeply negative. The community has lost trust in the project following the crash, with many traders experiencing substantial losses. Rebuilding this trust requires time, transparency, and consistent delivery on roadmap promises. The team has stated they remain committed to their product roadmap, but words alone cannot restore market confidence.
Technical structure shows no signs of bottoming formation. Price action continues to make lower lows and lower highs on most timeframes. Volume patterns show distribution rather than accumulation. Until a clear bottoming pattern emerges with sustained buying volume, any rallies should be treated as relief bounces within a larger downtrend rather than trend reversals.
Risk Management Considerations
Trading LAB coin requires extreme caution and strict risk management protocols. The following guidelines are essential for anyone considering exposure to this asset.
Position sizing should be minimal given the risks involved. Never risk more than 1% of total trading capital on any single LAB coin trade. The extreme volatility means prices can move 20-50% in minutes, making large positions extremely dangerous.
Use guaranteed stop losses whenever possible. Standard stop losses may experience significant slippage during volatile periods. Consider using smaller position sizes to accommodate wider stop losses and avoid being stopped out by normal volatility.
Monitor exchange risk carefully. Some exchanges may delist tokens experiencing extreme volatility or manipulation concerns. Diversify exchange exposure and avoid holding large amounts on any single platform.
Stay informed about token unlock schedules and team announcements. The August unlock represents a major risk event that could trigger additional selling. Adjust positions accordingly ahead of such events.
Consider the possibility of total loss. Tokens that experience 96% declines sometimes recover partially, but many never return to previous highs. Only invest what you can afford to lose completely.
LAB coin represents a cautionary tale about the risks of highly concentrated token distributions and the dangers of chasing parabolic price moves. The crash from $24 to $0.78 destroyed billions in market value and wiped out countless traders who bought near the top.
For current traders, the technical setup favors bearish continuation with key resistances at $1.02-$1.07 and $1.22-$1.27. Support levels at $0.78-$0.80 and $0.65 provide potential downside targets. Any recovery would need to reclaim $1.56 to suggest trend reversal potential.
The August token unlock remains the critical event to monitor. If large holders continue selling, prices could break below current support and test lower levels near $0.39-$0.55. If the team successfully manages the unlock and rebuilds community trust, a stabilization phase could emerge.
Traders should approach LAB coin with extreme caution, use strict risk management, and never risk more than they can afford to lose completely. The high concentration of supply in few wallets and ongoing manipulation concerns make this one of the riskiest assets in the cryptocurrency market.@Gate_Square