On June 15, on X, on-chain analyst EmberCN published monitoring analysis showing that within 2 days, 680 million SIREN tokens (94% of total supply) were systematically dumped and churned, causing the SIREN price to fall from $1.30 to $0.05 (a 96% drop), netting about 64.8 million USDT.
Verified on-chain data: turnover volume, cash-out amount, and fund flows
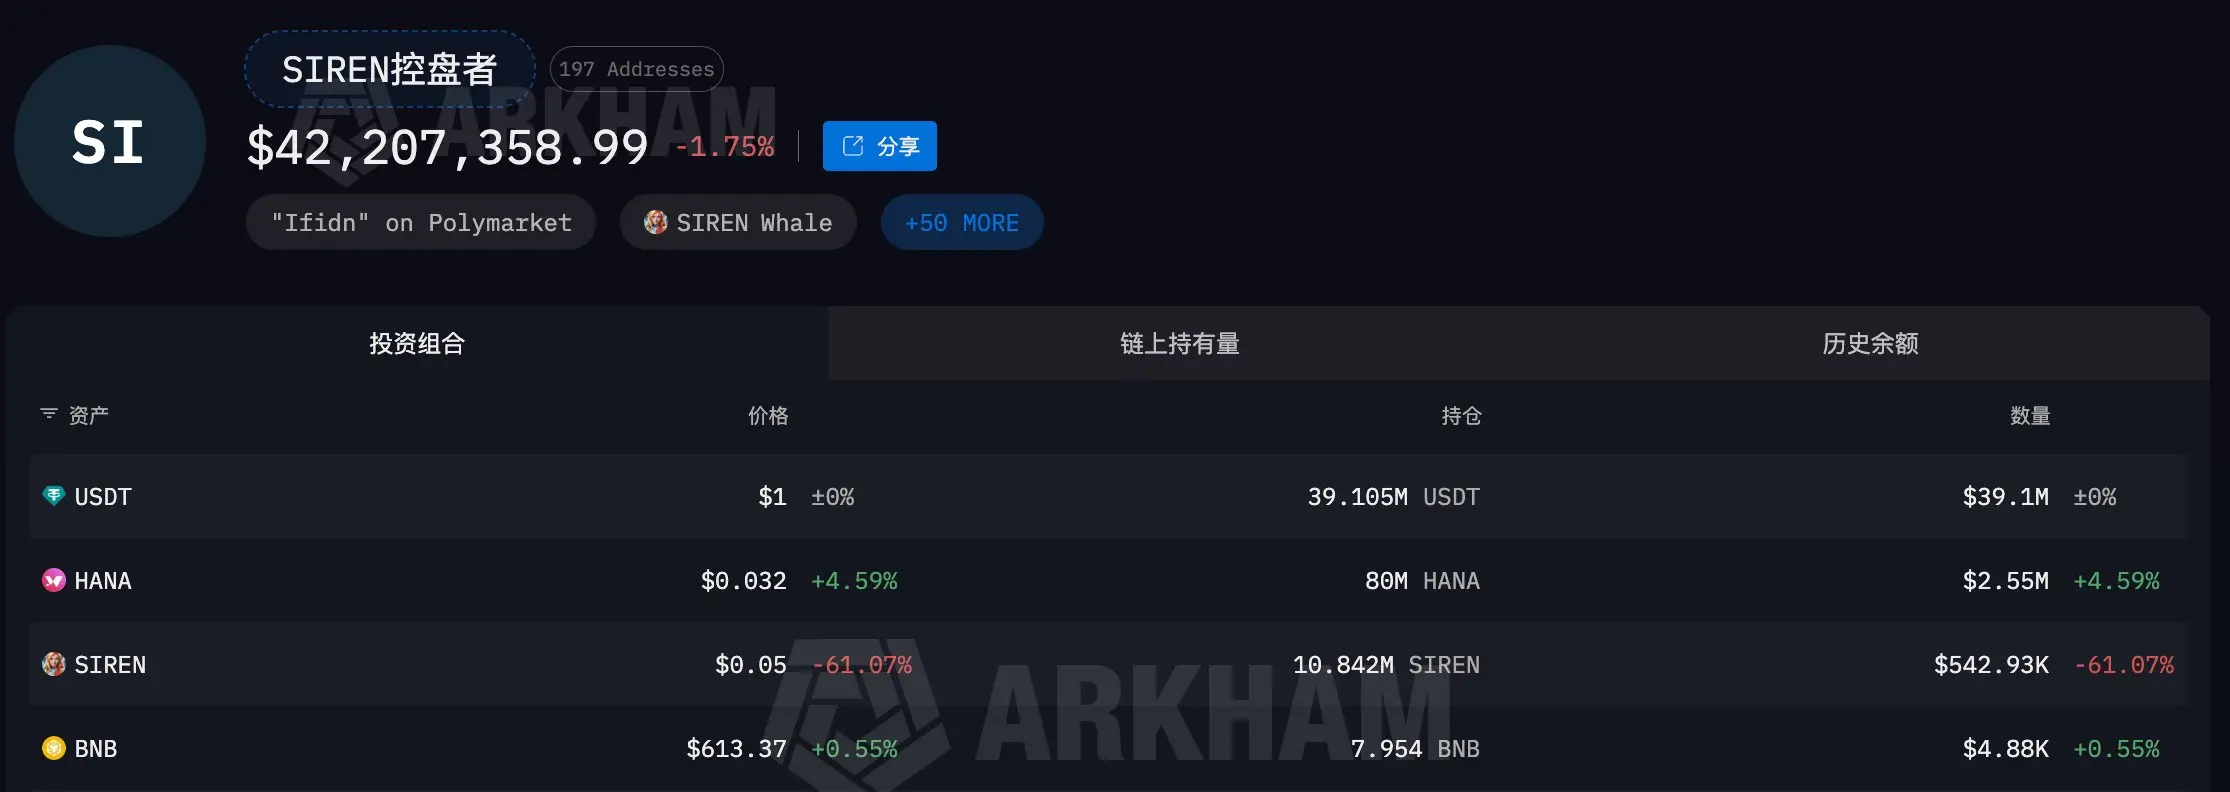 (Source: Arkham)
Based on on-chain monitoring by EmberCN and Lookonchain, the following data has been confirmed:
Turnover volume: 680 million SIREN tokens, 94% of total supply, dumped within 2 days
Cash-out amount: about 64.8 million USDT received
Price impact: from $1.30 to $0.05, down 96%
Fund flows: about 200 million tokens flowed into CEXs such as Binance Wallet, Gate, and KuCoin; the remaining portion was bought in small amounts by hundreds of on-chain addresses (about a few hundred thousand SIREN per address, with value in the thousands to tens of thousands of dollars)
Market-manipulator address (confirmed by Arkham): as of the time of publication, holds about 39.1 million USDT
24-hour trading volume: over $191 million
Lookonchain confirmed that the largest holder accumulated more than $7.5 million in USDT by selling; at the time of analysis, it still holds about 595.7 million SIREN tokens (about 82% of circulating supply).
EmberCN’s analysis assessment: small-lot buybacks attributed to what
The following are EmberCN’s analysis conclusions, which are inferences by an on-chain analyst and not legal confirmations or regulatory conclusions:
Attribution for dispersed small-lot buying: EmberCN assesses that small-lot on-chain purchases from hundreds of addresses are very likely still the handiwork of the market manipulator, using multi-address dispersion to obfuscate fund tracking.
Possible motives assessed by EmberCN: Recollecting chips at low prices; breaking down into smaller parts to increase tracking difficulty; preparing for a possible next round of manipulation.
EmberCN explicitly uses wording such as “very likely” in his X post to mark the uncertainty of the above attributions. BeInCrypto Markets data confirms that as of the time of publication, the trading price of SIREN is close to $0.126, market cap is about $94.7 million, and circulating supply is close to 1 billion tokens—the maximum supply.
Historical concentration of SIREN tokens and multiple pump-and-dump cycles
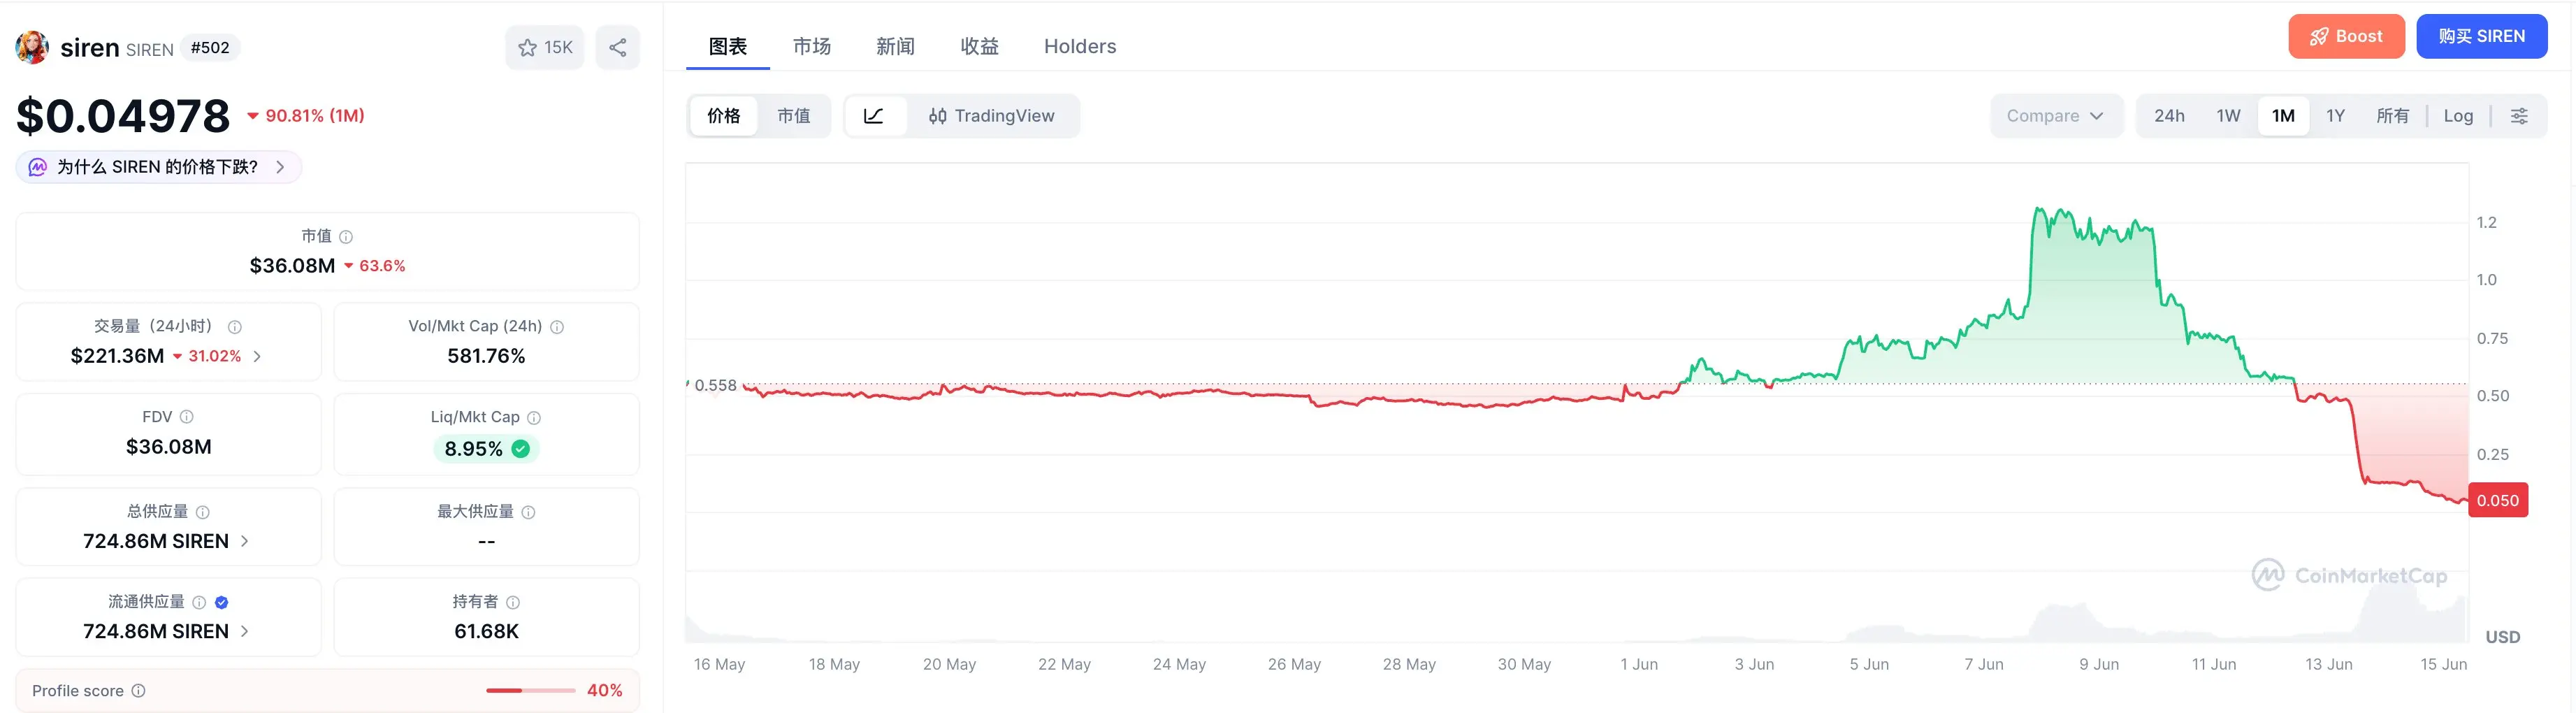 (Source: CoinMarketCap)
Based on historical data confirmed by multiple sources:
Price surge before the sell-off: Before this sell-off, SIREN surged nearly 200% within 10 days, with market cap briefly exceeding $600 million.
Highly concentrated supply: Analysts have repeatedly confirmed that wallets related to SIREN sometimes hold more than 90% of circulating supply; before this sell-off, related addresses held about 82% of circulating supply (Lookonchain data).
Since early 2026: SIREN has repeatedly appeared in BNB Chain’s Meme and AI agent trading community in cycles of sharp price spikes and crashes.
Frequently asked questions
Are the “market manipulators” in EmberCN’s analysis confirmed specific entities?
EmberCN’s analysis is based on on-chain address patterns, identifying “market manipulators” or a whale cluster through coordinated sell behavior. This is an analytical attribution of on-chain data, not a confirmation of identity by law enforcement agencies. Arkham’s on-chain records allow tracking of the relevant addresses’ holdings, but the real identity of the holding entity has not been publicly confirmed.
What does the 24-hour trading volume of $191 million mean relative to SIREN’s market cap?
BeInCrypto Markets confirms SIREN’s market cap is about $94.7 million, while the 24-hour trading volume exceeds $191 million—more than twice the market cap—reflecting extremely speculative churn. Gate, KuCoin, and multiple decentralized exchanges on BNB Chain have extensive trading records.
What confirmed impact does the “divide and conquer” strategy have on on-chain tracking?
According to EmberCN’s analysis, a pattern of small buys across hundreds of addresses increases the difficulty of tracking fund flows, because in-chain correlation analysis is more difficult with a large number of dispersed addresses than with a small number of large addresses. This is EmberCN’s assessment; the actual difficulty of on-chain evidence gathering depends on the capabilities of the analysis tools used (such as Arkham, etc.).