tanwarisb

vip
Age 0.2 Year
Peak Tier 0
No content yet
#RWAMarketCapExceeds65Billion
Current Market Overview: The Historic $65B+ Breakthrough
The Real World Assets (RWA) sector in crypto has officially entered a new financial era in May 2026 after crossing the $65 billion market capitalization milestone, which is widely considered one of the most important structural transitions in modern digital finance. This is not a short-term rally or a speculative spike, but a long-term transformation where traditional financial instruments are gradually being rebuilt on blockchain infrastructure.
What makes this milestone so important is not just the numbe
HighAmbition
#RWAMarketCapExceeds65Billion
Current Market Overview: The Historic $65B+ Breakthrough
The Real World Assets (RWA) sector in crypto has officially entered a new financial era in May 2026 after crossing the $65 billion market capitalization milestone, which is widely considered one of the most important structural transitions in modern digital finance. This is not a short-term rally or a speculative spike, but a long-term transformation where traditional financial instruments are gradually being rebuilt on blockchain infrastructure.
What makes this milestone so important is not just the number itself, but the speed and consistency of growth behind it. The sector has expanded from approximately $5.8B in early 2023, to around $15.2B by the end of 2024, then to nearly $45B by the end of 2025, and now reaching $65B+ in mid-2026. This type of growth reflects a compounding institutional adoption curve rather than retail-driven speculation.
At a broader structural level, analysts estimate that the total real-world asset exposure represented on-chain—including stablecoin liquidity layers, tokenized funds, and indirect financial instruments—has already crossed $300B+ in combined value representation, making RWA one of the fastest-growing intersections between traditional finance and blockchain technology.
This expansion confirms a powerful reality: RWA is no longer a narrative or experimental concept. It is becoming a fully functional financial infrastructure layer that sits between global capital markets and decentralized systems.
Deep Understanding: What Exactly Are Real World Assets (RWA)?
Real World Assets refer to physical, financial, and legally enforceable instruments from traditional markets that are converted into blockchain-based digital tokens through a process known as tokenization.
In simple financial terms, tokenization means converting ownership rights or cash flow rights of real assets into programmable digital units that can move freely across blockchain networks.
These assets include:
Real estate properties and land ownership structures
Gold, silver, and commodity reserves
Government bonds, treasury bills, and corporate debt instruments
Private credit portfolios and lending agreements
Equity shares, index exposure, and fund-based products
Carbon credits, invoices, and supply chain receivables
The transformation is not just technological—it is structural. It changes how ownership is recorded, how value is transferred, and how financial exposure is accessed globally.
How RWA Tokenization Actually Works in Practice
The RWA ecosystem operates through a deeply layered financial architecture that connects traditional finance with blockchain systems.
First, a real-world asset is legally structured under a compliant framework. Then ownership rights or cash-flow rights are divided into digital tokens. These tokens are issued on blockchain networks, where they can be transferred, traded, or used as collateral.
The key mechanisms include:
Fractional ownership allows large-scale assets such as real estate or private credit pools to be divided into small accessible units, making previously inaccessible markets available to global investors.
24/7 trading infrastructure removes traditional market hour limitations, enabling continuous liquidity flow across global time zones.
Instant settlement reduces dependency on slow banking rails and enables near real-time clearing of transactions.
Transparency layers provided by blockchain systems allow verifiable ownership tracking, reducing counterparty uncertainty.
DeFi integration enables tokenized assets to be used in lending protocols, liquidity pools, and structured yield systems.
This combination creates a financial environment where traditional assets become programmable, liquid, and globally accessible.
Institutional Adoption: The Real Engine Behind Growth
One of the most critical forces behind the rapid expansion of the RWA sector is the entry of global institutional capital. Unlike earlier crypto cycles driven mainly by retail speculation, the current RWA growth is driven by regulated financial institutions, asset managers, and banking networks.
Major institutions actively participating include:
BlackRock, which has pioneered tokenized Treasury products and is leading institutional-scale experiments in blockchain-based fund issuance.
Franklin Templeton, which has expanded tokenized money market funds and is actively distributing regulated on-chain investment products.
JPMorgan Chase, which has developed blockchain settlement systems and collateral mobility infrastructure through its Onyx platform.
Goldman Sachs, which is exploring tokenized bonds, structured credit instruments, and digital asset market integration.
Fidelity Investments, which is building digital asset custody and tokenization infrastructure for institutional clients.
The presence of these institutions signals a fundamental shift: blockchain is no longer competing with traditional finance—it is becoming part of it.
Blockchain Market Structure Supporting RWA Growth
The RWA ecosystem is not dominated by a single chain, but rather a multi-chain financial architecture where different networks serve different institutional roles.
Ethereum remains the dominant settlement layer with approximately 33%+ market share, largely due to its deep DeFi integration and institutional-grade security assumptions.
Provenance Blockchain holds a significant share due to its focus on mortgage-backed securities and structured credit products.
XRP Ledger, and Solana collectively support trading, settlement, and high-speed execution layers depending on institutional requirements.
This multi-chain structure reflects a realistic financial system design rather than a single-ecosystem monopoly.
Key Asset Classes Driving RWA Expansion
The growth of RWA is heavily concentrated in several high-value asset categories.
Private credit remains the largest segment, representing a major portion of total RWA value. This includes tokenized loans, structured debt, and syndicated lending markets that were previously accessible only to institutional investors.
Tokenized U.S. Treasuries represent another major growth engine, offering stable yield exposure through blockchain-based fund structures.
Real estate tokenization is expanding as legal frameworks mature, allowing fractional ownership of high-value properties.
Commodity tokenization, especially gold-backed assets, provides a stable store-of-value layer within the blockchain ecosystem.
Emerging categories such as carbon credits, intellectual property rights, and supply chain receivables are gradually expanding the boundaries of what can be tokenized.
Market Growth Dynamics and Long-Term Projections
The RWA sector is currently experiencing exponential growth rather than linear expansion. Over the past two years, the market has grown by more than 200%–300%, driven primarily by institutional inflows and infrastructure maturity.
Short-term projections suggest continued expansion toward $100B+ by the end of 2026, while long-term estimates from financial research institutions project the sector could reach anywhere between $2 trillion to $30 trillion by 2030, depending on adoption rates.
Considering that global real-world asset markets exceed approximately $800 trillion in total value, even a small percentage shift toward tokenization represents massive capital inflows into blockchain systems.
Collateral Mobility: The Most Powerful Innovation
One of the most transformative concepts within RWA is collateral mobility.
In traditional finance, assets often lose productivity when used as collateral because they must be locked, sold, or transferred into restricted systems.
In tokenized systems, the same asset can remain yield-generating while simultaneously being used as collateral for borrowing or liquidity access.
This creates a dual-layer financial system where capital efficiency increases significantly, and liquidity becomes continuously active rather than static.
Global Impact and Emerging Market Opportunities
In emerging regions such as South Asia and other developing economies, RWA introduces access to global financial instruments that were previously difficult to reach.
Investors can gain exposure to USD-based yield products, fractional real estate investments, and global credit markets without traditional banking limitations.
At the same time, cross-border settlement becomes faster and more efficient, reducing friction in international capital flows.
However, regulatory frameworks remain uneven, and compliance structures vary significantly across jurisdictions, making governance a key factor in adoption.
Key Risks and Structural Challenges
Despite strong momentum, the RWA sector still faces several structural risks.
Regulatory uncertainty remains one of the most important challenges, as global frameworks are still evolving.
Liquidity fragmentation across different chains can reduce market efficiency.
Custody, compliance, and legal enforceability require continued institutional-grade development.
Smart contract vulnerabilities also remain a technical risk factor that must be addressed through audits and insurance mechanisms.
Future Outlook: The Next Financial Evolution (2026–2030)
The future of RWA is expected to move toward full-scale integration of global financial systems into blockchain infrastructure.
We are likely to see tokenized real estate markets operating at institutional scale, AI-powered financial structuring systems, automated yield distribution mechanisms, and fully interoperable global settlement networks.
As adoption increases, RWA will likely become one of the largest and most important financial sectors in the world, reshaping how ownership, liquidity, and capital flow operate globally.
Final Conclusion: A Structural Shift in Global Finance
The crossing of the $65B RWA milestone represents a fundamental transformation rather than a temporary market trend.
Financial systems are evolving from slow, fragmented, institution-heavy structures into programmable, liquid, and globally accessible networks powered by blockchain infrastructure.
RWA is effectively bridging the gap between traditional finance and decentralized systems, creating a unified financial layer where real-world value and digital liquidity coexist.
The long-term implication is clear: this is not a cycle, but a deep structural evolution that will continue shaping global markets for decades to come.

repost-content-media
  • Reward
  • Comment
  • Repost
  • Share
#GateSquarePizzaDay
🍕 The Most Expensive Meal in Human History
On May 22, 2010, a moment occurred in digital history that nobody fully understood at the time, yet it later became one of the most iconic financial stories ever recorded in human civilization, when a programmer named Laszlo Hanyecz posted on the BitcoinTalk forum offering 10,000 BTC in exchange for two large Papa John’s pizzas, simply to test whether Bitcoin could function as real money in the physical world.
At that time, Bitcoin had almost no recognized market value, no institutional adoption, and almost zero liquidity in tr
BTC-0.48%
HighAmbition
#GateSquarePizzaDay
🍕 The Most Expensive Meal in Human History
On May 22, 2010, a moment occurred in digital history that nobody fully understood at the time, yet it later became one of the most iconic financial stories ever recorded in human civilization, when a programmer named Laszlo Hanyecz posted on the BitcoinTalk forum offering 10,000 BTC in exchange for two large Papa John’s pizzas, simply to test whether Bitcoin could function as real money in the physical world.
At that time, Bitcoin had almost no recognized market value, no institutional adoption, and almost zero liquidity in traditional financial terms, meaning those 10,000 BTC were worth approximately $41 only, and the transaction was completed without hesitation, marking the first real-world commercial Bitcoin purchase in history, which later became known globally as “Bitcoin Pizza Day,” symbolizing the beginning of practical cryptocurrency utility beyond theory and experimentation.
Fast Forward to May 2026, the entire meaning of that transaction has transformed beyond imagination, as Bitcoin now trades at approximately $76,880 per BTC, making those same 10,000 BTC worth around $768,800,000+ (over 768 million USD), turning a simple pizza purchase into what is widely recognized as the most expensive meal ever consumed in human history.
And if we expand the full historical context, Laszlo reportedly spent over 80,000 BTC on pizza-related transactions during 2010, which at today’s valuation exceeds $6 billion USD, creating a legendary example of early adoption, technological experimentation, and long-term opportunity cost that continues to be discussed across global financial communities.
This story is not just about pizza, and it is not just about Bitcoin value appreciation; it represents a complete transformation in how digital assets evolve from experimental concepts into trillion-dollar macroeconomic instruments that now influence global finance, institutional investment strategies, ETF markets, sovereign adoption trends, and corporate treasury management systems.
The key lessons from Bitcoin Pizza Day remain extremely powerful even today:
Early adoption matters more than short-term understanding, because technologies that appear meaningless at inception often become foundational pillars of global systems in the future, and those who recognize value before mass awareness often experience exponential outcomes that redefine financial history.
Volatility is not a flaw but a feature of emerging assets, because Bitcoin’s journey from $0.004 per BTC to nearly $77,000 per BTC demonstrates extreme price discovery phases driven by adoption cycles, liquidity expansion, macroeconomic conditions, and global trust evolution.
Utility is the true driver of long-term value, because Bitcoin transitioned from a simple peer-to-peer experiment into a global settlement asset, store of value, ETF-backed instrument, and even a treasury reserve asset for corporations and institutions worldwide.
And most importantly, never underestimate future technological evolution, because what seems insignificant or speculative today can become a core pillar of tomorrow’s financial architecture when adoption, infrastructure, and global recognition align.
Today Bitcoin is no longer just a digital experiment; it has become a global macro asset class integrated into ETFs, institutional portfolios, cross-border payment systems, and even geopolitical financial strategies, while continuing to evolve alongside blockchain innovation, Layer-2 scaling solutions, and increasing real-world integration.
To the entire Gate Square community, this day is more than just a celebration; it is a reflection of how far the crypto ecosystem has come, and a reminder of how early belief, conviction, and patience can transform outcomes on a global scale.
Happy Bitcoin Pizza Day 🍕
Happy Gate Square Community Celebration 🔥
repost-content-media
  • Reward
  • Comment
  • Repost
  • Share
#Polymarket每日热点
📢 Gate Square | Polymarket Prediction Discussion — SpaceX IPO Timing (SPCX)
The latest Polymarket event under #PolymarketDailyHotTopic is centered around one of the most historic and highly anticipated financial events in modern markets, the potential SpaceX Initial Public Offering, reportedly targeting a massive valuation range of $1.75 trillion to $2 trillion, with the expected Nasdaq ticker “SPCX” and a highly debated earliest listing window around June 12, 2026, depending on SEC approval, market conditions, and final IPO structuring decisions.
According to current market
HighAmbition
#Polymarket每日热点
📢 Gate Square | Polymarket Prediction Discussion — SpaceX IPO Timing (SPCX)
The latest Polymarket event under #PolymarketDailyHotTopic is centered around one of the most historic and highly anticipated financial events in modern markets, the potential SpaceX Initial Public Offering, reportedly targeting a massive valuation range of $1.75 trillion to $2 trillion, with the expected Nasdaq ticker “SPCX” and a highly debated earliest listing window around June 12, 2026, depending on SEC approval, market conditions, and final IPO structuring decisions.
According to current market reports and investor sentiment, SpaceX is accelerating its IPO roadmap as institutional demand continues to strengthen, driven by explosive growth in Starlink satellite internet adoption, rising global defense contracts, expanding NASA partnerships, and long-term expectations around Starship commercialization, all of which are contributing to extremely aggressive forward valuation models that position SpaceX as one of the most valuable potential public listings in history.
📊 Event Core Details
Event: SpaceX IPO Timing Prediction
Expected Ticker: SPCX
Valuation Range: $1.75T – $2T
Expected Capital Raise: $75B – $80B
Earliest Possible Window: Around June 12, 2026
Exchange: Nasdaq
Main Drivers: Institutional demand, liquidity conditions, SEC approval process, macro market stability
📈 Market Interpretation and Key Growth Drivers The market excitement around this IPO is being driven by multiple powerful long-term narratives including Starlink’s rapid global expansion into millions of users, continuous revenue scaling from satellite broadband services, increasing government and military contracts, and long-term expectations that Starship will drastically reduce orbital launch costs while enabling large-scale space infrastructure development, deep space missions, and global connectivity expansion.
Investor sentiment remains highly divided, where bullish participants view SpaceX as a generational infrastructure asset comparable to the largest technological revolutions in history, while cautious analysts highlight that a $2 trillion valuation requires extremely high execution consistency over decades, making the IPO heavily dependent on future performance rather than current fundamentals.
📉 IPO Timing Probability Analysis From a structural market perspective, the most likely timing scenarios are:
Aggressive Scenario: Mid June 2026 (June 12–June 20) if SEC approval, roadshow, and pricing align smoothly
Moderate Scenario: July – September 2026 if valuation negotiations or market volatility delay execution
Delayed Scenario: Late 2026 or beyond if macro conditions weaken or regulatory review extends
Historically, mega-IPOs depend more on institutional book-building strength, liquidity conditions, and pricing stability rather than internal readiness alone, which makes timing uncertain despite strong public speculation.
💡 Personal View and Market Analysis In my opinion, the June 12, 2026 date is a highly symbolic and aggressive target that reflects strong market optimism, however the more realistic expectation is that SpaceX may prioritize valuation stability and institutional pricing strength, which could shift the listing slightly into late June or even Q3 2026 if volatility increases.
However, if institutional demand remains extremely strong and oversubscription levels are high, then an early June listing remains a realistic scenario, especially under favorable macro liquidity conditions and successful SEC progression.
🚀 Final Outlook The SpaceX IPO is not just a market listing event, it represents a structural transformation in global capital markets where space infrastructure, satellite internet, AI integration, and deep space logistics are converging into a single trillion-dollar ecosystem, reshaping how investors value next-generation technology companies at a global scale.
As anticipation builds, traders and investors are closely monitoring every regulatory update, liquidity shift, and institutional signal, making this one of the most important prediction events of 2026 across both traditional finance and emerging digital markets.
📌 Join the discussion, share your prediction, and submit your trading view using #PolymarketDailyHotTopic — market sentiment may play a key role in shaping the final IPO timeline outcome.
repost-content-media
  • Reward
  • Comment
  • Repost
  • Share
#BitMineAdds71KEther
The #BitMineAdds71KEther event has become one of the strongest institutional Ethereum accumulation developments of the current crypto market cycle where BitMine Immersion Technologies (BMNR), under the leadership of Wall Street strategist Tom Lee, expanded its Ethereum treasury reserves through a massive acquisition of more than 71,000 ETH within a single week, creating a powerful signal that large financial entities are increasingly treating Ethereum as a strategic infrastructure asset instead of only a speculative cryptocurrency.
This development reflects a much larger
HighAmbition
#BitMineAdds71KEther
The #BitMineAdds71KEther event has become one of the strongest institutional Ethereum accumulation developments of the current crypto market cycle where BitMine Immersion Technologies (BMNR), under the leadership of Wall Street strategist Tom Lee, expanded its Ethereum treasury reserves through a massive acquisition of more than 71,000 ETH within a single week, creating a powerful signal that large financial entities are increasingly treating Ethereum as a strategic infrastructure asset instead of only a speculative cryptocurrency.
This development reflects a much larger transformation taking place across global financial markets where blockchain infrastructure, staking systems, decentralized finance, tokenized assets, and AI-integrated financial ecosystems are gradually becoming integrated into traditional institutional finance structures, positioning Ethereum at the center of the future digital settlement economy.
Ethereum is increasingly being viewed as: • A global settlement layer for tokenized assets and institutional transactions.
• A yield-generating blockchain infrastructure through staking participation.
• A core decentralized finance ecosystem supporting liquidity and smart contracts.
• A long-term institutional reserve asset accumulated by treasury-focused companies.
As institutional treasury firms continue removing ETH from exchanges and shifting holdings into staking infrastructure, Ethereum’s market structure is evolving toward a long-duration supply compression model where liquid market supply gradually becomes tighter over time.
BitMine Immersion Technologies — Institutional Ethereum Treasury Expansion
BitMine Immersion Technologies has rapidly emerged as one of the strongest institutional Ethereum treasury companies globally, supported by major digital asset investors and capital allocators connected with firms such as ARK-linked exposure, Founders Fund, Pantera Capital, Galaxy Digital, DCG, and several crypto-focused institutional groups increasing long-term Ethereum participation.
The company’s strategy revolves around an aggressive accumulation framework often referred to as the “Alchemy of 5%” model where BitMine aims to control nearly 5% of Ethereum’s total circulating supply over the long term.
With Ethereum circulating supply estimated near 120 million ETH, this target implies accumulation exceeding 6 million ETH over time, positioning BitMine among the dominant institutional entities influencing Ethereum liquidity, staking participation, and long-term valuation behavior.
71K ETH Acquisition — Institutional Market Impact
The recent acquisition of approximately 71,000–71,500 ETH valued between $150 million and $170 million represents one of the fastest accumulation phases completed by BitMine during the current cycle.
Following this expansion: • Total ETH treasury holdings advanced toward nearly 5 million ETH.
• Institutional ownership moved beyond 4% of Ethereum circulating supply.
• Treasury accumulation speed increased significantly.
• Staking participation expanded further.
• Exchange-based liquid ETH supply continued tightening.
This aggressive accumulation behavior creates direct pressure on Ethereum’s available liquidity because a large portion of purchased ETH does not return to active trading circulation and instead becomes locked inside treasury reserves and validator infrastructure.
As institutional participants continue staking large quantities of ETH while reducing exchange supply availability, even moderate market demand increases can trigger stronger upward price expansion because thinner supply conditions create more sensitive market reactions.
Ethereum Current Market Structure and Price Environment
Ethereum is currently trading near $2,127 while volatility remains elevated due to institutional accumulation, ETF participation, staking growth, and macro liquidity positioning.
Current Trading Price: $2,127 represents the active institutional accumulation region where treasury firms continue expanding exposure while markets remain positioned between consolidation and potential breakout conditions.
Short-Term Consolidation Range: $1,950 – $2,450 remains the primary active trading range where buyers and sellers continue competing for directional control while institutional accumulation gradually absorbs available exchange liquidity.
Primary Support Zone: $2,000 remains one of the most important structural support levels because institutional buyers continue defending this region during temporary market weakness.
Secondary Support Region: $1,920 – $1,850 acts as a deeper demand area where long-term investors may continue accumulating additional ETH exposure during volatility phases.
Major Defensive Support: $1,700 – $1,750 represents a broader macro support region where long-duration treasury participants may aggressively increase accumulation if deeper corrections appear.
Immediate Resistance Zone: $2,300 – $2,450 remains the first major resistance barrier where traders continue monitoring breakout confirmation signals.
Intermediate Breakout Region: $2,600 – $2,800 represents a critical momentum expansion area where a confirmed breakout could trigger stronger institutional and ETF-driven buying activity.
Bullish Expansion Targets: $3,000 – $3,500 could become achievable if ETF inflows strengthen while institutional treasury accumulation continues reducing available market supply.
Mid-Cycle Institutional Targets: $4,000 – $5,500 represent broader expansion projections supported by continued staking growth, declining exchange reserves, and accelerating institutional participation.
Strong Bullish Supply Compression Scenario: $6,000 – $8,500 could emerge if Ethereum experiences a full institutional supply squeeze phase driven by aggressive treasury accumulation and expanding ETF demand.
Extended Macro Expansion Scenario: $10,000+ remains possible within a long-duration macro cycle if Ethereum becomes a dominant infrastructure layer for tokenized financial systems and institutional blockchain settlements.
MAVAN Validator Network — Institutional Staking Infrastructure
BitMine’s Ethereum strategy is heavily supported by the MAVAN (Made in America Validator Network) ecosystem, which functions as a large-scale validator and staking infrastructure designed to convert treasury-held ETH into yield-generating assets.
Estimated operational metrics include: • More than 3.3 million ETH actively staked.
• Estimated staking valuation exceeding $7.7 billion.
• Staking participation ratio near 67%.
• Estimated annual staking yield between 2.8% and 3.2%.
• Potential yearly revenue generation ranging between $220 million and $330 million.
This structure creates a powerful treasury reinforcement system where Ethereum holdings continuously generate yield while simultaneously remaining locked inside staking infrastructure instead of re-entering exchange circulation.
Institutional Supply Compression and Liquidity Reduction
Ethereum markets are increasingly experiencing institutional supply compression where treasury companies, ETF-related structures, validators, and staking entities continue removing ETH from active exchange liquidity.
Major institutional accumulation drivers include: • Treasury reserve expansion strategies.
• ETF-related Ethereum exposure growth.
• Institutional validator participation.
• Long-duration staking lock mechanisms.
• Declining exchange reserve balances.
As liquid exchange supply continues decreasing while institutional demand expands, Ethereum’s price elasticity may strengthen significantly because thinner liquidity conditions often create larger directional market movements during accumulation phases.
Ethereum Price Forecast Scenarios
Conservative Institutional Scenario: $2,000 – $3,200 remains achievable if institutional accumulation continues gradually while ETF participation grows at a moderate pace.
Balanced Expansion Scenario: $3,500 – $5,500 becomes increasingly realistic if treasury firms continue aggressive accumulation while validator participation expands steadily.
Strong Bullish Institutional Scenario: $6,000 – $8,500 could develop if Ethereum experiences a large-scale supply compression phase supported by staking growth, ETF inflows, and improved global liquidity conditions.
Extreme Institutional Expansion Scenario: $10,000+ may emerge over longer macro cycles if Ethereum evolves into a dominant settlement infrastructure for tokenized traditional financial assets.
Ethereum Trading Strategy Outlook
Accumulation Strategy
The $2,000 – $2,200 region continues functioning as a strategic long-term accumulation area where institutional entities are gradually expanding exposure ahead of possible future supply shortages created by staking lockups and treasury reserve growth.
Breakout Strategy
A confirmed breakout above $2,600 – $2,800 could trigger accelerated momentum expansion toward: $3,200
$3,500
$4,000
$4,500
Such a breakout scenario would likely require strong ETF inflows, expanding institutional accumulation, and continued reduction in available exchange supply.
Risk Management Strategy
Key downside monitoring zones currently remain: $1,950
$1,850
$1,700
Although temporary volatility remains possible during global liquidity tightening phases, long-term institutional adoption trends continue supporting Ethereum’s broader structural positioning.
Final Outlook — Ethereum’s Institutional Evolution
The #BitMineAdds71KEther development represents far more than a treasury acquisition because it highlights Ethereum’s accelerating transformation into a globally institutionalized yield-generating financial infrastructure asset supported by treasury firms, validators, ETF systems, staking participation, and blockchain-based settlement expansion.
With Ethereum currently trading near $2,127, markets appear positioned near a major structural inflection point where institutional treasury expansion, staking growth, ETF participation, and declining exchange supply could shape the direction of Ethereum’s next multi-year cycle.
If institutional accumulation continues accelerating while staking infrastructure locks additional ETH away from exchanges, Ethereum could potentially experience a powerful long-duration supply compression phase capable of driving expansion toward: $5,000
$6,500
$8,500
$10,000+
BitMine’s aggressive treasury strategy demonstrates growing institutional conviction that Ethereum is increasingly becoming one of the foundational digital settlement infrastructures of the future global financial system.
repost-content-media
  • Reward
  • Comment
  • Repost
  • Share
#CLARITYActPassesSenateCommittee
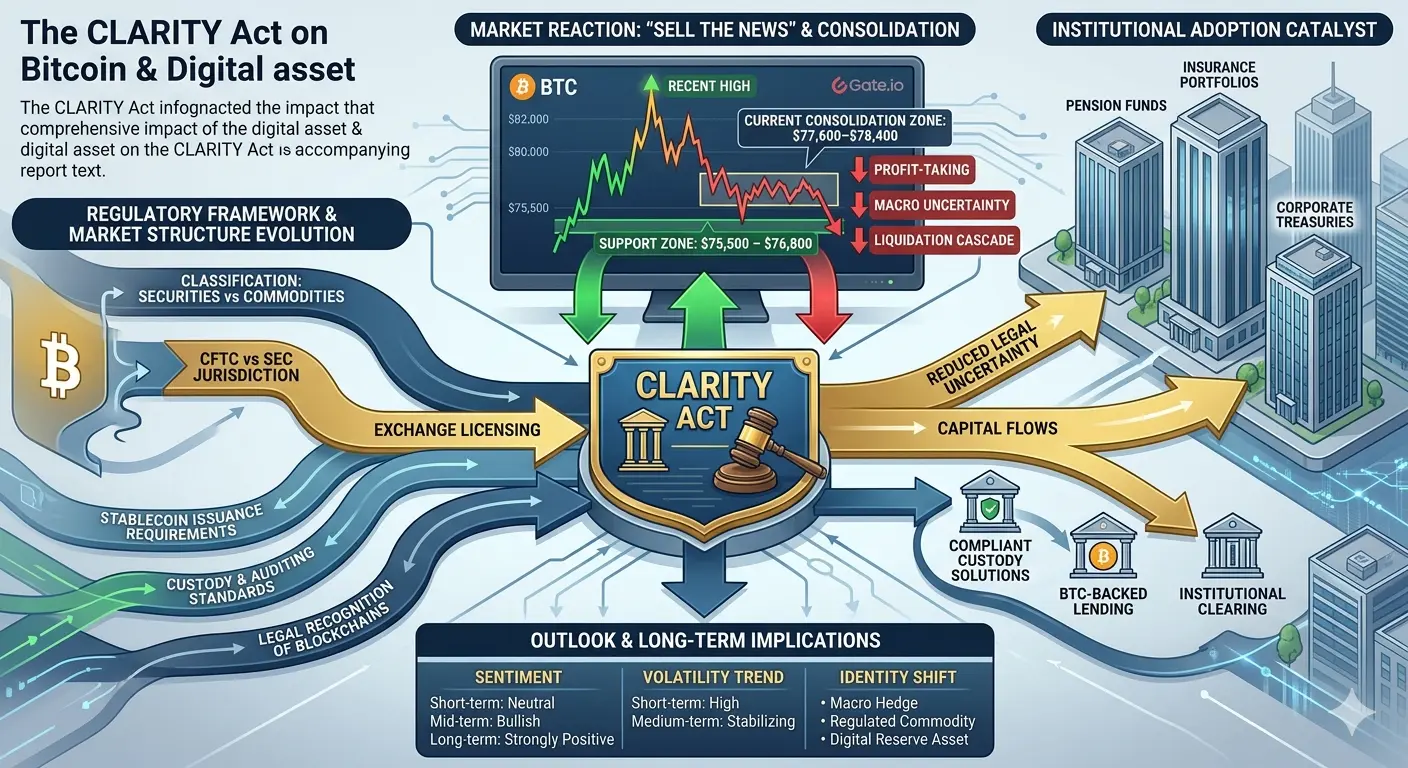
The CLARITY Act, recently advanced through the U.S. Senate Banking Committee with a bipartisan 15–9 vote, marks a historic shift in U.S. digital asset regulation. While the development is fundamentally bullish for long-term crypto adoption, Bitcoin experienced a short-term correction due to profit-taking, macro uncertainty, and “sell the news” dynamics.
Bitcoin is currently trading on Gate.io around $77,600–$78,400, after recently testing highs near $81,000–$82,000, reflecting a controlled consolidation phase rather than structural weakness.
CLARITY Act Overvi
BTC-0.48%
HighAmbition
#CLARITYActPassesSenateCommittee
The CLARITY Act, recently advanced through the U.S. Senate Banking Committee with a bipartisan 15–9 vote, marks a historic shift in U.S. digital asset regulation. While the development is fundamentally bullish for long-term crypto adoption, Bitcoin experienced a short-term correction due to profit-taking, macro uncertainty, and “sell the news” dynamics.
Bitcoin is currently trading on Gate.io around $77,600–$78,400, after recently testing highs near $81,000–$82,000, reflecting a controlled consolidation phase rather than structural weakness.
CLARITY Act Overview
The CLARITY Act (Digital Asset Market Clarity Act) is designed to establish a full legal framework for crypto markets in the United States, removing long-standing ambiguity that has restricted institutional participation.
Key Features:
Classification of digital assets into securities and commodities
Defined jurisdiction split between CFTC (commodities) and SEC (securities)
Regulatory licensing framework for crypto exchanges
Stablecoin issuance and reserve requirements
Custody, auditing, and reporting standards for institutions
Legal recognition of compliant blockchain-based financial systems
Market Support & Opposition:
Supporters: Coinbase, Circle, Ripple, a16z, and policy-aligned regulators
Opponents: 일부 banking groups and labor organizations concerned about systemic risk and consumer protection
This creates a foundational regulatory bridge between traditional finance and digital asset ecosystems.
Market Reaction: Why Bitcoin Dropped Despite Positive News
1. Sell the News Dynamics
Bitcoin had already priced in regulatory optimism:
Rally phase pushed price toward $81K–$82K resistance zone
News confirmation triggered profit realization
Short-term correction followed toward $77K–$78K range
This is a standard behavior in mature financial markets.
2. Resistance Zone Pressure
Strong sell orders concentrated near $80K psychological level
Short-term traders exited leveraged positions
Liquidity pockets triggered rapid downside wicks
3. Macro Environment Influence
Rising U.S. Treasury yields increased opportunity cost of holding risk assets
Dollar strength created additional pressure on crypto liquidity
Equity market softness contributed to correlated risk-off sentiment
4. Liquidation Cascade
Over-leveraged long positions were flushed out
Futures market imbalance amplified downward momentum
Spot markets stabilized after leverage reset
5. Regulatory Timeline Uncertainty
Even with Senate progress:
Full Senate vote still pending
House approval required
Final presidential signing uncertain
Markets continuously discount time risk, not just outcome.
Bitcoin Price Structure & Market Behavior
Current Range Dynamics
Support Zone: $75,500 – $76,800
Mid Range: $77,000 – $79,000
Resistance: $80,500 – $82,500
Bitcoin is currently consolidating inside a broad high-volatility range after a strong multi-week rally.
Scenario-Based Outlook
Bullish Scenario:
Break above $82,500 resistance
Potential move toward $85K–$88K
Extended momentum could push toward $90K+
Neutral Scenario:
Range-bound movement between $76K–$81K
Market digestion of regulatory headlines
Bearish Scenario:
Breakdown below $75K support
Possible retest of $72K–$70K liquidity zone
Institutional Adoption Catalyst
Regulatory Clarity Unlocks Capital Flows
The Act significantly reduces legal uncertainty, enabling:
Pension funds to evaluate Bitcoin exposure
Insurance portfolios to consider allocation
Corporate treasuries to revisit balance sheet diversification
Previously, regulatory ambiguity was the biggest barrier—not volatility.
Banking System Integration
Traditional finance integration accelerates through:
Federally compliant custody solutions
Bitcoin-backed lending systems
Institutional clearing and settlement infrastructure
This reduces friction between fiat and crypto ecosystems.
Market Structure Evolution
Bitcoin is transitioning into a hybrid asset class:
Structural Improvements:
Increased institutional participation stabilizes liquidity
ETF-driven flows reduce retail-driven volatility spikes
Stronger correlation with macro liquidity cycles
Identity Shift:
Bitcoin evolves further into:
A macro hedge asset
A regulated commodity instrument
A global liquidity-sensitive digital reserve asset
Volatility Analysis
Short-Term Volatility (High)
Volatility remains elevated due to:
Legislative milestones
Macro liquidity shifts
Leverage-driven derivatives positioning
Price swings between $77K–$82K reflect this instability.
Medium-Term Stabilization
As regulatory clarity improves:
Tail-risk events decline
Institutional models normalize Bitcoin exposure
Liquidity depth increases significantly
This leads to smoother price discovery over time.
Structural Volatility Outlook
Baseline volatility decreases gradually
Event-driven spikes remain possible
Institutional flows reduce random micro volatility
Bitcoin becomes less chaotic but not low-volatility.
Institutional Strategy Response
Phase 1: Legal & Compliance Evaluation
Institutions begin reassessing:
Custody providers
Exchange compliance status
Internal allocation mandates
This phase is slow but foundational.
Phase 2: Gradual Allocation Deployment
Likely capital flows into:
Bitcoin ETFs
Direct custody solutions
Hedge fund exposure increases
Corporate treasury pilot allocations
Early adopters lead the transition.
Phase 3: Infrastructure Expansion
Demand increases for:
Regulated prime brokers
Institutional lending platforms
Settlement networks
Derivatives clearing systems
This creates long-term ecosystem expansion.
Risk Framework Evolution
Institutional models now adjust:
Lower regulatory risk premium
Improved risk-adjusted returns for Bitcoin
Enhanced portfolio diversification models
However, full-scale adoption remains gradual due to governance cycles.
Market Sentiment Outlook
Short-Term Sentiment:
Neutral to slightly volatile
Driven by news digestion and liquidity shifts
Mid-Term Sentiment:
Bullish structural bias
Institutional accumulation expected on dips
Long-Term Sentiment:
Strongly positive if legislation fully passes
Bitcoin increasingly seen as institutional-grade macro asset
Conclusion
The CLARITY Act represents a structural turning point for Bitcoin and the broader crypto ecosystem. While short-term price action reflects profit-taking and uncertainty, the long-term implications are decisively constructive.
Bitcoin’s movement from $82K highs to the $77K–$78K consolidation zone reflects healthy market digestion rather than trend reversal.
Over time, the Act is expected to:
Expand institutional participation
Reduce regulatory uncertainty
Strengthen infrastructure development
Improve market efficiency and liquidity depth
Bitcoin is transitioning from a speculative asset into a globally integrated financial instrument, with increasing stability, deeper liquidity, and stronger institutional participation shaping its next phase of growth.
repost-content-media
  • Reward
  • Comment
  • Repost
  • Share
#GateSquareMayTradingShare
Bitcoin (BTC) Market Analysis
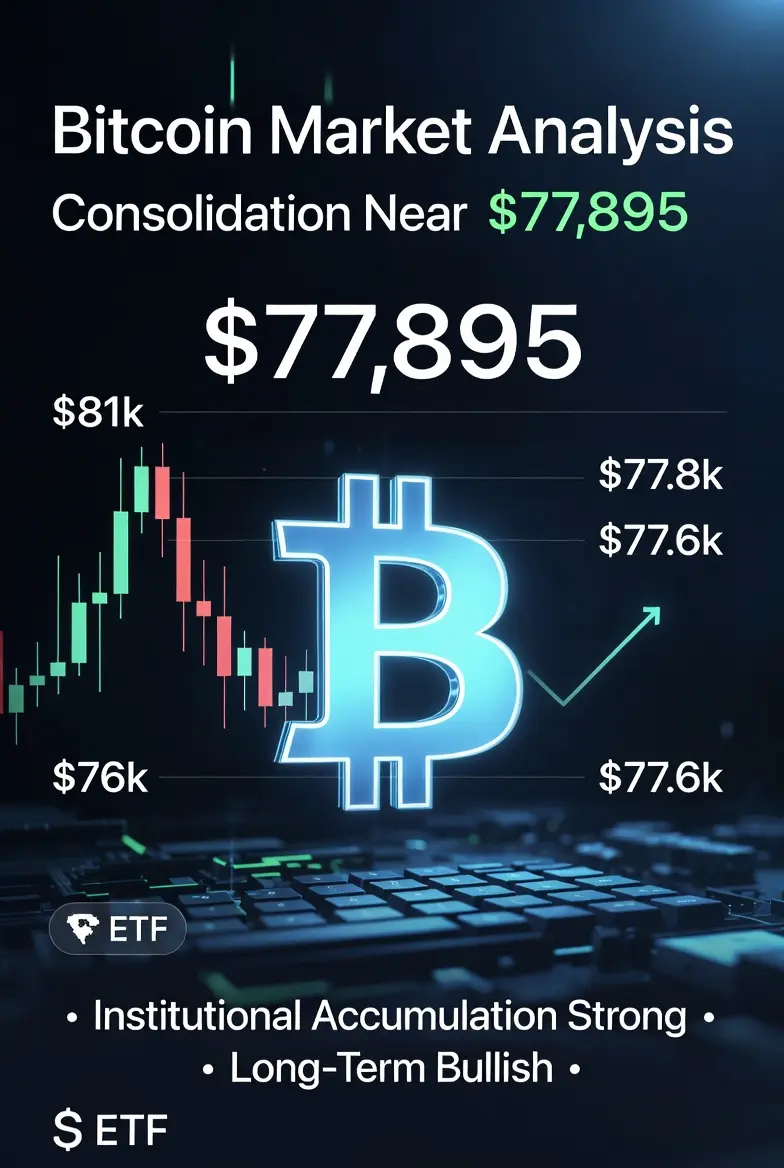
Bitcoin is currently trading near $77,895 after facing strong rejection from the $81,000 resistance zone. The market has entered a volatile consolidation phase, but the broader structure remains constructive as institutional participation and ETF-driven demand continue to support long-term momentum.
Recent price action reflects a liquidity reset and leverage reduction phase, which often occurs during strong bullish cycles. Despite short-term pressure, Bitcoin continues to hold key structural support levels, indicating that overall mark
BTC-0.48%
HighAmbition
#GateSquareMayTradingShare
Bitcoin (BTC) Market Analysis
Bitcoin is currently trading near $77,895 after facing strong rejection from the $81,000 resistance zone. The market has entered a volatile consolidation phase, but the broader structure remains constructive as institutional participation and ETF-driven demand continue to support long-term momentum.
Recent price action reflects a liquidity reset and leverage reduction phase, which often occurs during strong bullish cycles. Despite short-term pressure, Bitcoin continues to hold key structural support levels, indicating that overall market conditions remain stable.
Market Structure & Key Levels
Bitcoin is currently defending the $77,600 support zone, with traders closely watching $76,000 as the most important short-term support level.
Support Levels: $77,600 → $76,000 → $74,500
Resistance Levels: $79,200 → $81,200 → $84,000 → $85,000
A breakout above $79,200 could restore bullish momentum and open the path toward higher resistance zones. However, a breakdown below $76,000 may extend corrective pressure toward lower support areas.
Technical Overview
Technical indicators suggest a market in temporary compression:
RSI near oversold territory (~29) on lower timeframes suggests potential recovery conditions
Price is trading near lower volatility bands, indicating possible exhaustion of selling pressure
ADX above 50 reflects strong trend potential, meaning volatility expansion may follow soon
Overall, the structure suggests short-term consolidation within a broader bullish trend.
Market Fundamentals
Bitcoin’s market capitalization remains near $1.585 trillion, supported by steadily decreasing exchange supply and increasing long-term holdings.
Key drivers include:
Continued institutional accumulation through ETFs
Corporate treasury holdings remaining strong
Sovereign and fund-level exposure increasing gradually
Reduced circulating liquidity on exchanges
Large institutional participants continue adjusting exposure, reflecting long-term positioning rather than exit behavior.
Derivatives & Market Positioning
The derivatives market shows a significant reduction in excessive leverage, improving overall stability.
Open interest remains elevated but more balanced
Funding conditions are relatively neutral
Excessive leveraged positioning has been reduced after recent volatility
This type of reset often leads to healthier price action in the medium term.
Sentiment & Macro Environment
Market sentiment remains cautiously positive, with social indicators showing steady optimism without extreme euphoria.
Macro factors continue to influence price movement:
Elevated global interest rates
Strong US dollar conditions
Inflation expectations and economic data releases
Geopolitical uncertainty supporting alternative store-of-value demand
Despite short-term pressure, Bitcoin continues to gain attention as a digital macro asset within global financial systems.
Risk Outlook
Key risks to monitor:
Breakdown below $76,000 support zone
Increased macroeconomic volatility
Sudden liquidity shifts in derivatives markets
At the same time, structural support remains
strong due to:
Institutional accumulation
ETF inflows
Long-term supply reduction trend
Trading Strategy Overview
Accumulation Zone:
$76,000 – $77,600 range for gradual positioning with risk control
Breakout Scenario:
Above $79,200 → bullish continuation toward $81,200 and higher levels
Risk Management:
Avoid over-leveraged positions during volatility
Focus on confirmed support/resistance reactions
Final Summary
Bitcoin remains in a healthy consolidation phase after a strong volatility event, with price stabilizing above critical support levels. While short-term uncertainty persists, the broader market structure continues to favor a long-term bullish outlook driven by institutional adoption, ETF demand, and supply tightening.
The coming sessions will be important for confirming whether Bitcoin continues its upward expansion or remains within a consolidation range.
repost-content-media
  • Reward
  • Comment
  • Repost
  • Share
#DailyPolymarketHotspot
Ethereum (ETH) Market Analysis + Polymarket Sentiment Report (May 2026)
Ethereum (ETH) is currently trading near $2,176, and the market is sitting at a critical equilibrium zone where both bullish accumulation and short-term corrective pressure are competing. On Polymarket, ETH-related prediction markets are actively pricing macro liquidity conditions, ETF flows, network growth, and Bitcoin correlation dynamics.
This phase reflects a balanced but highly reactive market structure, where sentiment can shift quickly based on macro news or crypto-specific developments.
E
ETH-1.27%
BTC-0.48%
HighAmbition
#DailyPolymarketHotspot
Ethereum (ETH) Market Analysis + Polymarket Sentiment Report (May 2026)
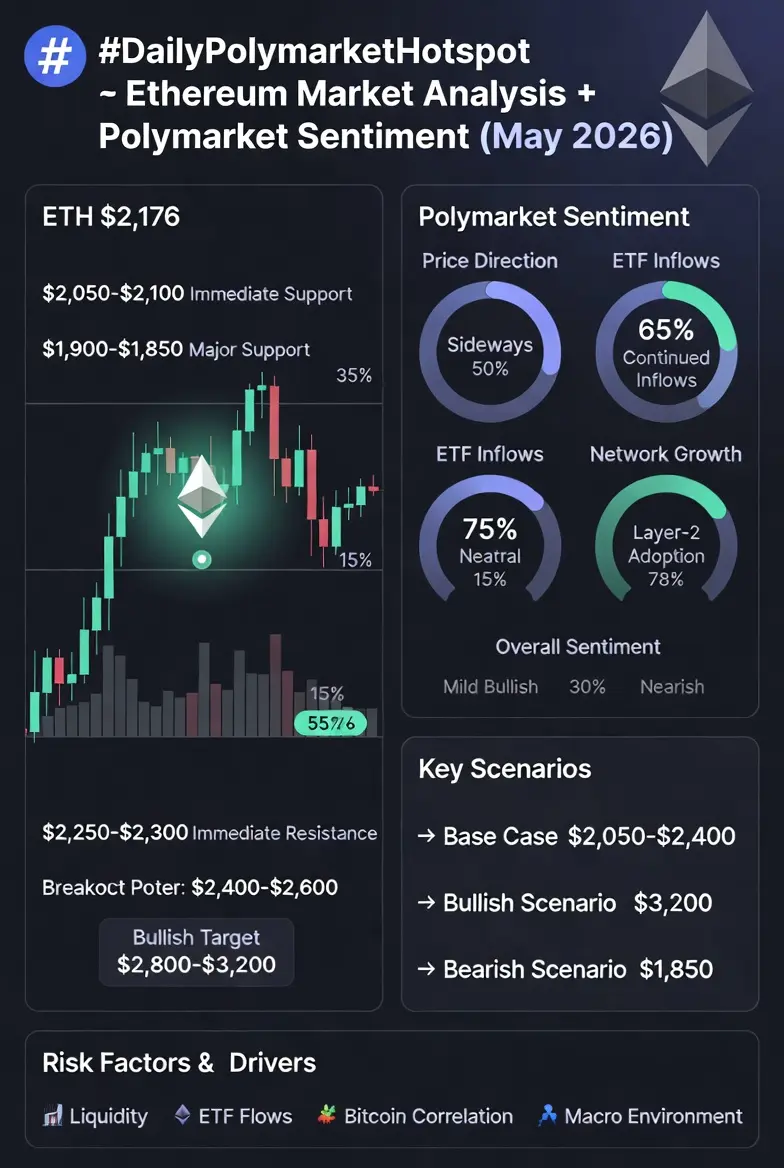
Ethereum (ETH) is currently trading near $2,176, and the market is sitting at a critical equilibrium zone where both bullish accumulation and short-term corrective pressure are competing. On Polymarket, ETH-related prediction markets are actively pricing macro liquidity conditions, ETF flows, network growth, and Bitcoin correlation dynamics.
This phase reflects a balanced but highly reactive market structure, where sentiment can shift quickly based on macro news or crypto-specific developments.
ETH Current Market Position ($2,176 Zone)
Ethereum is currently trading in a mid-range consolidation structure after a strong multi-phase volatility cycle.
Key technical price zones:
Immediate support: $2,050 – $2,100
Major support: $1,900 – $1,850
Immediate resistance: $2,250 – $2,300
Strong breakout resistance: $2,400 – $2,600
Extended bullish expansion zone: $2,800 – $3,200
Market interpretation: ETH is not in a breakdown phase, but in a liquidity accumulation range where both sides are waiting for confirmation.
Polymarket ETH Sentiment Structure
Polymarket traders are currently pricing Ethereum across three major dimensions:
1. ETH Price Direction Markets
ETH price prediction contracts are focused on medium-term movement expectations:
Current probability distribution (market-implied sentiment):
Sideways consolidation (range-bound): 45%–55%
Bullish breakout scenario: 30%–40%
Bearish correction continuation: 15%–25%
Interpretation: Market is leaning slightly bullish, but not aggressively positioned.
2. ETF Flow & Institutional Demand Markets
One of the strongest drivers of ETH sentiment is institutional ETF exposure.
Current Polymarket pricing:
Continued ETH ETF inflows: 60%–70% probability
Neutral inflow/outflow balance: 20%–30%
Sustained outflow pressure: 10%–20%
Insight: ETH is increasingly behaving like a macro ETF-linked digital asset, where traditional finance flows directly influence price direction.
3. Ethereum Network Growth & Adoption Bets
Ethereum’s long-term value is heavily tied to ecosystem expansion.
Market expectations:
Layer-2 adoption growth continuation: 70%–85%
Stable network upgrade performance: 80%+
DeFi ecosystem expansion phase: 50%–65%
High gas fee pressure return risk: 25%–35%
Interpretation: Traders view Ethereum as a technology infrastructure asset, not just a speculative token.
ETH Volatility Behavior on Polymarket
Ethereum-related prediction markets show moderate-to-high volatility sensitivity compared to Bitcoin.
Typical reaction ranges:
Normal news flow → 3%–7% odds movement
ETF or macro updates → 8%–15% movement
Major crypto market shocks → 15%–25%+ repricing
Key triggers:
Bitcoin directional movement
US macroeconomic data (inflation, interest rates)
ETF inflow/outflow reports
Layer-2 ecosystem developments
ETH behaves as a beta-sensitive macro asset with tech-driven catalysts.
Macro Environment Impact on ETH
Ethereum pricing is strongly influenced by global liquidity conditions.
Key macro drivers:
US interest rate expectations
Dollar liquidity cycles
Risk-on vs risk-off sentiment shifts
Institutional portfolio rebalancing
Market behavior:
Liquidity expansion → ETH outperforms
Liquidity tightening → ETH underperforms BTC
Uncertainty phases → ETH trades in consolidation range
Market Sentiment Overview
Current ETH sentiment on Polymarket is:
Mild bullish bias: ~55%
⚪ Neutral positioning: ~30%
Bearish hedge positioning: ~15%
Interpretation: There is no extreme fear or euphoria — the market is in a controlled accumulation mindset.
Risk Factors Being Priced
Polymarket traders are actively monitoring several downside risks:
Bitcoin dominance increase (ETH underperformance risk)
ETF inflow slowdown
Macro tightening conditions (higher yields / stronger dollar)
Layer-2 fragmentation concerns
DeFi liquidity stagnation
Key concern: ETH upside depends heavily on liquidity expansion + institutional continuation flow.
Forward Outlook — Next ETH Phase Scenarios
Base Case (Most Likely):
Sideways range between $2,050 – $2,400
Gradual accumulation phase
Controlled volatility expansion
Bullish Scenario:
Break above $2,400 resistance
Expansion toward $2,800 – $3,200 zone
ETF inflows accelerate + Bitcoin support stable
Bearish Scenario:
Breakdown below $2,050
Retest $1,900 – $1,850 zone
Macro tightening + BTC weakness drag effect
Final Summary
Ethereum at $2,176 is currently in a balanced but highly sensitive market phase, where neither bulls nor bears have full control.
On Polymarket, ETH is being priced as:
A macro liquidity asset
A technology infrastructure network
A Bitcoin-correlated but independently driven market
Core takeaway:
ETH is not trending aggressively — it is building structure for its next major expansion move.
Simple market logic:
Liquidity = direction
ETF flows = momentum
Bitcoin = correlation anchor
Ecosystem growth = long-term valuation driver
repost-content-media
  • Reward
  • Comment
  • Repost
  • Share
#BitcoinVShapedReversalBack
Bitcoin V-Shaped Reversal Analysis
What is a V-Shaped Reversal?
A V-shaped reversal is one of the most powerful technical chart structures in financial markets. It occurs when an asset experiences a sharp and fast decline, followed by an equally sharp and aggressive recovery, forming a clear “V” shape on the price chart.
This pattern typically indicates:
Strong demand absorption at lower price levels
Aggressive buying from institutional and smart money participants
Short squeeze and forced liquidation of bearish positions
Rapid sentiment shift from fear to opportu
BTC-0.48%
HighAmbition
#BitcoinVShapedReversalBack
Bitcoin V-Shaped Reversal Analysis
What is a V-Shaped Reversal?
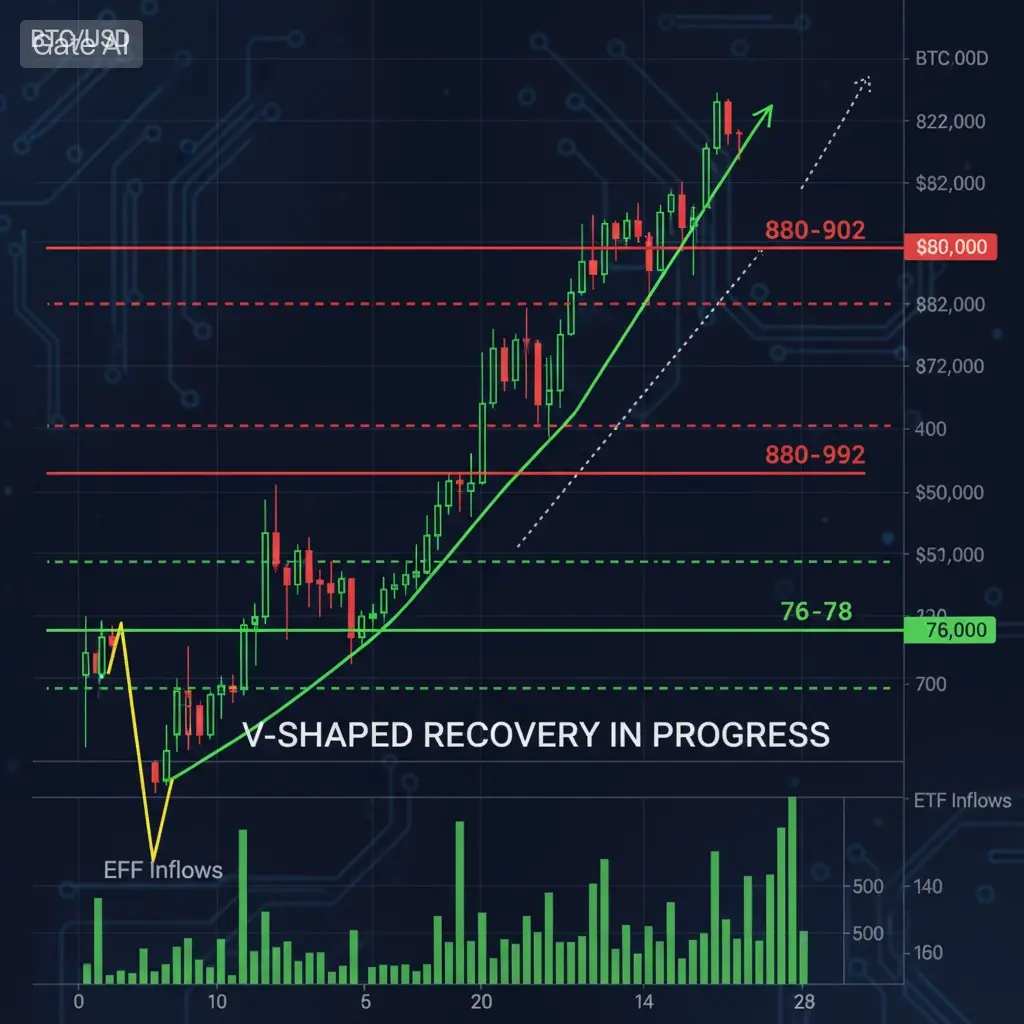
A V-shaped reversal is one of the most powerful technical chart structures in financial markets. It occurs when an asset experiences a sharp and fast decline, followed by an equally sharp and aggressive recovery, forming a clear “V” shape on the price chart.
This pattern typically indicates:
Strong demand absorption at lower price levels
Aggressive buying from institutional and smart money participants
Short squeeze and forced liquidation of bearish positions
Rapid sentiment shift from fear to opportunistic accumulation
Unlike other reversal patterns, a V-shape shows very little consolidation at the bottom, meaning buyers step in immediately without allowing extended sideways movement.
In Bitcoin’s case, this structure is currently being closely monitored as market volatility increases.
Current Bitcoin Market Context (May 2026)
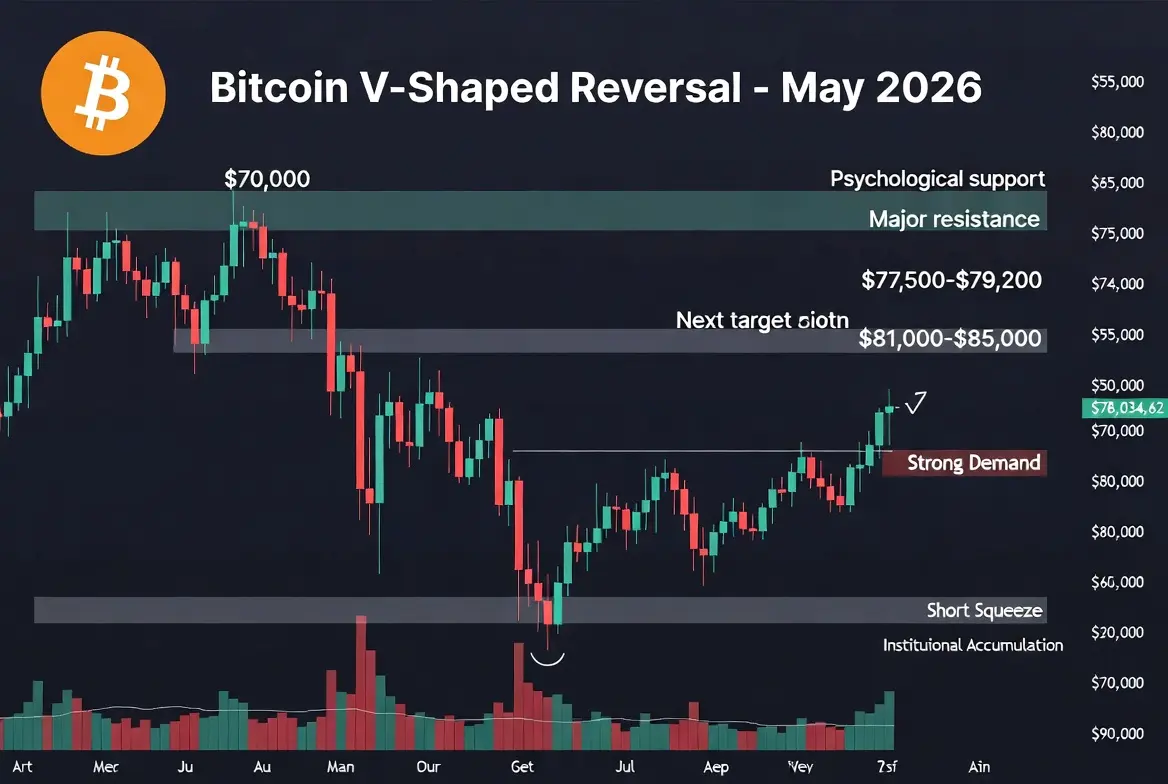
Bitcoin is currently trading near $78,034, reflecting a consolidation phase after recent volatility.
Price Action Overview:
Current Price: $78,034.62
24h Change: -1.32%
24h High: $79,188.7
24h Low: $77,656.7
Market Cap: $1.54 Trillion
The market is currently stabilizing after sharp swings between $77,000 and $79,000, indicating active liquidity battles between buyers and sellers.
Technical Indicators (7-Day Multi-Timeframe View)
Daily (1D) Timeframe:
Moving Averages: Bullish alignment
RSI: Neutral zone (balanced momentum)
ADX: 34.12 (moderate trend strength)
Interpretation: Long-term structure remains supportive despite short-term volatility.
4-Hour Timeframe:
MA Alignment: Bearish pressure present
CCI: -105.6 (oversold conditions)
Williams %R: -88.8 (deep oversold zone)
Interpretation: Short-term market is technically oversold, suggesting potential relief bounce conditions.
Hourly Timeframe:
MA Alignment: Neutral
ADX: 50.3 (strong directional movement)
CCI: -144.6 (extreme oversold reading)
Interpretation: Market is in a high-volatility compression phase, often seen before strong directional moves.
Key Discussion Points on Bitcoin’s V-Shaped Recovery
1. Critical Resistance Levels
Bitcoin’s recovery structure is currently being tested against major resistance zones.
Key Levels:
$70,000 → Psychological confirmation zone
$74,000 → Major resistance / previous support flip
$77,500 – $79,200 → Current consolidation band
$81,000 – $85,000 → Next macro resistance cluster
Interpretation:
$70K acts as structural confirmation level
$74K is the main breakout barrier for V-shape validation
Above $79K, momentum expansion becomes significantly stronger
Failure to hold below $70,000 would weaken the V-shaped recovery structure.
2. Macro Factors Influencing the Pattern
Several macroeconomic conditions are shaping Bitcoin’s current structure:
Global inflation concerns linked to energy prices
Middle East geopolitical tensions increasing safe-haven demand
Federal Reserve policy uncertainty ahead of key meetings
Exchange reserves declining to multi-year lows
Institutional accumulation continuing during dips
Interpretation: Macro conditions are creating a mixed environment of risk pressure and long-term accumulation support.
3. Community Sentiment and Trader Psychology
Market participants are actively debating whether Bitcoin is forming a true V-shaped recovery or a temporary bounce.
Current sentiment themes:
Dip buyers accumulating between $70,000 – $75,000
Aggressive traders expecting continuation toward $81,000+
Bearish traders waiting for rejection at $74,000 resistance
Common trader view:
“Buy the dip until invalidation”
“Breakout above $74K confirms trend continuation”
“Failure below $70K signals deeper correction risk”
Interpretation: Sentiment is split but leaning cautiously bullish.
4. Risk Factors and Market Uncertainty
Despite bullish V-shape expectations, risks remain active:
Federal Reserve maintaining restrictive policy stance
Inflation spikes reducing liquidity appetite
Resistance rejection near $74,000–$75,000 zone
Liquidity traps creating fake breakout structures
Higher timeframe bearish divergence signals
Key Risk Scenario: If Bitcoin fails to reclaim $74,000, the move may turn into a liquidity grab instead of a full reversal.
5. Trading Strategy Outlook (Next Market Plan)
Bullish Scenario Strategy:
If Bitcoin holds above $70,000 and breaks $74,000:
Momentum target: $77,000 → $81,000 → $85,000
Strong breakout above $81K may open expansion toward new cycle highs
Traders may consider trend-following entries after confirmation
Bearish Scenario Strategy:
If Bitcoin fails to hold $70,000:
First downside target: $68,000
Extended correction zone: $65,000 – $66,000
Deep invalidation level: below $65,000
Interpretation: This would invalidate the clean V-shaped structure.
Accumulation Strategy (Smart Money Approach):
Gradual buying between $70K – $74K zone
Avoid heavy leverage during volatility spikes
Scale positions instead of full exposure
Wait for breakout confirmation above resistance zones
6. Volume and Confirmation Logic
A true V-shaped reversal requires:
Declining volume during the drop
Rising volume during recovery
Strong breakout above resistance
No prolonged consolidation at the bottom
Interpretation: Volume behavior is the final confirmation factor for validating the pattern.
Summary
Bitcoin is currently showing early-stage characteristics of a V-shaped recovery structure, with price stabilizing around $78,000 after sharp volatility between $77,000–$79,000.
The structure is still not fully confirmed, but key conditions are developing:
Strong support near $70,000
Major resistance at $74,000
Expansion potential above $81,000 – $85,000
Final Market Logic:
Above $74K → bullish continuation likely
Below $70K → recovery structure weakens
Between range → consolidation and volatility
Bitcoin is currently in a decision zone, where the next breakout will determine whether this becomes a full V-shaped reversal or a prolonged consolidation phase.
repost-content-media
  • Reward
  • Comment
  • Repost
  • Share
#TrumpVisitsChina
The official visit of U.S. President to China from May 13–15, 2026, became one of the most important financial and geopolitical events of the year as global investors, crypto traders, institutions, hedge funds, and commodity markets closely monitored the meetings between Trump and Chinese President in Beijing. Financial markets entered the summit with very high expectations because traders believed the discussions could improve trade relations, stabilize global markets, increase energy cooperation, and reduce tensions between the world’s two biggest economies.
The summit h
BTC-0.48%
XAUUSD0.99%
HighAmbition
#TrumpVisitsChina
The official visit of U.S. President to China from May 13–15, 2026, became one of the most important financial and geopolitical events of the year as global investors, crypto traders, institutions, hedge funds, and commodity markets closely monitored the meetings between Trump and Chinese President in Beijing. Financial markets entered the summit with very high expectations because traders believed the discussions could improve trade relations, stabilize global markets, increase energy cooperation, and reduce tensions between the world’s two biggest economies.
The summit happened during a difficult economic environment where inflation remained high, interest rates stayed elevated, oil markets faced supply risks because of Middle East tensions, and global investors were already worried about volatility linked to the Strait of Hormuz and slowing economic growth across major economies.
Before the summit started, investors aggressively entered Bitcoin, technology stocks, oil futures, and commodity markets because expectations were rising that Trump and Xi could announce stronger trade agreements, technology cooperation, and expanded economic partnerships. However, after the meetings ended without major breakthrough agreements, markets quickly shifted toward profit-taking and defensive positioning, creating strong volatility across cryptocurrencies, commodities, and global equities.
Bitcoin (BTC) Market Reaction and Crypto Volatility
Bitcoin became one of the most closely watched assets during the Trump–China summit because traders expected that better diplomatic relations between the United States and China could indirectly support institutional crypto adoption and improve global market confidence.
Before the summit, Bitcoin traded between approximately $80,500 and $82,300 while bullish traders targeted higher resistance zones near $84,000, $85,500, and $88,000 if positive announcements emerged from Beijing. Optimism increased after reports confirmed that several major technology executives joined Trump’s delegation, which investors viewed as a positive sign for future technology cooperation and AI-related infrastructure growth.
During the summit, Bitcoin initially remained stable around $81,000, but volatility expanded quickly as traders waited for official announcements related to trade policy and technology agreements. After the summit concluded without meaningful crypto-related developments, sentiment weakened and Bitcoin declined toward the $77,200–$79,300 range before stabilizing near $78,900.
The correction triggered heavy liquidations across leveraged futures markets, with approximately $550 million–$620 million worth of long positions removed within a short period. Traders described the movement as a classic “buy the rumor, sell the news” reaction where expectations became too optimistic before the event and were later reset after the final outcomes disappointed markets.
Despite short-term weakness, analysts believe Bitcoin’s broader long-term structure remains stable because ETF inflows, institutional accumulation, and long-term adoption trends continue supporting the market. Many traders now expect Bitcoin to fluctuate between $75,000 and $85,000 in the near term, while a breakout above $88,000 could reopen momentum toward $90,000 and higher levels if global tensions ease.
Oil Market Reaction and Energy Developments
The oil market experienced major volatility throughout the Trump–China meetings because investors remained concerned about Middle East tensions and supply risks connected to the Strait of Hormuz, which handles a significant portion of global oil transportation.
Before the summit, Brent crude traded between $106 and $108.50 per barrel, while WTI crude fluctuated near $104.80–$107.20 per barrel because geopolitical uncertainty and supply concerns continued supporting elevated prices.
During the summit, oil prices briefly moved lower toward $106 per barrel because traders expected diplomatic progress that could calm global tensions. However, sentiment changed after Trump announced that China plans to increase purchases of U.S. crude oil from Texas, Louisiana, and Alaska.
The announcement created a bullish reaction in energy markets, pushing Brent crude toward $109–$110 per barrel while WTI approached $108.50 per barrel during intraday trading. Investors interpreted the development as a possible revival of U.S.–China energy cooperation after years of trade restrictions and tariff disputes.
Even after prices stabilized, oil remained highly volatile between $101 and $110 per barrel, while analysts warned that any escalation involving Iran or disruptions around the Strait of Hormuz could quickly push Brent crude toward $115 or higher levels.
Gold Market Performance and Safe-Haven Demand
Gold remained one of the strongest safe-haven assets during the summit because investors continued searching for protection against inflation uncertainty, geopolitical risks, and market volatility.
Before the meetings, gold traded between $4,680 and $4,720 per ounce as Middle East tensions and inflation concerns supported strong demand. During the summit, gold prices remained relatively stable near $4,690–$4,715 per ounce, while futures contracts traded close to $4,725 per ounce.
Inflation data showed U.S. CPI remaining near 3.8%–4.0%, while producer prices continued rising, creating uncertainty for financial markets and limiting stronger upside momentum in gold.
Federal Reserve policy expectations also influenced gold prices because persistent inflation reduced the possibility of rapid interest rate cuts, keeping pressure on non-yielding assets. However, analysts still believe gold could remain structurally strong above $4,600, while a move above $4,750–$4,800 could open the path toward the psychological $5,000 level if geopolitical tensions intensify further.
Global Stock Market Reaction
Global stock markets reacted negatively after the Trump–China summit because investors expected larger breakthroughs in trade agreements and technology cooperation. Once those expectations failed to materialize, institutional investors reduced exposure to high-risk sectors.
The Dow Jones declined approximately 0.80%–0.95%, the S&P 500 fell around 0.90%–1.10%, and the Nasdaq dropped nearly 1.20%–1.60% as technology and semiconductor companies faced renewed uncertainty regarding exports and future China-related business growth.
Total market capitalization losses exceeded approximately $1.1 trillion during the post-summit selloff, showing how strongly investors repositioned after the event outcomes disappointed financial markets.
Final Market Outlook
Following the Trump–China summit, global financial markets entered a new phase of volatility where investors remain highly sensitive to geopolitical developments, inflation data, energy security risks, and central bank policy decisions. Bitcoin continues trading inside a macro-driven environment, oil remains reactive to Middle East developments, gold continues acting as a safe-haven asset, and global equities remain vulnerable to disappointment surrounding trade and technology negotiations.
The summit demonstrated that financial markets are increasingly influenced by expectations, liquidity conditions, and geopolitical narratives, meaning future diplomatic meetings between the United States and China will likely continue creating major volatility across cryptocurrencies, commodities, and stock markets.
repost-content-media
  • Reward
  • Comment
  • Repost
  • Share
#JaneStreetReducesBitcoinETFHoldings
Jane Street’s Bitcoin ETF Holdings Reduction:
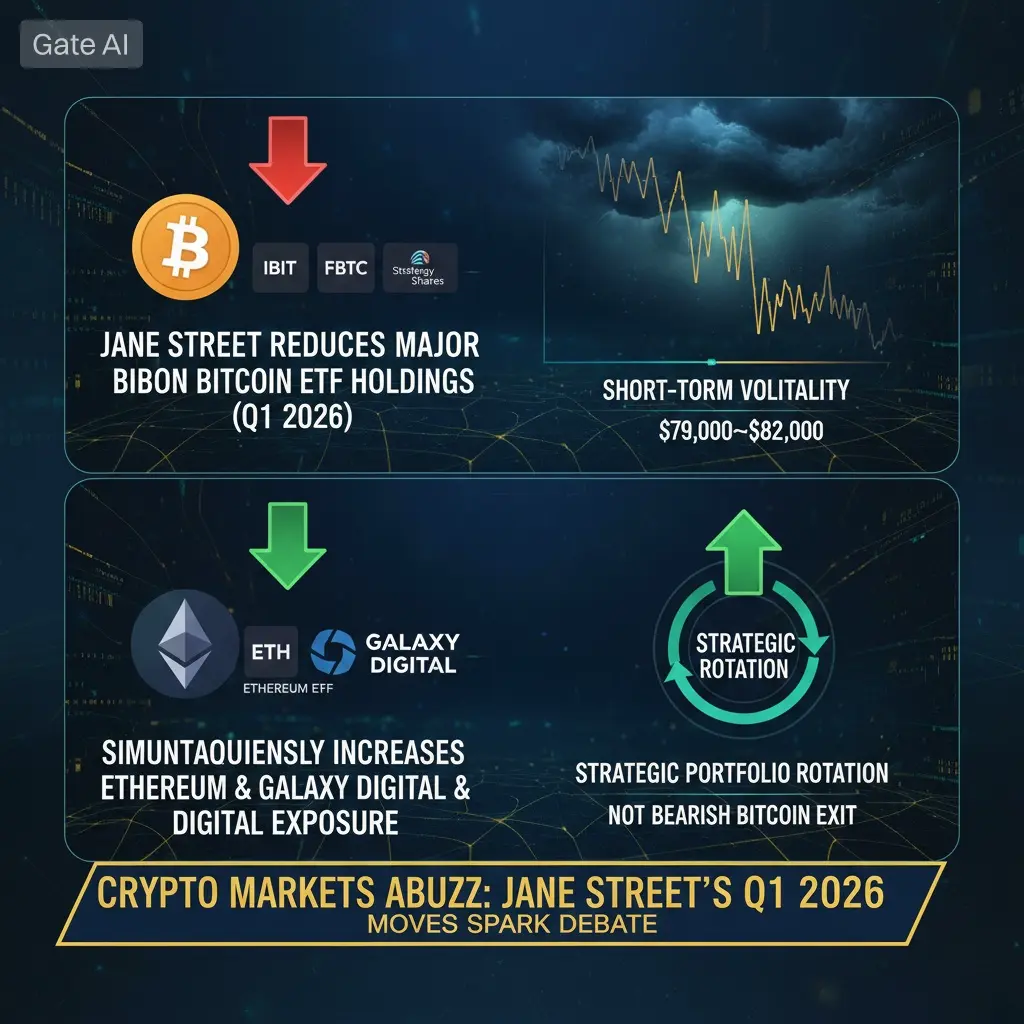
Global financial markets and cryptocurrency traders closely analyzed the latest SEC 13F filings from after the company significantly reduced its exposure to several major Bitcoin-related investment products during Q1 2026. The filings revealed large reductions in positions connected to spot Bitcoin ETFs and crypto-linked equities, creating immediate discussion across institutional trading desks, hedge funds, crypto exchanges, and social media platforms.
The biggest reductions included exposure to Bitcoin ETF
HighAmbition
#JaneStreetReducesBitcoinETFHoldings
Jane Street’s Bitcoin ETF Holdings Reduction:
Global financial markets and cryptocurrency traders closely analyzed the latest SEC 13F filings from after the company significantly reduced its exposure to several major Bitcoin-related investment products during Q1 2026. The filings revealed large reductions in positions connected to spot Bitcoin ETFs and crypto-linked equities, creating immediate discussion across institutional trading desks, hedge funds, crypto exchanges, and social media platforms.
The biggest reductions included exposure to Bitcoin ETF products, Fidelity Bitcoin funds, and Strategy stock holdings. At the same time, Jane Street increased exposure toward Ethereum ETFs and crypto-related equity investments, which quickly triggered speculation regarding institutional sentiment toward Bitcoin and the broader digital asset market.
Despite the strong headlines, many analysts explained that the situation is more complex than a simple bearish signal because Jane Street primarily operates as a market-making and liquidity-providing firm rather than a traditional long-term investment institution. Understanding the difference between directional investing and market-making activity became extremely important after the filings were released.
Breakdown of Jane Street’s Bitcoin ETF Reductions
According to the latest regulatory filings, Jane Street significantly reduced exposure across several major Bitcoin-linked products during Q1 2026.
The company reduced its holdings in iShares Bitcoin Trust (IBIT) by approximately 71%, lowering the position from nearly 20 million shares to approximately 5.9 million shares. Even after the reduction, the remaining position was still valued near $225 million based on market prices during the reporting period.
Jane Street also reduced exposure to Fidelity’s FBTC Bitcoin ETF by roughly 60%, decreasing holdings toward approximately 2 million shares with a remaining market value near $115 million.
Another major reduction involved stock holdings, where Jane Street reportedly lowered exposure by approximately 78%, reducing the stake from nearly 968,000 shares to around 210,000 shares during the quarter.
These portfolio adjustments immediately created bearish discussion across crypto markets because many traders interpreted the filings as a sign that large institutions were reducing confidence in Bitcoin near the $80,000–$82,000 price region.
However, deeper analysis showed that the situation was far more strategic and technical than social media reactions initially suggested.
Ethereum Rotation and Portfolio Reallocation
While reducing Bitcoin-linked exposure, Jane Street simultaneously increased investments across Ethereum ETFs and crypto-related equities, suggesting a tactical portfolio rotation rather than a complete exit from digital assets.
The company reportedly added approximately $82 million into Ethereum ETF products while significantly increasing exposure to iShares Ethereum Trust (ETHA) and Fidelity Ethereum Fund (FETH).
At the same time, Jane Street aggressively increased holdings in , boosting exposure from approximately 17,000 shares to nearly 1.5 million shares. The market value of that position expanded from roughly $380,000 to nearly $28 million during the reporting period.
This rotation created an important narrative across financial markets because it suggested that institutional capital was not abandoning crypto exposure entirely but was instead reallocating toward different segments of the digital asset ecosystem.
Many analysts believe Ethereum benefited from rising institutional interest connected to staking infrastructure, tokenization growth, decentralized finance development, and expanding blockchain utility across financial markets.
Why 13F Filings Can Be Misleading
One of the most important aspects of this story involves understanding how 13F filings work and why they often fail to show the complete institutional picture.
Jane Street operates primarily as a market maker and liquidity provider. Unlike traditional long-term investors, market makers continuously rebalance positions, hedge exposure, and exploit price inefficiencies across multiple markets simultaneously.
SEC 13F filings only display long equity positions held at the end of a quarter. The filings do not reveal:
• Short positions
• Futures hedges
• Options exposure
• Delta-neutral trades
• Arbitrage strategies
• Temporary liquidity positions
Because of this limitation, the reported reduction in Bitcoin ETF exposure may not represent a true bearish position on Bitcoin itself.
For example, market makers often buy spot ETFs while simultaneously shorting Bitcoin futures contracts to capture spreads between markets. The 13F filing only shows the ETF holdings side of the strategy while hiding the hedging structure operating behind the scenes.
This means Jane Street’s actual net exposure to Bitcoin could remain partially neutral even after the reported reductions.
Several institutional analysts explained that the filings likely reflected:
• Portfolio rebalancing
• Risk management adjustments
• Capital efficiency optimization
• Tactical exposure rotation
• Hedging modifications during volatile conditions
rather than a direct prediction that Bitcoin prices would collapse.
Bitcoin Price Reaction and Market Sentiment
Despite the dramatic headlines, Bitcoin showed relatively strong resilience after the filings became public.
During the reporting period, Bitcoin continued trading above the major psychological support range between $78,000 and $80,000 while maintaining broader macro bullish structure conditions. Spot Bitcoin prices fluctuated between approximately $79,500 and $82,500 during several sessions following the news release.
Short-term volatility increased because social media traders interpreted the filings as institutional bearishness, leading to temporary selling pressure and increased liquidation activity across leveraged futures positions.
However, broader ETF market data continued showing strong institutional participation.
Analysts highlighted that spot Bitcoin ETFs still recorded approximately $2.4 billion–$2.5 billion in net inflows during April 2026, demonstrating that institutional demand across the broader market remained strong despite Jane Street’s internal adjustments.
This divergence became extremely important because it showed that one firm’s portfolio rebalancing should not automatically be viewed as a complete institutional market trend.
Some traders even argued that reducing concentrated ETF exposure could create healthier long-term price action by lowering excessive leverage and reducing dependency on a small number of dominant institutional positions.
Institutional Market Structure and Crypto Maturity
The situation surrounding Jane Street also highlighted how cryptocurrency markets continue evolving toward more mature institutional structures.
In traditional financial markets, large market-making firms constantly rebalance positions across equities, derivatives, commodities, and foreign exchange products. These adjustments rarely create panic because institutional investors understand that liquidity providers continuously optimize exposure according to volatility, spreads, and market conditions.
However, crypto markets still remain highly sensitive to institutional headlines because digital assets operate within a more emotionally reactive trading environment.
The outsized reaction to Jane Street’s filings demonstrated how quickly crypto sentiment can shift based on regulatory documents and institutional activity, even when the underlying market impact remains relatively limited.
At the same time, growing participation from firms such as , Fidelity, and other institutional asset managers continues strengthening the legitimacy and structural depth of the cryptocurrency ecosystem.
Bitcoin Trading Strategy and Market Outlook
From a trading perspective, Bitcoin continues operating inside a broad macro consolidation structure where institutional flows, ETF demand, and macroeconomic conditions remain the primary drivers of momentum.
Traders currently view the $75,000–$77,000 region as a major support zone where institutional buyers could aggressively defend price structure if volatility increases further. Holding above this range may allow Bitcoin to stabilize and attempt another movement toward the $84,000–$86,000 resistance area.
If Bitcoin successfully breaks above $88,000 with strong volume and ETF inflows, momentum could expand toward the psychological $90,000 and $95,000 resistance levels during the coming months.
However, if macroeconomic conditions weaken significantly or institutional selling pressure accelerates across broader markets, Bitcoin could revisit deeper support levels near $72,000–$74,000 before rebuilding momentum again.
Trading Strategy Plans
• Conservative traders may wait for confirmation above $84,000 before entering larger swing positions.
• Short-term traders may focus on volatility ranges between $78,000 and $82,000 while maintaining disciplined stop-loss management.
• Long-term investors continue monitoring ETF inflows, Federal Reserve policy direction, and institutional accumulation trends rather than reacting emotionally to individual 13F filings.
• Risk management remains extremely important because crypto markets continue experiencing rapid sentiment-driven movements during institutional news cycles.
Final Market Outlook
Jane Street’s Bitcoin ETF reductions created major headlines across crypto markets, but deeper analysis suggests the situation reflects sophisticated institutional portfolio management rather than a complete loss of confidence in Bitcoin itself.
The simultaneous increase in Ethereum ETF exposure and crypto-equity investments indicates that institutional capital continues flowing into the broader digital asset ecosystem, even while portfolio allocations shift between sectors.
Bitcoin remains structurally supported by institutional adoption, ETF demand, long-term accumulation trends, and growing integration with traditional financial markets. While short-term volatility surrounding institutional filings will likely continue influencing sentiment, broader market conditions still suggest that cryptocurrencies remain an increasingly important part of the global financial system.
The overall market reaction demonstrated once again that modern crypto markets are heavily driven by expectations, narratives, institutional positioning, and liquidity conditions, meaning future regulatory filings and institutional portfolio adjustments will likely continue generating strong volatility across Bitcoin and the broader digital asset sector.
repost-content-media
  • Reward
  • Comment
  • Repost
  • Share
#TradFi交易分享挑战
#TradFi交易分享挑战
#Australian Dollar (AUDUSD)
AUDUSD is currently trading near 0.71455, maintaining a structurally bullish but highly sensitive condition within global TradFi forex markets. The pair continues to reflect the ongoing interaction between United States monetary policy expectations and Australia’s commodity-driven economic framework. Market participants including banks, hedge funds, and CFD traders are closely monitoring this pair due to its strong responsiveness to macroeconomic data, liquidity shifts, and global risk sentiment changes.
The broader 2026 macro environme
AUDUSD-0.25%
HighAmbition
#TradFi交易分享挑战
#TradFi交易分享挑战
#Australian Dollar (AUDUSD)
AUDUSD is currently trading near 0.71455, maintaining a structurally bullish but highly sensitive condition within global TradFi forex markets. The pair continues to reflect the ongoing interaction between United States monetary policy expectations and Australia’s commodity-driven economic framework. Market participants including banks, hedge funds, and CFD traders are closely monitoring this pair due to its strong responsiveness to macroeconomic data, liquidity shifts, and global risk sentiment changes.
The broader 2026 macro environment remains mixed. Inflation levels in major economies are still relatively elevated, central banks are maintaining cautious policy stances, and global growth is uneven across regions. In this environment, AUDUSD is acting as a key sentiment indicator, reacting quickly to changes in investor confidence and liquidity expectations.
At current levels, price is holding above the critical psychological zone near 0.71000, while buyers are attempting to maintain upward structure toward higher resistance regions. However, volatility remains elevated, meaning both continuation and corrective scenarios must be considered.
Understanding AUDUSD in Simple TradFi Terms
AUDUSD shows how many US dollars are required to purchase one Australian dollar.
• If AUDUSD rises → Australian dollar strengthens
• If AUDUSD falls → US dollar strengthens
The Australian dollar is a risk-linked commodity currency, meaning it tends to perform well when global growth improves and commodity demand increases.
The US dollar acts as a global safe-haven currency, strengthening during uncertainty, tighter financial conditions, or risk-off sentiment.
This structural contrast makes AUDUSD highly reactive compared to many other forex pairs.
Current Market Structure
AUDUSD is trading near 0.71455 and showing recovery from previous consolidation phases, forming a controlled bullish structure.
Key Resistance Zones
• 0.71800 – short-term resistance
• 0.72250 – breakout trigger zone
• 0.73000 – institutional resistance area
• 0.74200 – expansion target zone
• 0.75000 – psychological extension
A sustained break above 0.72250 may trigger stronger upside momentum.
Key Support Zones
• 0.71000 – immediate support
• 0.70800 – structure defense zone
• 0.70000 – major psychological level
• 0.69200 – deeper correction area
• 0.68450 – long-term structural support
Maintaining price above 0.70000 remains essential for bullish continuity.
Fundamental Drivers Behind AUDUSD
1. United States Dollar Factors
The US dollar remains influenced by Federal Reserve policy and macro data.
Key conditions: • Interest rates remain elevated
• Inflation still moderately persistent
• Treasury yields relatively strong
• Labor market showing mixed signals
This keeps USD supported but sensitive to any policy shift expectations.
2. Australian Dollar Factors
AUD is driven by global trade and commodity cycles.
Supporting elements: • Strong iron ore and gold exports
• Energy exports remain stable
• China demand expectations improving
• Risk sentiment stabilization
• Relatively steady policy stance
Australia’s export dependence makes AUD highly sensitive to global growth conditions.
3. China Impact
China remains the most important external driver for AUD.
• Strong China activity → AUD strength
• Weak China activity → AUD pressure
Current expectations of gradual industrial stabilization are supporting AUD bias.
4. Global Risk Sentiment
AUDUSD reacts strongly to risk conditions.
• Risk-on → AUD strengthens
• Risk-off → USD strengthens
This makes the pair highly volatile during global uncertainty phases.
Technical Structure Overview
AUDUSD remains in a controlled bullish phase with moderate momentum strength.
Trend conditions: • Short-term: Bullish
• Medium-term: Bullish
• Long-term: Neutral to bullish
Momentum indicators: • RSI: Balanced strength, not overbought
• MACD: Positive but stable
• Moving averages: Gradual bullish alignment
• Volatility: Medium-high
Market is trending upward but still vulnerable to pullbacks.
Institutional Sentiment
Bullish Positioning
Large participants expect: • Break above 0.72250
• Expansion toward 0.73000–0.74200
• Gradual USD weakness cycle
• Commodity-driven AUD support
They view current structure as accumulation.
Bearish Positioning
Cautious participants highlight: • Strong USD yield support
• Resistance pressure near 0.72250–0.73000
• Global uncertainty risk
• Potential profit-taking zones
Temporary corrections remain possible.
Advanced Trading Strategies
1. Buy-on-Dip Strategy
• Entry: 0.70800 – 0.71000
• Stop-loss: Below 0.70000
• Target 1: 0.72250
• Target 2: 0.73000
• Target 3: 0.74200
Best suited for trend continuation environments.
2. Breakout Strategy
• Buy above 0.72250 with confirmation
• Targets: 0.73000 → 0.74200 → 0.75000
• Stop-loss: Below breakout zone
High reward but requires strong confirmation.
3. Range Strategy
• Sell: 0.72200–0.73000
• Buy: 0.70800–0.71000
• Focus: Intraday movements
Works best during consolidation phases.
4. Swing Strategy
• Hold 3–10 days
• Follow macroeconomic events
• Focus CPI, NFP, China data
• Avoid overtrading during volatility spikes
Risk Considerations
Key risks include: • US inflation surprises
• Federal Reserve policy shifts
• China slowdown risks
• Commodity price declines
• Sudden USD strength spikes
• Geopolitical shocks
• Global liquidity tightening
Recommended approach: • Low leverage usage
• Strict stop-loss discipline
• Avoid emotional entries
• Do not chase breakouts
Market Outlook Scenarios
Bullish Scenario
If risk sentiment improves: • 0.72250 breakout
• 0.73000 expansion
• 0.74200–0.75000 continuation
Neutral Scenario
• Range: 0.70000 – 0.72250
• Accumulation phase
• Await macro catalyst
Bearish Scenario
If USD strengthens: • Drop toward 0.70000
• Possible 0.69200 test
• Extended correction toward 0.68450
Final Outlook
AUDUSD remains in a macro-supported bullish structure with controlled volatility. The market is currently in a decision zone where breakout confirmation is required for further upside continuation.
Key levels to monitor: • 0.71000 – support base
• 0.72250 – breakout trigger
• 0.73000 – resistance cluster
• 0.74200 – expansion zone
Overall, AUDUSD continues to offer strong opportunities for both swing and intraday traders, provided risk management and macro awareness remain the primary focus.
repost-content-media
  • Reward
  • Comment
  • Repost
  • Share
#PolymarketHundredUWarGodChallenge .
Polymarket Beginner Guide
How to Start Trading on Polymarket – Step-by-Step Complete Educational Guide
Polymarket is one of the most advanced prediction market platforms integrated within the broader crypto trading ecosystem accessible through platforms like Gate.com. It allows users to trade on real-world event outcomes using probability-based pricing rather than traditional speculative instruments.
Instead of betting against a centralized system, Polymarket operates as a peer-to-peer prediction marketplace, where traders express views on future outcomes
BTC-0.48%
ETH-1.27%
HighAmbition
#PolymarketHundredUWarGodChallenge .
Polymarket Beginner Guide
How to Start Trading on Polymarket – Step-by-Step Complete Educational Guide
Polymarket is one of the most advanced prediction market platforms integrated within the broader crypto trading ecosystem accessible through platforms like Gate.com. It allows users to trade on real-world event outcomes using probability-based pricing rather than traditional speculative instruments.
Instead of betting against a centralized system, Polymarket operates as a peer-to-peer prediction marketplace, where traders express views on future outcomes through YES/NO contracts.
This guide is designed to help beginners understand Polymarket from zero level to advanced usage in a structured, safe, and educational format.
1. What is Polymarket?
Polymarket is a decentralized prediction market where users trade contracts based on real-world events.
These events include:
Cryptocurrency price movements (BTC, ETH, etc.)
Global political elections
Sports match outcomes
Economic indicators (inflation, interest rates)
Technology developments
Cultural and entertainment events
Each market represents a binary question such as:
“Will Bitcoin exceed $100,000 in 2026?”
Users then trade based on their belief about the outcome.
2. Core Concept of Prediction Markets
Each market consists of:
YES shares
NO shares
Each share is priced between:
$0.00 – $1.00
Price reflects probability:
$0.10 → 10% probability
$0.50 → 50% probability
$0.90 → 90% probability
This pricing system allows markets to behave as real-time probability engines driven by global sentiment and data flow.
3. Profit & Loss Mechanism
The outcome is straightforward:
If prediction is correct:
Each share settles at $1
If prediction is incorrect:
Each share settles at $0
Example:
You buy 200 YES shares at $0.35
Total cost = $70
If correct → payout = $200
Profit = $130
If wrong → total loss = $70
Additionally, positions can be sold early based on market movement, allowing dynamic profit-taking.
4. Why Polymarket is Gaining Global Attention
Polymarket has become popular due to its unique financial structure:
Key advantages:
Transparent probability-based pricing
No centralized betting house model
Real-time global sentiment reflection
High liquidity in major markets
Ability to exit positions anytime
Integration with blockchain settlement systems
It is widely used by traders, analysts, and information researchers.
5. Account Setup Process (Gate Ecosystem Access Flow)
To access Polymarket through integrated platforms like Gate ecosystem:
Step 1:
Create or log in to your trading account
Step 2:
Access prediction market section
Step 3:
Connect supported wallet (if required)
Step 4:
Enable trading permissions
The system is designed for smooth onboarding with simplified access for new users.
6. Wallet Setup & Security Framework
Polymarket operates on blockchain infrastructure, requiring wallet connectivity.
Supported wallets:
MetaMask
WalletConnect compatible wallets
Integrated smart wallets (platform-based)
Security steps:
Secure your recovery phrase
Enable authentication layers
Avoid sharing wallet credentials
Verify official domains before login
Security is critical in decentralized environments.
7. Deposit Process (USDC-Based System)
Polymarket typically uses stable digital assets such as USDC.
Deposit steps:
Acquire USDC from exchange platforms
Transfer to supported network (Polygon)
Confirm deposit on platform wallet
Start trading instantly
Benefits:
Low transaction fees
Fast confirmation
Stable value settlement
8. How to Navigate Markets
Inside the platform, users will find:
Dashboard:
Trending prediction markets
High volume events
Active trading opportunities
Categories:
Crypto
Politics
Global economy
Sports
Technology
Market Page:
Each market contains:
Question statement
YES/NO pricing
Trading volume
Historical price movement
Settlement criteria
Understanding market rules is essential before trading.
9. Step-by-Step Trading Execution
Step 1:
Open a market of choice
Step 2:
Select:
YES (if bullish on outcome)
NO (if bearish on outcome)
Step 3:
Choose order type:
Market Order (instant execution)
Limit Order (custom price entry)
Step 4:
Enter investment amount
Step 5:
Confirm transaction
Example:
Market: “Will Ethereum reach $6,000?”
YES price = $0.40
Investment = $100
Shares = 250
If correct:
Payout = $250
Profit = $150
10. Order Types Explained
Market Order:
Instant execution
May include slight price variation
Limit Order:
User-defined price
Executes only when matched
Beginners are advised to start with limit orders in high liquidity markets.
11. Exit Strategy (Early Selling Feature)
One of Polymarket’s key advantages is early exit flexibility.
If market price increases:
You can sell before resolution
Lock profits instantly
Reduce exposure risk
Example:
Buy at $0.30
Price rises to $0.75
Sell early → profit realized
12. Market Resolution System
All markets are resolved based on predefined data sources.
Resolution depends on:
Official announcements
Verified data providers
Structured settlement rules
Outcome:
Correct prediction → $1 payout
Incorrect prediction → $0 payout
Transparency ensures fairness in settlement.
13. Risk Management Framework (Very Important)
Trading involves uncertainty and volatility.
Recommended practices:
Start with small positions
Diversify across multiple markets
Avoid emotional trading decisions
Always read market conditions carefully
Use structured capital allocation
Beginner rule:
Never risk more than a small portion of total capital per trade.
14. Trading Strategies for Beginners
1. Data-Driven Strategy
Analyze:
News events
Economic indicators
Historical patterns
2. Probability Mispricing Strategy
Enter trades where market probability seems inaccurate.
3. Short-Term Momentum Strategy
Capture price movement before resolution.
4. Diversified Portfolio Strategy
Spread risk across unrelated markets.
15. Withdrawal Process
Steps:
Go to wallet section
Select withdraw option
Enter destination wallet address
Confirm transaction
Withdrawals are generally:
Fast
Low-cost (network dependent)
16. Key Success Principles
Focus on learning first, earning later
Understand probability mechanics
Avoid overtrading
Maintain discipline
Track performance consistently
Build long-term strategy
Final Conclusion
Polymarket is an advanced prediction market system that combines:
Financial trading principles
Real-world data interpretation
Global sentiment analysis
When used properly, it becomes a powerful tool for understanding probability, market psychology, and event forecasting.
However, success depends on:
Knowledge
Discipline
Risk control
Continuous learning
Disclaimer
This content is for educational purposes only and should not be considered financial advice. Trading involves risk, and outcomes are not guaranteed. Users should always make informed decisions based on their own research and risk tolerance.
repost-content-media
  • Reward
  • Comment
  • Repost
  • Share
#PolymarketHundredUWarGodChallenge
Polymarket Prediction Strategy
“Will Bitcoin Remain Above $90,000 Before the End of Q2 2026?”
Introduction
Bitcoin continues trading inside one of the most important macroeconomic and liquidity-driven environments in modern cryptocurrency market history. The current Polymarket discussion surrounding whether Bitcoin can remain above the $90,000 level before the end of Q2 2026 has become a major focus for traders, institutional participants, hedge funds, and volatility-driven market analysts.
At the time of this analysis, Bitcoin is trading near $79,350 afte
BTC-0.48%
HighAmbition
#PolymarketHundredUWarGodChallenge
Polymarket Prediction Strategy
“Will Bitcoin Remain Above $90,000 Before the End of Q2 2026?”
Introduction
Bitcoin continues trading inside one of the most important macroeconomic and liquidity-driven environments in modern cryptocurrency market history. The current Polymarket discussion surrounding whether Bitcoin can remain above the $90,000 level before the end of Q2 2026 has become a major focus for traders, institutional participants, hedge funds, and volatility-driven market analysts.
At the time of this analysis, Bitcoin is trading near $79,350 after experiencing strong volatility and temporary rejection from higher resistance zones. Despite recent corrections, Bitcoin still maintains a structurally important long-term position supported by institutional adoption, ETF demand, post-halving supply dynamics, and broader global interest in digital assets as alternative macro hedge instruments.
Current Bitcoin Market Structure
Bitcoin’s current structure reflects a market balancing between long-term bullish expansion and short-term macroeconomic uncertainty. Buyers continue defending major support regions, while sellers remain active near psychological resistance zones.
The broader crypto market also remains highly sensitive to:
Federal Reserve policy expectations
Global liquidity conditions
ETF inflows and outflows
Inflation data releases
Institutional capital rotation
This creates a highly dynamic environment where market sentiment can change rapidly following major economic developments.
Institutional & Macro Support Factors
Several long-term structural drivers continue supporting Bitcoin’s broader market outlook.
Institutional Adoption
Spot Bitcoin ETFs continue transforming market participation by increasing accessibility for traditional financial institutions. Large-scale capital inflows from institutional entities reduce circulating supply pressure while strengthening long-term accumulation behavior.
Post-Halving Supply Dynamics
Bitcoin’s post-halving environment remains historically important. Reduced miner issuance creates long-term scarcity conditions that can support bullish momentum during liquidity expansion cycles.
Global Liquidity Expectations
Any improvement in monetary policy conditions or easing financial pressure could significantly strengthen risk assets, including Bitcoin and the broader cryptocurrency sector.
Digital Hedge Narrative
Bitcoin increasingly functions as a macro hedge asset during periods of uncertainty, currency weakness, and global financial instability.
Major Risk Factors
Despite long-term bullish structural support, several bearish risks remain active.
Interest Rate Pressure
Higher-for-longer interest rate expectations continue creating pressure across speculative and risk-sensitive markets.
Regulatory Uncertainty
Unexpected regulatory developments, taxation concerns, or exchange-related restrictions can rapidly affect sentiment.
Profit-Taking Volatility
Large holders frequently realize profits during strong market expansions, which can trigger aggressive correction phases.
Correlation With Traditional Markets
Bitcoin still maintains partial correlation with Nasdaq and broader technology equities, meaning weakness in global financial markets can negatively influence crypto momentum.
Probability Analysis
From a probability perspective, reclaiming and sustaining levels above $90,000 before the end of Q2 2026 remains challenging but still possible.
The shorter timeframe increases volatility sensitivity because Bitcoin requires substantial upward expansion within limited time conditions.
Estimated Probability Structure
YES Scenario (Bitcoin above $90,000): 25%–40%
NO Scenario (Bitcoin below $90,000): 60%–75%
Current sentiment reflects cautious positioning as traders balance long-term bullish cycle expectations against immediate short-term macro resistance pressure.
Market Sentiment & Volatility Expectations
Bitcoin remains one of the most reactive assets in global financial markets. Sudden volatility expansions remain possible following:
ETF flow changes
Inflation reports
Federal Reserve announcements
Global liquidity shifts
Institutional positioning adjustments
Because of this, Polymarket probabilities can reprice aggressively within very short periods.
Fear-driven corrections can rapidly transform into momentum expansions if positive liquidity catalysts appear unexpectedly.
Strategic Outlook
The market currently shows a slight short-term probability advantage toward the NO side due to:
Tight Q2 timeframe
Current price distance from $90,000
Ongoing macroeconomic uncertainty
Resistance pressure near higher levels
However, broader long-term cycle conditions remain constructive, meaning bullish momentum cannot be dismissed entirely.
Bitcoin historically demonstrates aggressive repricing behavior during favorable liquidity environments, especially when institutional demand accelerates simultaneously with improving market sentiment.
Final Conclusion
Bitcoin continues trading inside a highly sensitive macroeconomic and institutional environment where both bullish and bearish scenarios remain active.
While the broader long-term structure still supports future upside potential, the immediate challenge of reclaiming and sustaining levels above $90,000 before the end of Q2 2026 creates a difficult short-term probability environment.
Current analysis suggests:
Slight short-term bias toward the NO scenario
Strong volatility potential remains active
Institutional flows and liquidity conditions will remain the key market drivers
The coming weeks will likely determine whether Bitcoin can generate enough momentum expansion to challenge the $90,000 threshold before Q2 concludes.
Polymarket continues rewarding traders who focus on disciplined probability analysis, emotional control, macroeconomic understanding, and adaptability rather than emotional speculation alone.
#PolymarketHundredUWarGodChallenge
repost-content-media
  • Reward
  • Comment
  • Repost
  • Share
#GateSquareMayTradingShare
Gate Blue Lobster AI Trading Tool Launch
The launch of Gate.io Blue Lobster AI Trading System represents a major evolution in the crypto trading infrastructure space, where artificial intelligence is no longer just an analytical add-on but is becoming a fully integrated execution and decision-making layer within digital asset markets.
This development signals a transition from manual or semi-automated trading workflows toward agent-driven trading ecosystems, where AI systems continuously analyze markets, generate strategies, and assist in execution across both cen
HighAmbition
#GateSquareMayTradingShare
Gate Blue Lobster AI Trading Tool Launch
The launch of Gate.io Blue Lobster AI Trading System represents a major evolution in the crypto trading infrastructure space, where artificial intelligence is no longer just an analytical add-on but is becoming a fully integrated execution and decision-making layer within digital asset markets.
This development signals a transition from manual or semi-automated trading workflows toward agent-driven trading ecosystems, where AI systems continuously analyze markets, generate strategies, and assist in execution across both centralized and decentralized environments.
What is Blue Lobster (GateClaw AI System)?
Blue Lobster, also referred to as GateClaw, is an advanced AI Agent platform designed specifically for cryptocurrency trading environments. Unlike traditional trading tools that require technical setup, scripting knowledge, or external integration, this system is built for instant activation and full accessibility, allowing traders to engage with AI-powered market intelligence through a simplified interface.
The platform operates on the principle of transforming traders from reactive participants into AI-assisted proactive decision makers, where market signals, sentiment shifts, liquidity data, and macro trends are continuously processed in real time.
The conceptual branding of “Blue Lobster” symbolizes a shift away from reactive trading behavior toward structured, data-driven anticipation of market movements, where traders rely on AI to detect opportunities before they become visible to the broader market.
Core Architecture and Functional Intelligence Layer
Blue Lobster is not a single tool but a multi-layer AI trading ecosystem, integrating several functional modules that operate together to support trading decisions across different stages of the market cycle.
The Market Analysis Intelligence Layer continuously aggregates real-time data including price movements, funding rates, liquidation clusters, order book shifts, and sentiment indicators. This allows traders to access structured market interpretations rather than raw data, significantly reducing analysis time while improving decision clarity.
The Strategy Generation Engine enables users to design, test, and optimize trading strategies using historical market data and AI-driven simulations. This transforms strategy creation from a manual process into an adaptive system where models evolve based on changing volatility conditions and market structure behavior.
The Execution and Automation Layer connects analytical insights directly to trading actions, enabling automated or semi-automated execution depending on user preference. This reduces latency between decision-making and trade execution, which is especially critical in high-volatility crypto environments.
Cross-Platform Integration and Remote Trading Infrastructure
One of the most significant aspects of Blue Lobster is its cross-platform accessibility framework, which allows traders to interact with AI systems through widely used communication channels such as Telegram, WhatsApp, and other messaging environments.
This means traders are no longer confined to exchange dashboards; instead, they can monitor positions, receive alerts, and execute actions remotely, creating a fully mobile and distributed trading workflow.
Additionally, integration with decentralized exchanges (DEX) and on-chain infrastructure expands the system beyond centralized markets, enabling unified trading across multiple liquidity environments. This reflects a broader industry shift toward hybrid trading ecosystems combining CeFi and DeFi execution layers.
Market Impact and Structural Significance
The introduction of AI-driven trading agents represents a major shift in how crypto markets function at a structural level.
First, it increases market efficiency, as AI systems reduce delays in information processing and execution. This leads to faster price discovery and more rapid response to news events, liquidity shifts, and macroeconomic changes.
Second, it increases algorithmic competition, as more traders adopt AI tools, reducing traditional manual trading advantages and compressing reaction time across the entire market.
Third, it enhances retail participation quality, allowing less experienced traders to access institutional-grade analytics and strategy tools, narrowing the gap between retail and professional participants.
However, this also increases short-term volatility, as AI-driven systems can collectively react to similar signals simultaneously, amplifying market movements during key events.
Trading Behavior Implications
With AI integration, market behavior is expected to shift toward faster cycles of expansion and correction. Signals that previously took hours or days to reflect in price action may now be processed within minutes or seconds.
This creates an environment where:
Momentum phases become sharper and shorter
Liquidity shifts occur more rapidly
Breakouts and breakdowns accelerate in speed
False signals may also increase due to algorithmic clustering
Therefore, traders must adapt by focusing more on execution timing, risk control, and adaptive strategy frameworks, rather than static directional forecasting.
Strategic Trading Advantages of Blue Lobster
The system provides multiple structural advantages for traders operating in fast-moving markets.
Efficiency is significantly improved as routine analysis tasks such as scanning markets, tracking volatility, and monitoring liquidity are automated, allowing traders to focus more on strategic decision-making.
Intelligence is enhanced through AI-generated insights that combine multiple data layers into actionable signals, reducing emotional bias and improving consistency.
Accessibility ensures that both retail and professional traders can utilize advanced tools without technical barriers, creating a more inclusive trading environment.
Customization allows users to adjust AI behavior according to their own risk profile, trading style, and market preferences, making the system adaptable across different strategies.
Risk Structure and Market Dependency
Despite its advanced capabilities, Blue Lobster operates within inherently volatile crypto market conditions, meaning its outputs are still dependent on underlying liquidity, macro trends, and market structure behavior.
AI tools improve decision-making efficiency but do not eliminate market risk. In fact, faster execution and higher participation can sometimes amplify losses during adverse conditions if risk controls are not properly applied.
Therefore, disciplined position sizing, structured stop-loss systems, and careful monitoring of leveraged exposure remain essential even when using advanced AI tools.
Broader Industry Evolution and Future Outlook
The launch of Blue Lobster reflects a broader industry shift toward agent-based financial systems, where AI does not just assist trading but actively participates in analysis, strategy design, and execution.
Future development directions likely include deeper integration with on-chain protocols, expanded predictive analytics models, and enhanced autonomous trading capabilities that can operate across multiple market conditions simultaneously.
This evolution suggests that crypto trading is transitioning into a semi-autonomous financial ecosystem, where human traders increasingly act as supervisors of AI systems rather than direct executors of trades.
Final Insight
The Blue Lobster AI system represents more than a platform upgrade; it is a structural shift in the architecture of digital asset trading.
It moves the industry toward a model where:
Data is continuously processed in real time
Strategies are dynamically generated and refined
Execution is automated and optimized
Market participation becomes increasingly AI-assisted
In this environment, competitive advantage will increasingly depend on how effectively traders integrate AI systems into their decision-making process rather than relying solely on manual analysis.
repost-content-media
  • Reward
  • Comment
  • Repost
  • Share
#CLARITYActPassesSenateCommittee
Bitcoin Market Analysis and CLARITY Act Senate Committee Passage
Introduction: Regulatory Breakthrough Meets Market Consolidation
Bitcoin and the broader digital asset market are currently navigating a critical intersection of macroeconomic pressure, technical consolidation, and major regulatory development. The most significant recent catalyst is the advancement of the CLARITY Act (Digital Asset Market Clarity Act) through the U.S. Senate Banking Committee, where it passed with a bipartisan 15–9 vote on May 14, 2026.
At the same time, Bitcoin is trading in a
HighAmbition
#CLARITYActPassesSenateCommittee
Bitcoin Market Analysis and CLARITY Act Senate Committee Passage
Introduction: Regulatory Breakthrough Meets Market Consolidation
Bitcoin and the broader digital asset market are currently navigating a critical intersection of macroeconomic pressure, technical consolidation, and major regulatory development. The most significant recent catalyst is the advancement of the CLARITY Act (Digital Asset Market Clarity Act) through the U.S. Senate Banking Committee, where it passed with a bipartisan 15–9 vote on May 14, 2026.
At the same time, Bitcoin is trading in a tight consolidation range between approximately $79,000 and $81,000, after multiple attempts to break above resistance near $82,000 and repeated defenses of support around $78,000. This combination of regulatory progress and price compression has created a decisive environment for the next major move in the market cycle.
CLARITY Act: What the Senate Committee Passage Means
The CLARITY Act represents one of the most important legislative efforts in U.S. crypto history. Its core objective is to eliminate long-standing regulatory uncertainty by clearly defining how digital assets are classified and supervised.
The Senate Banking Committee’s approval does not make it law yet, but it is a major procedural milestone that signals strong bipartisan willingness to structure the crypto market rather than restrict it outright.
The bill now moves toward full Senate debate, potential amendments, and eventual reconciliation with the House version before reaching the President’s desk.
Core Purpose: Establishing Regulatory Clarity
The primary goal of the CLARITY Act is to resolve the long-standing jurisdictional conflict between two major regulators:
The Securities and Exchange Commission (SEC)
The Commodity Futures Trading Commission (CFTC)
For years, crypto projects have operated under uncertainty regarding whether tokens should be treated as securities or commodities. The CLARITY Act introduces clearer definitions:
Digital commodities (like Bitcoin and sufficiently decentralized assets) fall under CFTC oversight
Investment-contract tokens remain under SEC regulation
This distinction is critical because it removes overlapping enforcement pressure that has historically created legal risk for exchanges, developers, and institutional participants.
Structural Framework of the Bill
The legislation introduces a full market structure for digital assets, covering exchanges, brokers, and token issuers.
Key components include:
Mandatory registration standards for crypto trading platforms
Anti-money laundering (AML) compliance and reporting obligations
Consumer protection rules for retail participants
Defined pathways for token decentralization classification changes
Safe harbor protections for decentralized finance (DeFi) developers who do not control user funds
Stablecoin regulation with restrictions on yield-like rewards tied to passive holding
The stablecoin framework is particularly important because it attempts to balance innovation with financial stability concerns raised by traditional banking institutions.
Market Reaction: Immediate but Controlled Volatility
The immediate market response to the committee vote was cautiously positive but not euphoric. This reflects a key theme: markets are treating this as a long-term structural development rather than an immediate price catalyst.
Following the announcement:
Bitcoin briefly moved toward $82,000
Later retraced back into the $79,000–$81,000 range
Short liquidations exceeding $250 million were reported in leveraged positions
Despite this, Bitcoin did not enter a sustained breakout phase. Instead, price behavior suggests a “buy-the-rumor, moderate-the-news” structure combined with macroeconomic hesitation.
Bitcoin Price Structure: Key Levels and Behavior
Bitcoin remains locked in a defined technical corridor:
Support Zone: $78,000
Resistance Zone: $82,000
Current Trading Range: $79,000–$81,000
Repeated rejection at the upper boundary suggests sellers are active near resistance, while consistent defense of the lower boundary indicates ongoing accumulation interest.
This compression phase is often associated with volatility expansion events, where price eventually breaks sharply in one direction after liquidity builds on both sides.
Broader Market Drivers Beyond Regulation
While the CLARITY Act is a major narrative, Bitcoin’s price action is also shaped by multiple external factors:
ETF inflows and outflows affecting spot demand
Whale accumulation and distribution patterns
Futures market leverage and liquidation cascades
U.S. Federal Reserve interest rate expectations
Inflation data and macroeconomic sentiment
Equity market correlation and risk appetite cycles
These combined forces mean that regulatory optimism alone is not sufficient to trigger a breakout without supportive liquidity conditions
Institutional Impact: Why the Bill Matters Long-Term
One of the most important implications of the CLARITY Act is institutional participation.
If passed into law, it could significantly reduce legal uncertainty for:
Banks
Hedge funds
Pension funds
Asset managers
This would potentially unlock large-scale capital inflows into Bitcoin and other compliant digital assets.
Institutions generally require clear regulatory frameworks before deploying significant capital. The removal of ambiguity around SEC vs CFTC jurisdiction is therefore a major structural shift.
Market Sentiment: Cautious Optimism
Sentiment across the crypto market remains balanced between optimism and caution.
Bullish expectations are driven by:
Regulatory clarity improving legitimacy
Continued ETF demand
Strong on-chain accumulation signals
Long-term supply constraints of Bitcoin
However, caution remains due to:
Macro uncertainty
High leverage in derivatives markets
Possibility of delayed legislative progress
Resistance rejection near $82,000
Market participants are increasingly focused on confirmation rather than speculation.
Bullish Scenario: Potential Expansion Phase
If the CLARITY Act continues advancing through the full Senate with strong bipartisan support, the market could enter a new expansion phase.
In a bullish scenario:
Breakout above $82,000 could trigger momentum continuation
Bitcoin may target $85,000 initially
Extended upside could reach $88,000–$90,000
In strong macro conditions, longer-term projections extend beyond $100,000
This scenario depends heavily on sustained ETF inflows and supportive global liquidity conditions.
Bearish Scenario: Structural Risks Remain
Despite positive legislative progress, downside risks still exist independently of the bill:
Failure to pass full Senate vote due to amendments or political resistance
Macro tightening or delayed interest rate cuts
Equity market corrections triggering risk-off behavior
ETF outflows reducing spot demand
Breakdown of key support near $78,000
In a deeper correction scenario, Bitcoin could revisit:
$75,000 support
Psychological zone near $70,000 in extreme cases
However, many analysts view such pullbacks as cyclical rather than structural breakdowns.
Trading Environment: Strategy Considerations
Current market conditions favor range-based strategies until a confirmed breakout occurs.
Key strategic approaches include:
Accumulation near support zones during dips
Profit-taking near resistance levels
Strict risk management due to leveraged volatility
Avoiding overexposure during consolidation phases
Waiting for volume-confirmed breakout above $82,000
A decisive move outside the current range is likely to define the next major trend phase.
Long-Term Outlook: Structural Market Evolution
The CLARITY Act’s advancement signals a broader transformation of the crypto industry from an uncertain frontier market into a regulated financial asset class.
Over time, this may lead to:
Reduced volatility due to institutional participation
Higher liquidity across exchanges
Stronger integration with traditional financial systems
Increased legitimacy of Bitcoin as a macro asset
This transition mirrors earlier phases in commodities and equity markets where regulatory clarity preceded large-scale adoption.
Conclusion: A Critical Inflection Point
The combination of Bitcoin’s consolidation near $80,000 and the CLARITY Act’s advancement through the Senate Banking Committee represents a significant inflection point for the digital asset market.
In the short term, price action remains range-bound and sensitive to macroeconomic and liquidity conditions. In the long term, regulatory clarity has the potential to reshape the structure of the entire crypto ecosystem by enabling institutional participation at a much larger scale.
The market is now positioned in a compression phase where both regulatory progress and technical structure are building toward a potential expansion. The next decisive move—above resistance or below support—will likely define the next major trend cycle for Bitcoin.
repost-content-media
  • Reward
  • Comment
  • Repost
  • Share
#BitcoinVShapedReversalBack
Bitcoin V-Shaped Reversal Back
Bitcoin is currently in one of the most important recovery structures of this cycle, where price action is showing a potential V-shaped reversal formation after a deep macro correction from the cycle high of approximately $126,000 (Oct 2025) down to a major accumulation low near $60,000 (early 2026).
As of mid-May 2026, Bitcoin trades around $82,000–$84,000, showing strong recovery momentum and re-entry into major liquidity zones.
This structure is important because V-shaped reversals often represent:
Emotional capitulation bottoming
BTC-0.48%
HighAmbition
#BitcoinVShapedReversalBack
Bitcoin V-Shaped Reversal Back
Bitcoin is currently in one of the most important recovery structures of this cycle, where price action is showing a potential V-shaped reversal formation after a deep macro correction from the cycle high of approximately $126,000 (Oct 2025) down to a major accumulation low near $60,000 (early 2026).
As of mid-May 2026, Bitcoin trades around $82,000–$84,000, showing strong recovery momentum and re-entry into major liquidity zones.
This structure is important because V-shaped reversals often represent:
Emotional capitulation bottoming phases
Liquidity re-accumulation zones
Fast trend reversal environments
Institutional re-entry phases
2. What is a V-Shaped Reversal? (Step-by-Step Breakdown)
A V-shaped reversal is a sharp market structure where price falls aggressively and then rebounds equally fast, forming a “V” shape.
Step 1: Sharp Decline Phase
Bitcoin drops from highs near $126,000 → $100,000 → $75,000 → $60,000
Panic selling increases
Liquidity gets cleared below major support zones
Stop-loss cascades trigger accelerated downside
Step 2: Capitulation Bottom Formation
Price stabilizes near $58,000–$62,000
Volatility spikes but downside slows
Buyers begin absorbing supply aggressively
Whale accumulation begins
Step 3: Sharp Recovery Phase
Price rebounds from $60,000 → $70,000 → $80,000 → $83,000
Volume increases on upside candles
Market sentiment shifts from fear → neutral → optimism
Short sellers begin to exit positions
Step 4: Continuation or Failure Zone
Either continuation to $92K–$100K+
Or rejection leading to retest of $70K–$65K
3. Current Bitcoin Market Structure (May 2026)
Bitcoin is currently positioned in a mid-recovery zone after strong rebound.
Key Price Levels:
Major cycle high: $126,000
Breakdown zone: $100,000
Macro support: $75,000
Deep accumulation low: $60,000
Current trading range: $82,000–$84,000
Liquidity Zones:
Upper liquidity: $88,000 → $92,000 → $100,000
Lower liquidity: $78,000 → $70,000 → $65,000
4. Technical Structure Confirmation Factors
1. Trend Reclaim Structure
Bitcoin has reclaimed:
Short-term moving averages
Broken resistance zones near $78K–$80K
Mid-range liquidity bands
2. Volume Expansion Pattern
Volume increased during recovery from $60K
Lower volume during pullbacks indicates absorption
Institutional participation gradually increasing
3. Market Structure Shift
Lower highs broken upward
Higher lows forming from $60K base
Transition from bearish → neutral → bullish structure
5. Fibonacci & Price Expansion Zones
Based on full-cycle movement:
0.236 retracement: ~$70,000
0.382 retracement: ~$78,000
0.5 retracement: ~$83,000 (current zone)
0.618 retracement: ~$92,000
0.786 retracement: ~$105,000
Full extension: $120,000–$135,000
6. Institutional Flow Analysis
ETF & Institutional Behavior:
ETF inflows are stabilizing after volatility phases
Mixed positioning from large funds
Accumulation during dips near $70K–$75K
Profit-taking near $85K–$90K
Whale Behavior:
Accumulation wallets increasing exposure below $80K
Distribution pockets visible near $90K–$100K
7. Polymarket-Style Probability Mapping
Will Bitcoin sustain V-shaped reversal?
Strong bullish continuation: 45–55%
Sideways consolidation: 30–40%
Failed reversal (double dip): 20–30%
Will BTC break $92K resistance?
Yes breakout scenario: 40–50%
Rejection + retrace: 50–60%
Will BTC revisit $70K again?
Yes (liquidity sweep): 35–45%
No (trend continuation): 55–65%
8. Bullish Scenario Breakdown
If V-shaped reversal confirms:
Break above $88K–$92K
Acceleration toward $100K–$110K
Mid-term extension toward $120K–$135K
Supercycle narrative reactivation toward $150K–$180K
9. Bearish Risk Scenario
If reversal fails:
Rejection near $85K–$88K
Drop back to $75K support
Possible liquidity sweep toward $65K–$60K
Formation of broader distribution range
10. Market Sentiment Structure
Current sentiment phases:
Retail: cautiously optimistic
Institutional: neutral accumulation
Derivatives: balanced leverage positioning
Long-term holders: strong holding behavior
Market is not fully bullish yet — it is in transition phase
11. Key Confirmation Signals
V-shaped reversal confirms only if:
Daily close above $92,000
Volume expansion continues
ETF inflows remain positive
No rejection from upper liquidity zones
Failure signals:
Breakdown below $78,000
ETF outflows spike
Low volume rally rejection
Bearish divergence formation
12. Final Conclusion
Bitcoin’s current structure strongly resembles a macro V-shaped recovery phase, transitioning from deep accumulation near $60K toward a potential trend reversal zone.
However, the structure is still incomplete until price confirms breakout above $92K–$100K resistance zone.
Until then, Bitcoin remains in a high-volatility confirmation zone, where both continuation and rejection scenarios remain active.
The next major move will likely be fast, directional, and liquidity-driven.
repost-content-media
  • Reward
  • Comment
  • Repost
  • Share
#CMEToLaunchNasdaqCryptoIndexFutures
1. Introduction: A Structural Shift in Crypto Derivatives Markets
The announcement by CME Group on May 14, 2026, regarding the planned launch of the Nasdaq CME Crypto Index Futures on June 8, 2026, represents a structural transformation in global crypto derivatives architecture. This is not simply a new futures contract, but the creation of a unified benchmark instrument that merges traditional regulated financial infrastructure with a diversified basket of digital assets.
Unlike single-asset futures such as Bitcoin or Ethereum contracts, this index produc
HighAmbition
#CMEToLaunchNasdaqCryptoIndexFutures
1. Introduction: A Structural Shift in Crypto Derivatives Markets
The announcement by CME Group on May 14, 2026, regarding the planned launch of the Nasdaq CME Crypto Index Futures on June 8, 2026, represents a structural transformation in global crypto derivatives architecture. This is not simply a new futures contract, but the creation of a unified benchmark instrument that merges traditional regulated financial infrastructure with a diversified basket of digital assets.
Unlike single-asset futures such as Bitcoin or Ethereum contracts, this index product introduces a multi-asset exposure layer that reflects the broader crypto economy in a single standardized instrument. This shift significantly reduces fragmentation in institutional positioning, allowing macro traders, hedge funds, pension funds, and asset managers to treat crypto as a single correlated asset class rather than multiple isolated positions.
2. Partnership Framework with Nasdaq
The collaboration between CME Group and Nasdaq adds a critical layer of credibility and market infrastructure depth. Nasdaq’s involvement contributes index design expertise, market surveillance frameworks, and data integrity systems, while CME provides clearing, margining, and settlement infrastructure under regulated U.S. derivatives law.
The market-cap-weighted structure is particularly important because it dynamically adjusts exposure based on real-time asset dominance. This means institutional capital does not need constant rebalancing across multiple futures contracts. Instead, exposure automatically shifts as Bitcoin, Ethereum, Solana, XRP, Cardano, Chainlink, and Stellar fluctuate in market dominance.
This significantly reduces operational complexity for large funds that previously faced execution inefficiencies when managing multi-leg crypto derivatives positions across fragmented venues.
3. Underlying Index Composition and Weighting Structure
The index composition includes leading digital assets selected based on liquidity depth, network security, adoption trends, and exchange volume stability. The weighting methodology ensures continuous recalibration based on market capitalization and liquidity contribution rather than fixed allocations.
Bitcoin and Ethereum maintain structural dominance due to their liquidity and institutional acceptance. However, high-growth assets like Solana and Chainlink introduce beta exposure to innovation cycles within DeFi, infrastructure, and smart contract ecosystems. XRP, Cardano, and Stellar add exposure to payment rails, academic blockchain design, and cross-border settlement narratives.
This dynamic structure allows the index to act as a “living representation” of crypto market dominance shifts, rather than a static index frozen in time.
4. Current Market Structure and Price Environment (May 2026 Context)
As of the May 2026 macro environment, Bitcoin trades within a $79,000–$82,000 consolidation band, reflecting equilibrium between institutional inflows and profit-taking cycles. Ethereum remains in the $3,000–$3,400 range, supported by staking yields, L2 scaling adoption, and ETF-linked demand channels.
Solana’s $140–$180 range reflects strong ecosystem throughput expansion, while XRP stabilizes between $0.85–$1.10 amid regulatory clarity improvements. Cardano trades in a broader $0.45–$0.70 accumulation range, indicating long-cycle positioning rather than speculative spikes.
Chainlink’s $14–$18 range reflects increasing oracle infrastructure demand, while Stellar remains in the $0.10–$0.15 range, functioning as a low-volatility cross-border settlement utility asset.
Overall market structure is characterized by institutional accumulation, reduced retail leverage dominance, and improved correlation efficiency across major assets.
5. Settlement Mechanism and Institutional Risk Structure
The contract is cash-settled in U.S. dollars, which eliminates custody risk and reduces counterparty exposure associated with physical delivery mechanisms. This structure is essential for institutional participation, particularly for funds restricted from holding underlying crypto assets directly.
The cash-settlement model also improves hedging efficiency for ETFs, structured products, and algorithmic trading desks. By linking settlement to a transparent benchmark index, CME ensures reduced manipulation risk and standardized valuation across expiration cycles.
This aligns with existing CME equity index futures models such as S&P 500 derivatives, making crypto structurally compatible with traditional macro hedging frameworks.
6. Institutional Demand Acceleration and Market Trends
CME’s reported 43% increase in crypto futures volume highlights a decisive shift in liquidity migration from offshore exchanges toward regulated U.S. derivatives venues. This reflects institutional preference for transparent margin systems, standardized clearinghouses, and reduced counterparty uncertainty.
Large asset managers are increasingly integrating crypto exposure through derivatives rather than spot holdings due to compliance constraints and operational efficiency. This trend strengthens CME’s role as a central liquidity hub for regulated crypto exposure.
7. Macro Market Size and Liquidity Implications
The global crypto derivatives ecosystem is estimated at $85–$95 trillion in annual notional flow, making it one of the largest speculative and hedging markets globally. Even marginal institutional allocation shifts into index futures can generate significant liquidity clustering within CME’s ecosystem.
This concentration effect may increase the importance of CME pricing as a global reference benchmark, potentially influencing ETF pricing, OTC derivatives, and even offshore perpetual futures markets through arbitrage convergence mechanisms.
8. Trading Advantages and Portfolio Efficiency
The index futures product introduces significant improvements in capital efficiency. Instead of managing multiple margin accounts and directional positions across several assets, institutions can now gain diversified exposure through a single contract.
This reduces hedging overhead, simplifies risk attribution models, and allows macro traders to express broad market views such as “crypto sector bullishness” or “system-wide risk-off positioning” without micro-managing individual asset allocations.
Portfolio managers also benefit from cleaner VaR (Value at Risk) calculations due to reduced idiosyncratic volatility fragmentation.
9. Contract Accessibility and Market Participation Depth
The availability of both standard and micro contracts ensures accessibility across different capital tiers. Large institutions can deploy high-notional exposure strategies, while smaller professional traders can access fractional exposure without excessive margin requirements.
This dual-structure improves market depth and enhances liquidity distribution across multiple participant categories, reducing slippage and improving order book resilience during volatility spikes.
10. Benchmark Governance and Standardization
CME and Nasdaq jointly enforce governance standards that align crypto indexing methodologies with traditional financial benchmarks. This includes transparent rebalancing schedules, liquidity filters, and strict inclusion criteria based on exchange quality and asset reliability.
Such governance reduces index manipulation risks and ensures consistency across valuation cycles. It also enhances investor confidence, particularly among institutional allocators previously hesitant to engage with unregulated index structures.
11. Market Interpretation and Structural Validation
The introduction of a regulated crypto index futures product is widely interpreted as validation of crypto as a mature macro asset class. Historically, such instruments only emerge when underlying markets reach sufficient liquidity depth, stability, and institutional participation.
This signals a transition phase where crypto is no longer treated as an experimental asset class but rather as a structurally integrated component of global capital markets.
12. Impact on Spot Markets and Price Discovery
Index futures are expected to significantly influence spot markets through arbitrage mechanisms, ETF rebalancing flows, and institutional hedging strategies. Price discrepancies between futures and spot markets will create arbitrage opportunities that improve cross-exchange price efficiency.
This convergence effect strengthens global price discovery and reduces fragmentation between centralized exchanges, OTC desks, and regulated derivatives venues.
13. Macro Environment and Structural Evolution
The crypto market is currently undergoing a consolidation phase where capital rotates between established Layer 1 ecosystems and emerging infrastructure protocols. As a result, index composition is expected to evolve dynamically over time.
Market dominance may shift between Bitcoin, Ethereum, and high-performance smart contract platforms depending on adoption cycles, regulatory clarity, and technological scaling breakthroughs.
14. Risk Framework and Systemic Correlation
Despite diversification across multiple assets, systemic risk remains a key factor. During macro stress events, crypto assets tend to exhibit high correlation, leading to synchronized drawdowns across the index components.
CME’s clearing infrastructure plays a critical role in mitigating systemic risk through margin adjustments, volatility controls, and real-time risk monitoring systems that prevent cascading liquidation events.
15. Conclusion: Toward Full Crypto Market Institutionalization
This product represents a major milestone in the full institutionalization of crypto markets. By integrating a diversified index futures structure into a regulated environment, CME and Nasdaq are effectively standardizing crypto exposure within traditional financial frameworks.
This enables broader participation from pension funds, sovereign wealth funds, and macro hedge funds that require regulated, transparent, and scalable instruments for exposure management.
16. Forward Outlook and Adoption Trajectory
If institutional adoption continues at its current trajectory, and derivatives volume maintains growth momentum, this index futures product could evolve into a global benchmark for crypto market exposure.
Over time, it may influence ETF construction, structured product design, and cross-asset portfolio allocation strategies, ultimately positioning crypto as a core macro asset class within global financial markets rather than a peripheral speculative segment.
repost-content-media
  • Reward
  • Comment
  • Repost
  • Share
#TrumpVisitsChinaMay13
The May 13–15, 2026 visit of Donald Trump to China is emerging as one of the most influential geopolitical and macroeconomic events of the year. Global markets are already under pressure due to rising energy costs, persistent inflation risks, geopolitical instability in the Middle East, and uncertainty in international trade policy.
This summit between the United States and China comes at a time when financial systems are extremely sensitive. Even small developments in diplomacy, tariffs, or geopolitical tone can trigger large movements across Bitcoin, equities, commodi
HighAmbition
#TrumpVisitsChinaMay13
The May 13–15, 2026 visit of Donald Trump to China is emerging as one of the most influential geopolitical and macroeconomic events of the year. Global markets are already under pressure due to rising energy costs, persistent inflation risks, geopolitical instability in the Middle East, and uncertainty in international trade policy.
This summit between the United States and China comes at a time when financial systems are extremely sensitive. Even small developments in diplomacy, tariffs, or geopolitical tone can trigger large movements across Bitcoin, equities, commodities, and forex markets.
At present, Bitcoin is trading near $81,150, showing stability after a strong multi-week recovery. Meanwhile, Brent crude oil has surged above $105.54 per barrel, and WTI is trading near $99.80, reflecting ongoing supply concerns linked to geopolitical tensions. Gold has also rallied sharply above $4,700 per ounce, highlighting strong demand for safe-haven assets.
Bitcoin Market Structure — Trading Around $81,000 Zone
Bitcoin remains one of the most closely watched assets during this geopolitical event. BTC is currently trading around $81,150, showing only minor short-term fluctuations of approximately -0.04% in 24 hours, while maintaining a broader bullish structure.
Over the past week, Bitcoin has gained approximately +1.4%, and over the past month it has increased nearly +9.4%, reflecting steady recovery momentum from earlier lows near $62,000, which represents a total rebound of more than +30%.
Key Technical Levels:
Current Price: ~$81,150
Immediate Resistance: $81,900 – $82,500 (200-day EMA zone)
Breakout Target: $85,000 – $88,000 (+4.7% to +8.5% upside potential)
Major Support: $76,600
Critical Breakdown Zone: $75,000 (liquidity risk area)
Bitcoin is currently consolidating in a tight range, indicating market indecision but also accumulation pressure. High leverage in derivatives markets, with open interest near $9.7 billion, increases the probability of sharp volatility during the Trump–Xi meeting.
Fear & Greed Index is around 42 (neutral zone), showing that the market is neither overheated nor extremely fearful, leaving room for strong directional movement.
Institutional Demand and Market Support Factors
Institutional participation continues to play a major role in Bitcoin’s stability. Large-scale accumulation by institutional players and ETF inflows are supporting long-term demand.
Strategy increased holdings by approximately +535 BTC, bringing total reserves to around 818,869 BTC (~$65.8 billion value)
Spot Bitcoin ETFs continue to show steady inflows
Corporate treasury adoption remains active across multiple regions
This institutional flow is strengthening Bitcoin’s narrative as a macro asset and inflation hedge, especially during periods of global uncertainty.
Oil Market Shock — Inflation Pressure Rising
One of the biggest macro drivers affecting all financial markets is the ongoing Iran–US geopolitical tension, which has lasted nearly 70 days. The conflict has increased fears of disruption in the Strait of Hormuz, a critical route responsible for nearly 20% of global oil supply flow.
Energy Price Movement:
Brent Crude Oil: $105.54 (+4% recent surge)
WTI Crude Oil: $99.80
Short-term trend: Strong bullish pressure due to supply risk
Rising oil prices are directly contributing to global inflation pressure. Transportation, logistics, food production, aviation, and industrial manufacturing costs are all increasing due to higher energy input prices.
If tensions escalate further, analysts estimate oil could potentially move toward $120 – $150 per barrel, creating a severe inflation shock scenario that could force central banks to maintain higher interest rates for longer periods.
Gold and Safe-Haven Demand
Gold has surged above $4,700 per ounce, reflecting strong demand from institutional and retail investors seeking protection from geopolitical instability and inflation uncertainty.
This movement confirms a broader macro trend:
Rising risk = higher demand for safe assets
Gold and Bitcoin increasingly competing as hedge instruments
Capital rotation into defensive assets during uncertainty
Bitcoin’s long-term narrative as “digital gold” continues strengthening, especially during periods of global instability.
Why Trump–China Summit Matters for Crypto Markets
This diplomatic meeting has direct and indirect implications for the cryptocurrency market.
1. Trade Policy and Tariffs
Any changes in US–China tariffs could impact global supply chains, especially semiconductor and mining hardware industries.
Bitcoin mining equipment is heavily dependent on Chinese manufacturing companies such as Bitmain, MicroBT, and Canaan. Higher tariffs previously increased mining costs across North America.
2. Mining Industry Impact
Positive trade outcomes could:
Reduce ASIC hardware costs
Improve mining profitability
Strengthen listed mining companies
Key publicly traded miners could react strongly:
MARA
RIOT
CLSK
3. Technology and AI Cooperation
The presence of major global tech leaders and financial institutions in discussions signals potential cooperation in AI, semiconductors, and digital infrastructure.
This directly impacts crypto infrastructure, cloud mining, and blockchain scaling solutions.
4. China Crypto Policy Sentiment
While mainland China maintains restrictions on crypto trading and mining, Hong Kong’s regulatory openness has created speculation that gradual institutional crypto exposure may increase in Asia.
Even small improvements in tone can significantly improve global crypto sentiment.
Global Macro Environment and Risk Sentiment
The global economy is currently facing multiple overlapping risks:
High inflation pressure due to oil prices (+105 level)
Elevated global debt levels (~$39 trillion US debt concern)
Geopolitical instability in Middle East
Tight liquidity conditions in financial markets
High derivatives leverage in crypto markets
Despite these risks, investor sentiment remains cautiously optimistic, with approximately:
57% positive sentiment
26% negative sentiment
Remaining neutral/uncertain traders
Market Scenarios During the Summit
Bullish Scenario:
If negotiations between Trump and Xi show progress:
Improved global trade sentiment
Lower risk perception in markets
Bitcoin breakout above $82,500
Potential rally toward $85,000 – $88,000 (+4% to +8.5%)
Strong performance in equities and tech sectors
Bearish Scenario:
If tensions escalate or talks fail:
Risk-off sentiment across global markets
Bitcoin rejection from resistance
Drop toward $76,000 support (-6% downside risk)
Possible liquidation cascade below $75,000 (-7.5% extended risk zone)
Oil could spike further above $110 – $120 range
Trading Strategy Perspective
Current market conditions suggest:
High volatility expected during event window
Range-bound accumulation before breakout
Liquidity hunting likely in both directions
Breakout confirmation required for trend continuation
Risk management is critical due to leveraged positioning
Short-term traders are focusing on:
Range trading between support and resistance
Breakout confirmation entries
Tight stop-loss strategies due to macro uncertainty
Long-term investors continue focusing on:
ETF inflows
Institutional accumulation
Macro hedge narrative (Bitcoin as digital gold)
Conclusion: A Defining Macro Event for 2026 Markets
The Trump–China summit from May 13–15, 2026 represents a critical turning point for global financial markets. With Bitcoin trading above $81,000, oil above $105, gold at record highs, and geopolitical tensions ongoing, the global system is in a highly sensitive equilibrium.
Bitcoin’s key technical structure remains clear:
Resistance: $81,900 – $82,500
Upside target: $85,000 – $88,000 (+8.5%)
Support: $76,600
Critical risk zone: $75,000 (-7% downside trigger area)
Institutional demand continues to support long-term bullish sentiment, but short-term price direction will heavily depend on geopolitical outcomes.
The coming days are expected to deliver high volatility across all major asset classes. Whether diplomacy improves global risk sentiment or tensions escalate further, the market reaction will likely be sharp, fast, and decisive.
Bitcoin, oil, stocks, and gold are all now tightly linked to macro political developments, making this summit one of the most important financial events of 2026.
repost-content-media
  • Reward
  • Comment
  • Repost
  • Share
#BitcoinDominanceClimbsTo58Point5Percent
Bitcoin Dominance Climbs to 58.5%
Bitcoin dominance rising to 58.5% marks one of the most important structural shifts in the crypto market cycle. This level means that more than half of the total cryptocurrency market capitalization is now concentrated in Bitcoin alone, reflecting a strong rotation of capital away from altcoins and back into the largest and most established digital asset.
This dominance expansion is not just a statistical movement; it is a clear signal of changing investor psychology, where capital preservation, macro uncertainty, and
HighAmbition
#BitcoinDominanceClimbsTo58Point5Percent
Bitcoin Dominance Climbs to 58.5%
Bitcoin dominance rising to 58.5% marks one of the most important structural shifts in the crypto market cycle. This level means that more than half of the total cryptocurrency market capitalization is now concentrated in Bitcoin alone, reflecting a strong rotation of capital away from altcoins and back into the largest and most established digital asset.
This dominance expansion is not just a statistical movement; it is a clear signal of changing investor psychology, where capital preservation, macro uncertainty, and institutional confidence are pushing traders toward Bitcoin as the primary safe-haven asset within the crypto ecosystem.
At present, Bitcoin is trading around $81,150, after recently holding steady in a consolidation range following a strong recovery from earlier lows near $62,000, representing an overall rebound of more than +30%. During this period, Bitcoin has maintained relative strength while many altcoins have either stagnated or underperformed, which directly contributes to rising dominance levels.
Understanding the Meaning of 58.5% Bitcoin Dominance
A Bitcoin dominance level of 58.5% indicates that out of the entire crypto market valuation, Bitcoin alone controls the majority share. This is significant because it shows that liquidity is heavily concentrated into BTC, and investors are prioritizing safety, liquidity, and long-term macro positioning over high-risk speculative altcoin trades.
Historically, rising Bitcoin dominance has often appeared during periods of:
High global economic uncertainty
Rising interest rates or inflation pressure
Geopolitical instability
Institutional accumulation phases
Market transition from altcoin speculation to BTC accumulation
This current dominance spike aligns strongly with global macro conditions, including oil prices above $105, gold trading above $4,700, and ongoing geopolitical tension affecting investor sentiment across global markets.
Capital Rotation: Why Money is Flowing Into Bitcoin
One of the key drivers behind this dominance increase is capital rotation. Investors are actively moving funds from altcoins into Bitcoin due to its relative stability and institutional acceptance.
Altcoins, while offering higher upside potential, are currently experiencing lower liquidity and higher volatility, which makes them less attractive during uncertain macro conditions. On the other hand, Bitcoin is benefiting from ETF inflows, corporate treasury accumulation, and long-term institutional positioning.
Spot Bitcoin ETFs continue to attract steady inflows, and large institutional holders are increasing exposure. For example, corporate accumulation trends have pushed total BTC holdings by major entities to over 800,000 BTC levels, showing long-term conviction despite short-term volatility.
Bitcoin Market Structure at $81,000 Zone
Bitcoin is currently consolidating around the $81,150 region, forming a strong base after its multi-week recovery. The price structure shows a tightening range, indicating that the market is preparing for a potential breakout phase.
Key levels remain clearly defined:
Current Price: ~$81,150
Immediate Resistance: $81,900 – $82,500
Breakout Target Zone: $85,000 – $88,000 (+4.7% to +8.5% upside potential)
Strong Support Zone: $76,600
Critical Risk Level: $75,000
The price action suggests that Bitcoin is currently in an accumulation phase where buyers are absorbing supply, while sellers are unable to push the market into a strong breakdown. This type of structure often precedes significant directional movement, especially when combined with rising dominance.
Institutional Confidence and Market Strength
The rise in Bitcoin dominance to 58.5% also reflects growing institutional trust in Bitcoin as a macro financial asset. Large financial institutions, hedge funds, and asset managers continue to view Bitcoin as a hedge against inflation, currency devaluation, and geopolitical instability.
Recent ETF inflows have reinforced this trend, as billions of dollars continue to enter regulated Bitcoin investment products. This steady inflow of capital provides structural support for Bitcoin price stability and long-term upward momentum.
Additionally, corporate adoption continues to expand, with major firms increasing BTC exposure as part of treasury diversification strategies. This institutional layer of demand significantly reduces downside pressure compared to previous market cycles.
Macro Environment Supporting Bitcoin Strength
The global macro environment is currently highly influential in driving Bitcoin dominance higher. Several major factors are contributing to this trend:
Oil prices above $105 are increasing inflation concerns globally, putting pressure on central banks and weakening risk appetite for speculative assets. Gold rising above $4,700 reflects strong demand for safe-haven assets, and Bitcoin is increasingly being grouped within this category by institutional investors.
At the same time, global debt levels nearing $39 trillion in the United States alone are raising long-term concerns about currency stability, which further supports Bitcoin’s narrative as a decentralized store of value.
Geopolitical tensions, particularly in the Middle East, are also contributing to risk-off sentiment, pushing investors toward assets with stronger liquidity and global acceptance.
Impact on Altcoins and Market Structure
As Bitcoin dominance rises to 58.5%, altcoins typically experience relative weakness. This does not necessarily mean that altcoins are collapsing, but rather that liquidity is being concentrated into Bitcoin.
In such phases, altcoin trading becomes more selective, and only strong fundamental or narrative-driven tokens tend to outperform. Many mid-cap and low-cap tokens often remain in sideways or corrective structures during high dominance cycles.
This environment is often referred to as a “Bitcoin-led market phase,” where BTC dictates overall market direction, and altcoins follow with delayed or weaker reactions.
Market Sentiment and Trader Behavior
Current sentiment in the crypto market is cautiously optimistic but structurally Bitcoin-focused. Traders are increasingly prioritizing BTC exposure over altcoin speculation due to uncertainty in global macro conditions.
Leverage in derivatives markets remains relatively high, with open interest around $9.7 billion, indicating that volatility expansion is likely once a breakout occurs. However, the majority of positioning is now concentrated in Bitcoin rather than altcoins, reinforcing dominance strength.
Fear and Greed Index levels remain near neutral at approximately 42, suggesting that the market is not in extreme euphoria, leaving room for continued upward expansion if macro conditions remain supportive.
Price Scenarios Based on Rising Dominance
Bullish Scenario:
If Bitcoin dominance continues rising while price breaks above $82,500 resistance, BTC could accelerate toward:
$85,000 (+4.7%)
$88,000 (+8.5%)
Extended macro target above $90,000 if ETF inflows strengthen further
In this scenario, capital inflow into Bitcoin would continue draining liquidity from altcoins, further strengthening dominance above 59% or even 60%.
Bearish Scenario:
If Bitcoin fails to break resistance and dominance stalls, short-term correction could occur:
Pullback toward $76,000 (-6%)
Deeper liquidity sweep near $75,000 (-7.5%)
Temporary dominance stabilization or slight altcoin recovery
However, even in bearish conditions, institutional demand is likely to limit extreme downside risk.
Strategic Market Insight
The rise to 58.5% dominance is not just a short-term fluctuation; it reflects a broader structural shift in crypto capital allocation. Bitcoin is increasingly functioning as the core reserve asset of the crypto ecosystem, while altcoins are becoming higher-risk satellite investments.
This shift suggests that future market cycles may be increasingly Bitcoin-led, especially during periods of macro uncertainty. Traders and investors are now positioning around Bitcoin’s liquidity profile, ETF inflows, and macro hedge narrative rather than pure speculative altcoin cycles.
Conclusion: Bitcoin Strengthening Its Market Leadership
Bitcoin dominance reaching 58.5% clearly confirms that the market is entering a Bitcoin-centric phase where capital is flowing back into the most trusted and liquid digital asset. With Bitcoin trading around $81,150, supported by strong institutional inflows, ETF demand, and macro uncertainty, the overall structure favors continued BTC strength.
If momentum continues and resistance near $82,500 is broken, Bitcoin could move toward $85,000 – $88,000, further strengthening dominance and accelerating capital rotation from altcoins into BTC.
However, short-term volatility remains high, and traders should expect sharp movements as the market reacts to macroeconomic signals, geopolitical developments, and liquidity shifts.
Overall, the rising dominance to 58.5% confirms one clear message: Bitcoin is once again becoming the central anchor of the entire cryptocurrency market, and investor confidence is increasingly aligning with its long-term store-of-value narrative.
repost-content-media
  • Reward
  • Comment
  • Repost
  • Share
#GateSquareMayTradingShare
Bitcoin Market Analysis May 2026
Bitcoin is currently trading around $80,500 to $81,200 after experiencing aggressive volatility across the past several trading sessions. During the last 24 hours alone, BTC moved through multiple short-term fluctuations with declines ranging between 1% and 1.5% before stabilizing again above the psychologically important $80,000 region. Despite recent weakness, Bitcoin still remains more than 30% to 35% higher than its February 2026 lows near $60,000-$63,000, showing that long-term market momentum has not disappeared even under dif
HighAmbition
#GateSquareMayTradingShare
Bitcoin Market Analysis May 2026
Bitcoin is currently trading around $80,500 to $81,200 after experiencing aggressive volatility across the past several trading sessions. During the last 24 hours alone, BTC moved through multiple short-term fluctuations with declines ranging between 1% and 1.5% before stabilizing again above the psychologically important $80,000 region. Despite recent weakness, Bitcoin still remains more than 30% to 35% higher than its February 2026 lows near $60,000-$63,000, showing that long-term market momentum has not disappeared even under difficult macroeconomic conditions.
Although BTC remains nearly 35% below its earlier cycle peak above $126,000, the cryptocurrency continues demonstrating remarkable resilience compared to traditional risk assets. Bitcoin’s total market capitalization remains above $1.6 trillion while daily trading volume frequently fluctuates between $25 billion and $35 billion. These numbers confirm that institutional investors, hedge funds, ETFs, whales, and retail traders continue participating heavily in the market despite growing uncertainty surrounding inflation, interest rates, oil prices, and geopolitical tensions.
The biggest market-moving event recently was the release of the latest U.S. Consumer Price Index (CPI) report during May 12-13, 2026. The inflation report came significantly hotter than many economists and traders expected. Monthly inflation increased by +0.6% in April compared to March, while yearly inflation accelerated toward +3.8%, reaching the highest level since May 2023. This represented a major jump from March’s +3.3% yearly reading and immediately triggered volatility across global financial markets.
Energy prices became the primary driver behind this inflation shock. Energy inflation surged approximately +17.9% year-over-year, while gasoline prices exploded between +28% and +51% in several regions due to worsening geopolitical instability, particularly growing tensions involving Iran and disruptions affecting global oil supply chains. Oil prices moving above $100 per barrel intensified fears that inflation may remain elevated for much longer than markets originally anticipated.
Core CPI, which excludes food and energy prices, also rose above expectations with monthly growth around +0.4% and annual growth near +2.8%. Shelter inflation remained stubbornly high while food inflation continued pressuring consumers globally. Altogether, this inflation data created a strong wave of fear because it reduced expectations that the Federal Reserve would aggressively cut interest rates during 2026.
As soon as CPI data was released, the U.S. dollar strengthened aggressively while Treasury bond yields climbed higher. This environment usually creates pressure on risk assets including Bitcoin, tech stocks, and altcoins. Futures markets saw more than $300 million in liquidations as traders rapidly closed leveraged positions. Bitcoin briefly dropped below $80,000 before recovering, demonstrating that buyers still remain active during panic-driven corrections.
Federal Reserve Policy & Kevin Warsh’s Market Impact
Another major factor affecting Bitcoin is Federal Reserve policy uncertainty. Markets are now closely watching Kevin Warsh and his increasingly hawkish monetary stance. During confirmation discussions and public comments, Warsh emphasized that the Federal Reserve must remain independent while prioritizing inflation control before considering aggressive rate cuts.
This completely changed earlier market expectations.
At the beginning of 2026 many traders believed:
The Fed would cut rates multiple times
Liquidity conditions would improve quickly
Risk assets including BTC would rally aggressively
However, hotter inflation data combined with Warsh’s stricter tone forced markets to reprice expectations dramatically lower. Some market pricing models now suggest:
Only one rate cut possible in 2026
Or potentially no cuts if inflation remains persistent
Higher interest rates for longer periods create tighter financial conditions globally. Borrowing becomes more expensive, speculative appetite weakens, and liquidity expansion slows down.
Since Bitcoin often performs strongest during periods of monetary easing and abundant liquidity, this hawkish environment is creating temporary pressure on crypto markets.
Why Bitcoin Is Fluctuating So Aggressively
Bitcoin’s current volatility comes from multiple interconnected reasons happening simultaneously.
Bearish Factors Pressuring BTC
Hotter-than-expected CPI data
Rising bond yields
Stronger U.S. dollar
Geopolitical instability
Oil price surges
Fear surrounding delayed Fed cuts
Profit-taking after BTC’s rally from $60k to $80k+
Bullish Factors Supporting BTC
Continued ETF inflows
Institutional accumulation
Whale buying activity
Limited Bitcoin supply
Growing long-term adoption
Bitcoin’s hedge narrative against inflation and currency debasement
Right now the market appears trapped between macroeconomic fear and long-term institutional optimism.
Bitcoin remains consolidating between approximately:
$78,000 support
$82,000 resistance
This range is becoming one of the most important battle zones for the next major market direction.
Iran Conflict & Oil Shock — Impact On Bitcoin
Geopolitical tension involving Iran remains one of the biggest hidden risks facing global markets.
If tensions worsen further:
Oil prices may surge even higher
Inflation could remain elevated
Global markets may become defensive
Risk assets could experience short-term selling pressure
Initially this environment could hurt Bitcoin temporarily because traders often reduce exposure during uncertainty.
Under severe geopolitical escalation:
BTC could retest $78,000
Deeper correction may target $75,000-$70,000
Altcoins could fall 20% to 40%
However, over the longer term Bitcoin may actually benefit from global instability because:
Investors search for alternative assets
Fiat currencies weaken under inflation
Trust in traditional systems decreases
This strengthens Bitcoin’s “digital gold” narrative.
Trump, China & Global Market Psychology
Potential developments involving Donald Trump and economic relations with China are also influencing market sentiment.
If trade relations improve:
Supply chain stress may ease
Inflation pressure could reduce
Global markets may recover
Bitcoin could rally strongly
But if tensions worsen:
Tariffs could expand
Economic uncertainty may rise
Global risk appetite may weaken
Initially this could create temporary selling pressure in BTC and crypto markets.
ETF Inflows Continue Supporting Bitcoin
One of the strongest bullish factors remains Bitcoin ETF demand.
Institutional investors continue allocating billions into spot Bitcoin ETFs despite macro uncertainty. These inflows create powerful long-term structural support because:
Bitcoin supply becomes scarcer
Institutional ownership increases
Market maturity improves
Long-term holding behavior strengthens
Bitcoin’s fixed supply of only 21 million coins remains one of its strongest long-term bullish characteristics.
More than 20 million BTC are already mined, meaning scarcity will become increasingly important over time.
Whale Activity & Smart Money Accumulation
On-chain data shows whales and long-term holders continue accumulating during corrections.
Large investors understand that:
Fear creates opportunity
Retail traders panic emotionally
Long-term cycles remain intact
Recent blockchain data suggests:
Exchange balances continue slowly declining
Long-term wallets remain stable
Institutional accumulation remains active
Historically, this type of behavior often appears before major bullish continuation phases.
Bitcoin Price Forecast — How High Can BTC Go?
Short-Term Forecast (Next Few Weeks)
If BTC successfully breaks above:
$82,000
then $85,000
with strong trading volume, the market could quickly target:
$86,000
$90,000
possibly $95,000
This would represent approximately:
6% to 15% upside from current levels
Medium-Term Forecast (Late 2026)
Conservative projections:
$90,000-$100,000
Moderate bullish projections:
$120,000-$150,000
Aggressive cycle-based projections:
$170,000+
A move from current prices toward $150,000 would represent roughly:
85% to 100% upside
which remains possible considering Bitcoin’s historical volatility patterns.
Bullish Scenario — What Could Trigger A Massive BTC Rally?
The bullish scenario becomes stronger if:
Inflation starts cooling
Oil prices stabilize
Fed hints toward future cuts
ETF inflows accelerate
Global liquidity improves
Geopolitical tensions ease
Under this scenario:
BTC could reclaim $100,000
Institutional FOMO may intensify
Altcoins could experience explosive rallies
Market confidence may return rapidly
Bearish Scenario — What Could Send BTC Lower?
The bearish scenario remains possible if:
Inflation stays above 3.5%
Fed maintains strict policy
Iran tensions worsen
Oil prices continue climbing
Equity markets weaken aggressively
Under this situation:
BTC could revisit $75,000
Extreme fear may push price toward $70,000
Altcoins may experience severe corrections
However, many analysts still view major corrections as long-term accumulation opportunities.
Trading Strategy & Professional Market Plan
Conservative Investor Strategy
For long-term investors:
Use Dollar-Cost Averaging (DCA)
Accumulate gradually between $75k-$78k
Avoid emotional panic selling
Focus on multi-year growth
Long-term targets:
$100k
$120k
$150k+
Aggressive Trader Strategy
For experienced traders:
Trade confirmed breakouts
Monitor CPI and Fed news daily
Use tight stop losses
Avoid excessive leverage
Bullish breakout above $85k:
Momentum toward $90k-$100k
Bearish breakdown below $78k:
Risk toward $70k
Risk Management Rules
Professional traders survive because they control risk carefully.
Important principles:
Risk only 1%-2% per trade
Never overleverage emotionally
Secure profits gradually
Protect capital first
Avoid revenge trading
Most traders lose accounts not because of bad analysis — but because of poor emotional discipline.
Long-Term Bitcoin Outlook
Despite current volatility, Bitcoin’s long-term foundation remains extremely strong.
Major strengths include:
Fixed supply of 21 million
Expanding institutional adoption
Growing ETF infrastructure
Increasing global recognition
Strong scarcity narrative
Hedge against monetary debasement
Historically Bitcoin has repeatedly:
Survived major crashes
Recovered strongly
Reached new all-time highs
Expanded adoption globally
Final Market Conclusion
Bitcoin in May 2026 stands at a critical crossroads between inflation fears and long-term institutional transformation.
The market currently faces:
Hot inflation data
Federal Reserve uncertainty
Oil market instability
Iran geopolitical tensions
Stronger dollar pressure
Delayed rate-cut expectations
Yet simultaneously:
ETFs continue accumulating
Whales remain active
Long-term adoption keeps growing
Scarcity dynamics strengthen
Near-term volatility between:
$75,000
$85,000
may continue aggressively before the next major breakout emerges.
If macro conditions stabilize and inflation begins cooling later in 2026, Bitcoin could rapidly move toward:
$100,000
$120,000
potentially much higher over future cycles.
For now, traders should focus on:
patience
disciplined execution
risk management
macro awareness
emotional control
because Bitcoin’s next major move could shape the future direction of the entire crypto market for years ahead.
repost-content-media
  • Reward
  • Comment
  • Repost
  • Share
  • Pinned