Z谋谋nxcrypto

vip
Airdrop Hunter
Memecoin Hunter
On-chain Analyst
Crypto Farmer
$JNJ A legal storm just scored a direct hit, yet this healthcare giant refuses to fall. Johnson & Johnson absorbed a blow after a Texas bankruptcy court rejected its structured settlement plan for talc lawsuits. The stock, trading at $225.33, held firm above its critical 200-day moving average of $211.62. This resilience points to a safe harbor, not a sinking ship.
🔹 Temporary legal fog cannot silence a roaring operational engine. The revenue loss from patent expirations on drugs like Stelara is being rapidly offset by powerful growth in the oncology segment. This portfolio transformation is
JNJ-2.34%
SaharaDreams
$JNJ A legal storm just scored a direct hit, yet this healthcare giant refuses to fall. Johnson & Johnson absorbed a blow after a Texas bankruptcy court rejected its structured settlement plan for talc lawsuits. The stock, trading at $225.33, held firm above its critical 200-day moving average of $211.62. This resilience points to a safe harbor, not a sinking ship.
🔹 Temporary legal fog cannot silence a roaring operational engine. The revenue loss from patent expirations on drugs like Stelara is being rapidly offset by powerful growth in the oncology segment. This portfolio transformation is so strong that the consensus earnings estimate for 2026 has been raised to $11.57 per share. The company is not simply shrinking; it is restructuring profitably.
🔹 The technical picture shows the scars of a short-term storm, but the defensive line holds. With a market capitalization of $542.4 billion and a dividend yield of 2.38%, JNJ remains a shelter for funds fleeing technology-driven volatility. The recent selling pressure is a healthy breather, not a panic.
A giant clearing a legal hurdle, closing a patent cliff with oncology strength, and sustaining a reliable cash flow stream. Do you keep this kind of defensive insurance in your portfolio?
⚠️ Not financial advice.
👉 DYOR ☑️
  • Reward
  • Comment
  • Repost
  • Share
Tokenized Reality?
$XLM just detonated 24% in a single session, capping a 43% weekly surge that left the broader market in the dust. The catalyst is not a rumor or a meme—it is a direct pipeline into the $2.3 quadrillion machinery of Wall Street settlement. Stellar’s landmark partnership with #DTCC is pulling the future of tokenized stocks, #ETFs, and Treasuries into the present, and the market is repricing the entire #RWA narrative in real time.
🔹 The RWA comeback is no longer a question—it is a structural migration. #Tokenized U.S. Treasuries have swelled to $13.7 billion, tokenized commodi
XLM4%
RWA-2.12%
Sand谋3S
Tokenized Reality?
$XLM just detonated 24% in a single session, capping a 43% weekly surge that left the broader market in the dust. The catalyst is not a rumor or a meme—it is a direct pipeline into the $2.3 quadrillion machinery of Wall Street settlement. Stellar’s landmark partnership with #DTCC is pulling the future of tokenized stocks, #ETFs, and Treasuries into the present, and the market is repricing the entire #RWA narrative in real time.
🔹 The RWA comeback is no longer a question—it is a structural migration. #Tokenized U.S. Treasuries have swelled to $13.7 billion, tokenized commodities crossed $5.1 billion, and the total on-chain real-world asset market now exceeds $34 billion. Stellar’s DTCC collaboration plugs blockchain settlement directly into the core plumbing of U.S. securities markets, transforming a theoretical use case into scheduled infrastructure. This is not a narrative revival; it is the acceleration phase of a multi-trillion-dollar shift.
🔹 The technical dashboard is flashing green with a caution light. XLM smashed through the $0.18 resistance with volume exploding past $1.7 billion, confirming genuine accumulation. Yet the RSI on 4-hour and daily charts has surged deep into overbought territory, and a 4-hour MACD divergence hints at near-term exhaustion. The $0.18 breakout level now serves as the critical floor—a successful retest would transform former resistance into a springboard for the next leg higher. Chasing the candle top carries risk; a disciplined pullback that holds support offers a higher-probability entry.
🔹 U.S. stock tokenization is rapidly becoming the next super-topic. Tokenized equities have rocketed to a $1.6 billion market cap, growing 40x year-over-year, while derivatives volume hit all-time highs above $3.5 billion. Nasdaq approved tokenized Russell 1000 trading, the SEC’s Innovation Exemption provides a regulatory pathway, and DTCC’s embrace of Stellar signals that the world’s largest securities depository is now building the on-chain rails. When the infrastructure that settles over $114 trillion annually targets a 2027 launch for tokenized assets, the conversation shifts from “if” to “how fast.”
XLM is not riding a speculative wave—it is anchoring the infrastructure layer where traditional finance meets blockchain settlement. The DTCC partnership validates the thesis, the volume confirms conviction, and the tokenization supercycle is still in its earliest innings. Are you positioning for the pullback to $0.18 as a gift, or riding the momentum toward $0.25 and beyond?
⚠️ Not financial advice.
  • Reward
  • Comment
  • Repost
  • Share
#TradeCFDWinGold
$971 Chip. $47 Cure.
The chasm between legacy and innovation has never been wider on American exchanges. As May 2026 closes, we are witnessing a brutal divergence: artificial intelligence infrastructure is minting trillion-dollar monarchs, while biotech pioneers scrape the bargain bin. The market is ruthlessly voting for the picks-and-shovels of the A.I. gold rush, and the story is told in the cold, hard prices of these five giants.
🔹 $MU — The Memory Monarch Takes the Crown
Micron crossed the $1 trillion market cap threshold for the first time this week, a historic moment t
XAUUSD0.99%
Sand谋3S
#TradeCFDWinGold
$971 Chip. $47 Cure.
The chasm between legacy and innovation has never been wider on American exchanges. As May 2026 closes, we are witnessing a brutal divergence: artificial intelligence infrastructure is minting trillion-dollar monarchs, while biotech pioneers scrape the bargain bin. The market is ruthlessly voting for the picks-and-shovels of the A.I. gold rush, and the story is told in the cold, hard prices of these five giants.
🔹 $MU — The Memory Monarch Takes the Crown
Micron crossed the $1 trillion market cap threshold for the first time this week, a historic moment that has analysts scrambling to catch up. The stock is now at $971.00 after smashing earnings estimates by over 40%. The secret? The entire 2026 supply of high-bandwidth memory is sold out. Analysts at MarketWise are now whispering about a $2,500 long-term target, arguing that this is no longer a cyclical stock but a structural A.I. utility.
🔹 #TSM — The Geopolitical Tollbooth
Taiwan Semiconductor sits at $418.45, up a staggering 117% year-over-year and hugging its all-time highs. Owning 72% of the global foundry market, TSMC just raised 3nm prices by 15% and cranked its CapEx to the top of its $56 billion range. You can't build A.I. without chips, and you can't build cutting-edge chips without TSMC. That is not a narrative; it is a geographical monopoly.
🔹 $JNJ — The Quiet Fortress
At $225.46, Johnson & Johnson is doing what defensive giants do: surviving. With a 2.18% dividend yield and a 12% year-to-date rise, it is the adult in the room. While facing the Stelara patent cliff, the MedTech and oncology pipelines are plugging the holes, making this a favorite for those seeking shelter from the tech sector's manic swings.
🔹 $MMM — The Legal Anchor
3M is stuck in the mud at $153.13, weighed down by the PFAS "forever chemicals" legacy in Australia. Despite operational improvements, the stock is down from its February high of $173. Analysts call it a "Hold" with an average target of $172.20, but until the legal fog clears, this is a yield play handcuffed by the past.
🔹 $MRNA — The Pipeline Roulette
Moderna has collapsed to $47.23, a painful fall for the pandemic darling. The COVID cash cow is gone, and the pivot to cancer vaccines and RSV combinations is an expensive bet. The short-term charts are weak. The long-term fate rests entirely on FDA clinical results. This is a high-risk biotech lottery ticket at a deep discount.
The gulf between A.I. hardware and struggling biotech is the defining feature of this market. Micron sells shovels; Moderna searches for miracles. Right now, the crowd is sprinting toward the hardware that builds the future while cautiously watching the science that heals it.
How are you positioning in this extreme divergence—doubling down on the A.I. infrastructure boom, or quietly accumulating the beaten-down innovators waiting for their clinical breakthrough?
⚠️ Not financial advice.
  • Reward
  • Comment
  • Repost
  • Share
#AnthropicValuationHits965BillionDollars
$965B AI Lab?
Anthropic just absorbed $65 billion in a single raise, catapulting its valuation to $965 billion and becoming the most valuable private company in history. The AI safety pioneer that built Claude now carries a price tag larger than the GDP of most nations — and a 70% probability of an IPO before the year ends.
🔹 The funding round attracted sovereign wealth funds, pension giants, and strategic cloud partners who view frontier AI as critical national infrastructure. The company's annualized revenue sprinted from $15 billion to $31.5 billio
User_any
#AnthropicValuationHits965BillionDollars
$965B AI Lab?
Anthropic just absorbed $65 billion in a single raise, catapulting its valuation to $965 billion and becoming the most valuable private company in history. The AI safety pioneer that built Claude now carries a price tag larger than the GDP of most nations — and a 70% probability of an IPO before the year ends.
🔹 The funding round attracted sovereign wealth funds, pension giants, and strategic cloud partners who view frontier AI as critical national infrastructure. The company's annualized revenue sprinted from $15 billion to $31.5 billion in under five months, driven by multi-year enterprise contracts that provide visibility rare among high-growth tech firms.
🔹 The IPO signal is strengthening fast. With a 70% chance of a public debut this year, Anthropic would arrive on markets as the largest technology listing in history. The capital raised will fund the next generation of safety-focused models and expand the compute infrastructure required to train them.
🔹 The broader AI supercycle continues accelerating. Hyperscaler capex forecasts for 2026 have been revised upward repeatedly, with the five largest cloud providers now projected to spend over $690 billion combined. Anthropic's rise reflects the structural reordering of global capital toward artificial intelligence.
A safety-focused research lab becoming a $965 billion titan with public markets on the horizon — the AI economy is not waiting for permission. How are you positioning for the wave of AI-driven value creation that is still in its earliest innings?
#StockTradingChallengeUpTo17000U #TradeCFDWinGold
repost-content-media
  • Reward
  • Comment
  • 1
  • Share
#WTICrudeFallsBelow90Dollars $XTIUSD
Oil markets just lost a major psychological level.
WTI crude dropped below $90 as traders reacted to cooling geopolitical fears, rising recession concerns, and profit-taking after weeks of extreme volatility.
🔹 The energy market is shifting fast
Recent easing in Middle East escalation headlines reduced some of the panic premium that pushed oil above triple digits earlier this month.
At the same time:
➡️ Strategic reserve releases continue increasing supply visibility
➡️ Global growth concerns are pressuring demand expectations
➡️ Traders are repositioning
XTIUSD-1.02%
User_any
#WTICrudeFallsBelow90Dollars $XTIUSD
Oil markets just lost a major psychological level.
WTI crude dropped below $90 as traders reacted to cooling geopolitical fears, rising recession concerns, and profit-taking after weeks of extreme volatility.
🔹 The energy market is shifting fast
Recent easing in Middle East escalation headlines reduced some of the panic premium that pushed oil above triple digits earlier this month.
At the same time:
➡️ Strategic reserve releases continue increasing supply visibility
➡️ Global growth concerns are pressuring demand expectations
➡️ Traders are repositioning aggressively after crowded long exposure
🔹 What analysts are watching now
The $90 zone was a key support area for short-term bullish momentum.
Breaking below it opens attention toward:
🟠 Lower liquidity zones
🟠 Demand slowdown fears
🟠 Cooling inflation expectations
Meanwhile Brent crude and Murban crude also pulled back as volatility spread across the broader commodities market.
🔹 Macro markets reacted immediately
Lower oil prices are already influencing:
▪️ Inflation forecasts
▪️ Bond yields
▪️ Fed rate expectations
▪️ Equity sentiment
▪️ Crypto volatility
Energy remains one of the strongest macro drivers for global markets right now.
🔹 The bigger question
Is this a healthy cooldown after panic buying…
Or the first signal that global demand is weakening faster than expected?
One geopolitical headline can still reverse the entire move within hours.
Oil markets remain extremely sensitive.
Please always DYOR.
⚠️ Not financial advice.
Friends, does crude stabilize below $90, or is another explosive rebound loading quietly in the background?
repost-content-media
  • Reward
  • Comment
  • Repost
  • Share
#btc
BTC Market Analysis — Critical Recovery Zone or Temporary Rebound?
BTC continues moving inside a highly sensitive price structure after experiencing strong selling pressure across higher time frames. Over the last 24 hours, price fluctuated between 73,212.7 and 74,143.6, showing limited recovery momentum while still remaining under broader bearish pressure. Although the daily change stayed slightly positive, the weekly structure still reflects a notable decline, keeping overall market sentiment cautious.
On the short-term charts, especially the 15-minute structure, momentum indicators ar
BTC-0.33%
discovery
#btc
BTC Market Analysis — Critical Recovery Zone or Temporary Rebound?
BTC continues moving inside a highly sensitive price structure after experiencing strong selling pressure across higher time frames. Over the last 24 hours, price fluctuated between 73,212.7 and 74,143.6, showing limited recovery momentum while still remaining under broader bearish pressure. Although the daily change stayed slightly positive, the weekly structure still reflects a notable decline, keeping overall market sentiment cautious.
On the short-term charts, especially the 15-minute structure, momentum indicators are beginning to turn upward. Buyers are attempting to build a local recovery base after the aggressive decline toward the 72,450 region. Increasing volume during the rebound phase suggests fresh capital participation rather than weak reaction buying. This improves the probability of a short-term continuation move toward higher resistance zones.
However, the broader technical picture remains fragile.
The 4-hour structure still shows lower highs and lower lows, meaning the dominant trend has not yet fully reversed. Price remains below key trend-control areas, and volatility bands continue expanding downward, reflecting unstable momentum conditions. The middle Bollinger region around the 73,600 – 73,700 area is currently acting as an important battlefield between buyers and sellers.
Daily RSI hovering near 37 indicates BTC is approaching oversold territory. Historically, these levels often trigger temporary relief rallies, especially when accompanied by rising volume and weakening downside momentum. In addition, MACD bottom divergence formation suggests selling pressure may be slowing down gradually. This does not automatically confirm reversal, but it increases the probability of a medium-term stabilization phase.
Important Support Zones
72,450 → Strong reaction support and recent liquidity sweep area
71,800 – 71,200 → Major defensive zone for buyers
70,000 psychological level → Critical macro structure support
If BTC loses the 72K region with strong selling volume, fear across the market could intensify rapidly and trigger another wave of liquidations.
Resistance Levels to Watch
74,500 → Immediate short-term resistance
75,800 – 76,300 → Key supply region
77,400+ → Strong trend confirmation zone
A successful breakout above the upper resistance cluster with sustained volume could shift short-term sentiment back toward bullish control. Until then, recovery attempts may still face heavy selling pressure from trapped market participants.
Market Psychology
Current market conditions reflect uncertainty rather than panic. Large participants appear to be accumulating selectively near discounted regions while retail sentiment remains hesitant after recent volatility. This creates a high-risk, high-opportunity environment where sudden directional moves become more likely.
The recent bounce from the lower Bollinger Band also indicates that sellers may be temporarily exhausted in the short term. Still, without confirmation from higher time frames, aggressive optimism remains risky.
Key Signals Moving Forward
Volume continuation during upward movement
RSI recovery above neutral levels
MACD bullish crossover confirmation
Price reclaiming higher trend-control zones
Stability above 74.5K
If these signals align together, BTC could attempt a broader recovery phase. Otherwise, current movement may remain only a technical rebound inside a larger corrective structure.
At this stage, volatility remains elevated, liquidity hunts are frequent, and emotional trading becomes increasingly dangerous. Patience, risk control, and confirmation-based positioning continue to be the most important factors under current market conditions.$BTC
repost-content-media
  • Reward
  • Comment
  • Repost
  • Share
Turnaround Brewing?
The legal ghosts of the past are still rattling their chains, but 3M's operational engine is humming again. The stock clawed its way from $142.50 to $153.13 during May, delivering a dose of industrial resilience that has become rare in a market obsessed with pure AI plays.
🔹 The company is leaner and sharply refocused after the strategic separation of its healthcare unit, Solventum. 3M now trades as a pure-play industrial powerhouse, concentrating on the advanced materials, safety equipment, and manufacturing consumables that form the backbone of global infrastructure. Thi
MMM0.18%
discovery
Turnaround Brewing?
The legal ghosts of the past are still rattling their chains, but 3M's operational engine is humming again. The stock clawed its way from $142.50 to $153.13 during May, delivering a dose of industrial resilience that has become rare in a market obsessed with pure AI plays.
🔹 The company is leaner and sharply refocused after the strategic separation of its healthcare unit, Solventum. 3M now trades as a pure-play industrial powerhouse, concentrating on the advanced materials, safety equipment, and manufacturing consumables that form the backbone of global infrastructure. This clarity of purpose is quietly attracting value investors who see through the legal noise.
🔹 The earnings power is real and currently undervalued. The company is generating earnings per share of $5.18, supported by operational efficiency gains and a more disciplined cost structure. The P/E ratio of 29.54 suggests the market is cautiously pricing in a recovery, not pricing in peak performance. The dividend yield of 2.04% provides a steady income stream while investors wait for the legal overhang to clear.
🔹 The PFAS challenge in Australia is significant, but it is a known quantity—a measurable liability, not an unquantifiable risk. The market often overreacts to headlines while underappreciating balance sheet fortification. 3M has been aggressively provisioning for these liabilities, and the focus is shifting from the size of the problem to the pace of resolution. Institutional analysts have placed a "Hold" rating on the stock, signaling that the downside is largely factored in and the upside depends on legal clarity.
🔹 The chart is painting a quiet base. The recovery from $142.50 shows buyers stepping in at support, and a sustained move above the $155 level would signal that accumulation is outpacing legal fear. The 200-day moving average sits as the next major test, and a break above it would attract momentum capital that has so far ignored the industrial sector.
An industrial titan trading at a discount, paying a dividend, and methodically clearing its legal decks. The headlines scream risk, but the balance sheet whispers recovery. Are you the kind of investor who buys when the fog is still thick, or do you wait for the skies to fully clear?
#TradFi交易分享挑战 $MMM
⚠️ Not financial advice. ‌
  • Reward
  • Comment
  • Repost
  • Share
#DailyPolymarketHotspot
The latest prediction market movement surrounding the UEFA Champions League title race is becoming one of the hottest discussions among football analysts and market participants. Current probability models place PSG slightly ahead with nearly 59% implied confidence, while Arsenal continues to gain momentum with strong market support around 43%. The narrowing gap shows that confidence across the market is far from absolute, and volatility in expectations remains extremely high.
PSG enters this phase with one of the most complete attacking systems in Europe. Their recent
PSG-10.34%
ASR-1.81%
discovery
#DailyPolymarketHotspot
The latest prediction market movement surrounding the UEFA Champions League title race is becoming one of the hottest discussions among football analysts and market participants. Current probability models place PSG slightly ahead with nearly 59% implied confidence, while Arsenal continues to gain momentum with strong market support around 43%. The narrowing gap shows that confidence across the market is far from absolute, and volatility in expectations remains extremely high.
PSG enters this phase with one of the most complete attacking systems in Europe. Their recent performances have shown improved tactical discipline, faster transitions, and greater control in high-pressure matches. The squad depth, combined with experience in knockout-stage football, explains why prediction markets currently favor them. Market confidence also increased after several dominant victories where PSG demonstrated both offensive efficiency and defensive stability against elite opponents.
However, Arsenal’s rise is impossible to ignore.
The English side has transformed into one of the most aggressive pressing teams in modern football. Their young core continues showing maturity beyond expectations, while their midfield structure has become one of the strongest tactical weapons in European competition. Analysts increasingly believe Arsenal’s energy, tempo control, and defensive organization could create serious problems even for technically superior opponents.
Recent football discussions across Europe suggest many professional observers view this final stage as a clash between experience and momentum. PSG carries the weight of expectation and star-level composure, while Arsenal represents tactical evolution, hunger, and psychological confidence.
One of the biggest reasons prediction markets remain divided is the unpredictable nature of finals themselves. Historically, possession statistics, squad value, and previous tournament records often lose importance once pressure reaches maximum intensity. Small moments, individual mistakes, tactical substitutions, or emotional resilience frequently decide outcomes at this level.
From a strategic perspective, PSG may attempt to slow the rhythm and rely on positional dominance, while Arsenal will likely prefer vertical attacks, aggressive pressing phases, and transitional speed. If Arsenal manages to disrupt PSG’s midfield control early, market probabilities could shift dramatically in real time.
Another critical factor is mentality.
PSG faces enormous pressure to finally convert years of investment into ultimate European success. Arsenal, meanwhile, enters with less psychological burden and growing belief from supporters and analysts alike. In high-stakes environments, emotional balance can become more important than pure technical quality.
Prediction markets currently reflect a very narrow edge rather than overwhelming certainty. While PSG remains the statistical favorite, Arsenal’s tactical flexibility and recent form make this one of the most balanced title races in recent years.
At the current stage, the smartest interpretation may not be choosing the “biggest name,” but identifying which team can better handle pressure, adapt during momentum swings, and capitalize on decisive moments when the final reaches its most chaotic phase
.$PSG $ASR
repost-content-media
  • Reward
  • Comment
  • Repost
  • Share
#xlm
$XLM side saw a strong rise in the last 24 hours, and it clearly shows how fast the renewed Real World Assets and tokenized stocks story is being priced in the market. Looking at the chart side, above all in the 4-hour frame, the bold break of the Bollinger upper line shows buyer push has grown by a big share. The move from the 0.14 zone to 0.22 level in a short time comes not only from quick trades, but also from big-player hopes fed by the power of the story.
The progress of the Stellar system with legacy finance giants in the token space built a key mental line in the market. Becaus
XLM4%
RWA-2.12%
SinCity
#xlm
$XLM side saw a strong rise in the last 24 hours, and it clearly shows how fast the renewed Real World Assets and tokenized stocks story is being priced in the market. Looking at the chart side, above all in the 4-hour frame, the bold break of the Bollinger upper line shows buyer push has grown by a big share. The move from the 0.14 zone to 0.22 level in a short time comes not only from quick trades, but also from big-player hopes fed by the power of the story.
The progress of the Stellar system with legacy finance giants in the token space built a key mental line in the market. Because chain tech is no longer just a transfer tool; it is now seen as the new money base where shares, bonds, funds, and real-world assets will go digital. Above all, rising focus on tokenized stock products in the U.S. side put payment and asset-move projects like $XLM back on the table.
The most key point on the chart is the sharp break backed by volume. The big jump in 24-hour trade size hints that the move did not come only from small buyer thrill. But on the tech side, price now runs in a very stretched zone. The first hard push back from 0.223 may show short-term traders have begun to take gains.
So, should one chase here, or wait for a pullback?
After such sharp climbs, the market tends to show two paths:
• Strong trend holds, and price tries a new high after a brief pause • Or, due to an overbought zone, a sharp drop comes and late buyers get stuck
Right now, the 0.19–0.20 zone looks like a key hold for $XLM in the near term. If price stays above this area, the market may price the RWA theme with more force. But if volume drops and push fades, a short-term pullback would not be odd.
The big query is this: Can tokenized stocks be the next huge wave?
I think the market now takes this chance far more to heart than before. Because the lines between legacy finance and crypto are fading fast. People talk of a setup where markets run 24/7, shares can be bought in parts, and all deals run on-chain. In that case, quick and low-cost chains like Stellar can step up once more.
In short, the current rise does not look like only a tech pump. Behind it sits a strong story, big-player focus, and hopes for a money shift ahead. New news flow into the RWA space in the time ahead may move not only $XLM, but all token-focused projects.
#wld #AIA.
  • Reward
  • Comment
  • 1
  • Share
The cold wind that started blowing last week just turned into a gale. BlackRock's IBIT—the flagship institutional gateway to Bitcoin—just hemorrhaged $528 million in a single day. It is the second-largest daily outflow since the fund launched, and it dragged Bitcoin below the $73,000 support. The "easy" institutional bid has vanished, leaving pure conviction as the only thing holding the floor.
🔹 The cascade accelerated on May 28 when the broader spot Bitcoin ETF complex shed $733 million. The bleeding is no longer isolated to a single fund; it is systemic across the complex. Over the past tw
IBIT0.07%
BTC-0.33%
Sand谋3S
The cold wind that started blowing last week just turned into a gale. BlackRock's IBIT—the flagship institutional gateway to Bitcoin—just hemorrhaged $528 million in a single day. It is the second-largest daily outflow since the fund launched, and it dragged Bitcoin below the $73,000 support. The "easy" institutional bid has vanished, leaving pure conviction as the only thing holding the floor.
🔹 The cascade accelerated on May 28 when the broader spot Bitcoin ETF complex shed $733 million. The bleeding is no longer isolated to a single fund; it is systemic across the complex. Over the past two trading weeks, cumulative outflows have soared past $2.6 billion. The heatmap of fund flows is almost entirely red, signaling that institutional capital is retreating in lockstep rather than rotating between products. The market is absorbing sustained, daily selling pressure from the same funds that once lifted it to all-time highs.
🔹 Macro tensions are the spark. The U.S. strike on southern Iran and the White House's denial of a peace framework triggered a violent risk-off purge. Bitcoin, acting as a high-beta risk asset alongside equities, tumbled below $74,500 and is now testing the resolve of holders near $72,500. The correlation to gold remains elevated at 85%, but during the panic flush, digital gold sold off while physical gold held firm—confirming that institutional positioning, not Bitcoin's fundamental thesis, is driving the tape.
🔹 Yet a quiet counterweight is building. While ETFs dump, long-term holders and whales are absorbing the supply. Exchange reserves have fallen to seven-year lows. Wallets holding significant BTC accumulated heavily through May, and on-chain data reveals the tightest supply squeeze since the pre-ETF era. The paper market is panicking; the physical market is stacking.
A record paper exit clashing with a historic supply choke. The ETF heatmap is a fiery red, but the on-chain supply map is a cool blue. Bitcoin is pricing in a recession that hasn't arrived, and the divergence between institutional flows and holder conviction has rarely been this stark. Will the ETF storm define the summer, or will the re-accumulation prove to be the real signal beneath the noise?
#24h加密合约清算破4亿美元
$BTC
  • Reward
  • Comment
  • Repost
  • Share
$BTC 13th Giant
Bitcoin is sitting at the same table as the world's most valuable companies—and it's quietly tightening the spring. A $1.46 trillion market cap places it as the 13th largest asset on the planet, nestled comfortably among titans like TSMC, Broadcom, Tesla, and Saudi Aramco. The ranking is a quiet flex, and the next move is building.
🔹 The consolidation zone between $66,000 and $80,000 is growing historically significant. Supply distribution across the network has leveled out, with nearly half of all holders positioned at cost bases that form a powerful support cluster. The mark
BTC-0.33%
SaharaDreams
$BTC 13th Giant
Bitcoin is sitting at the same table as the world's most valuable companies—and it's quietly tightening the spring. A $1.46 trillion market cap places it as the 13th largest asset on the planet, nestled comfortably among titans like TSMC, Broadcom, Tesla, and Saudi Aramco. The ranking is a quiet flex, and the next move is building.
🔹 The consolidation zone between $66,000 and $80,000 is growing historically significant. Supply distribution across the network has leveled out, with nearly half of all holders positioned at cost bases that form a powerful support cluster. The market is absorbing every shakeout and building a foundation that could support the next structural leg higher.
🔹 Patience is the play. A full 40% of market participants are positioned at higher cost bases, a setup that often precedes a breakout as sellers exhaust and accumulators step in. The lower end of the range forms a dense buyer zone where conviction has repeatedly overwhelmed fear, and the upper boundary is thinning as resistance gets tested time and again.
🔹 The macro context frames this consolidation in a compelling light. With global equities at all-time highs, small caps surging at their best pace since 1991, and regulatory clarity advancing through the Clarity Act, the broader risk environment remains supportive. Digital gold is coiling while traditional markets rally—and that divergence rarely stays quiet for long.
A $1.46 trillion base camp, a compressed trading range, and a global economy that is warming to risk. Bitcoin is writing its next chapter in the company of giants, and the breakout—when it comes—is being forged in the patience of this very moment. How are you reading this consolidation: a launchpad for the next climb, or a range that still needs time to settle?
#StockTradingChallengeUpTo17000U
  • Reward
  • Comment
  • Repost
  • Share
#TradeCFDWinGold
In periods when risks are redefined in the global financial markets, and macroeconomic data and geopolitical developments set the direction, the strategic importance of safe haven assets becomes much more prominent. For professionals seeking to benefit from price movements instantly by stepping outside traditional investment patterns, forward contracts offer unique solutions in terms of liquidity and flexibility. Especially, precious metals, which are recognized globally as the most durable store of value, play a leading role in capital growth and portfolio balancing moves by
SaharaDreams
#TradeCFDWinGold
In periods when risks are redefined in the global financial markets, and macroeconomic data and geopolitical developments set the direction, the strategic importance of safe haven assets becomes much more prominent. For professionals seeking to benefit from price movements instantly by stepping outside traditional investment patterns, forward contracts offer unique solutions in terms of liquidity and flexibility. Especially, precious metals, which are recognized globally as the most durable store of value, play a leading role in capital growth and portfolio balancing moves by investors with high financial literacy.
The Safe Haven Role of Precious Metals and Market Context
Gold, accepted for centuries as the strongest shield against global economic shocks, inflationary pressures, and currency devaluations, maintains its strategic significance in today’s modern trading world. Changes in central banks’ reserve policies, interest rate cycles, and fluctuations in the global supply chain create strong and dynamic movement opportunities in the ounce price of this precious metal.
[A futuristic glowing gold bar representing safe-haven assets in modern trading]
For a professional trader, these fluctuations mean significant opportunities to be managed directly based on price expectations, without dealing with additional costs of physical buying and selling processes, storage risks, and high spreads.
Managing Opportunities in Ounce Price with Dual Dynamics
In classic spot asset management, profits depend solely on rising prices, but modern contracts give investors directional freedom. This flexible system allows active participation not only during upward trends but also during sharp pullbacks and correction phases of the precious metal.
Bullish Expectation (Long Position): During periods of escalating geopolitical risks or discussions of interest rate cuts, buy positions are preferred to evaluate the upward momentum in the ounce price.
Bearish Expectation (Short Position): In scenarios where strong employment data, rising bond yields, or continued tight monetary policies suppress the ounce price, profits can be generated through short-selling strategies or existing physical portfolios can be hedged for protection.
Leverage Amplifier and Risk Discipline in Precious Metal Transactions
The precious metals market is one of the areas with the highest liquidity and the most stable response to technical analysis data. Thanks to the leverage system offered by forward contracts, even small percentage changes in the ounce price enable maximum capital efficiency and high-volume trading.
However, the high volatility (fluctuations) that gold exhibits periodically requires this power to be managed with strict discipline. A successful portfolio manager closely follows the macroeconomic calendar, avoiding emotional analysis. They determine support and resistance levels in light of global inflation rates, unemployment data, and statements from central bank governors. By placing stop-loss orders with millimeter precision, they safeguard capital.
Strategic Diversification and Enhancing the Portfolio with Precious Rewards
The secret to lasting success in modern finance is not putting all eggs in one basket. While trading global stock indices, technology shares, or energy commodities, always allocating a portion of the portfolio to proven, reliable precious metals optimizes risk.
Investors who use data-driven analysis methods, proceed with patience and discipline, and interpret the dynamic cycles of the markets correctly, achieve the comfort of managing their financial decisions with maximum efficiency. Operations conducted in accordance with risk management principles are the most professional way to capture liquidity in global markets and reap financial success rewards.
  • Reward
  • Comment
  • Repost
  • Share
#WTICrudeFallsBelow90Dollars
Peace or Trap?
WTI crude just crashed through the $90 floor, landing at $89.81—a level that feels like a ceasefire gift to a global economy starved for cheaper energy. The White House confirmed a memorandum of understanding with Iran is now a reality, and traders are sprinting to reprice risk. But beneath this euphoric plunge, inventories are dangerously thin and macro demand is softening. The divergence between the peace premium and physical reality has rarely been this stark.
1️⃣ The Fragile Consensus Reshaping the Middle East
The MoU, brokered through Pakistan,
SaharaDreams
#WTICrudeFallsBelow90Dollars
Peace or Trap?
WTI crude just crashed through the $90 floor, landing at $89.81—a level that feels like a ceasefire gift to a global economy starved for cheaper energy. The White House confirmed a memorandum of understanding with Iran is now a reality, and traders are sprinting to reprice risk. But beneath this euphoric plunge, inventories are dangerously thin and macro demand is softening. The divergence between the peace premium and physical reality has rarely been this stark.
1️⃣ The Fragile Consensus Reshaping the Middle East
The MoU, brokered through Pakistan, links a 60-day truce to a phased reopening of the Strait of Hormuz. The framework is a genuine breakthrough, yet the historical pattern is unequivocal: breakthroughs in this conflict are often followed by military incidents that test the deal's durability within days. The situation will likely stabilize in incremental steps—a brief window of calm as oil flows resume, punctuated by the risk of another strike-and-retaliation cycle that keeps risk premiums from fully evaporating.
2️⃣ The Great Oil Tug-of-War: Supply Fears vs. Demand Scars
Short-term, the technical breakdown below $90 opens a path toward the mid-$80s as the "war bid" deflates. However, a structural floor is already rising to meet this decline. U.S. commercial crude inventories remain stubbornly tight, having posted their sixth consecutive weekly draw. As ANZ strategist Daniel Hynes noted, "Oil supply remains constrained, and key sticking points have yet to be resolved." The market is caught between the weight of a slowing global economy and a low-inventory buffer that will violently amplify any supply disruption.
Bulls have the physical barrel count on their side. Bears have diplomacy on theirs. Crude is at the epicenter of a $90 standoff, and the next move depends entirely on whether the ink in that memorandum can hold back a missile. How are you navigating this whipsaw—fading the peace rally on thin supply, or piling into risk assets on the ceasefire momentum?
⚠️ Not financial advice.
  • Reward
  • Comment
  • Repost
  • Share
#StockTradingChallengeUpTo17000U
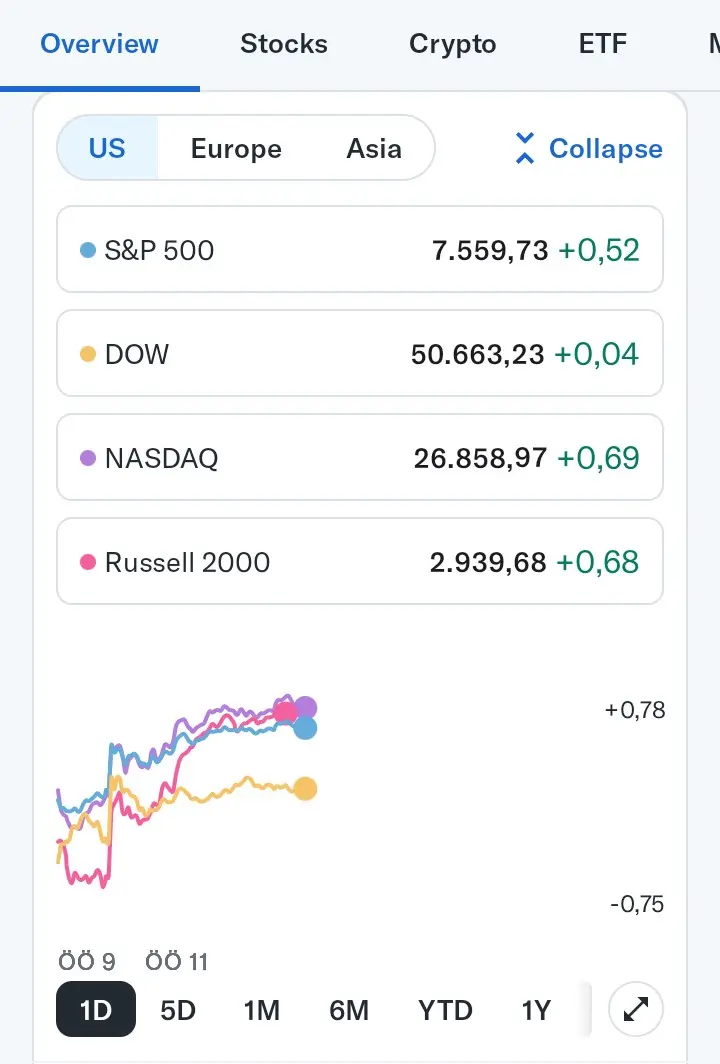
🇺🇸 Wall Street stayed green while Europe and Asia struggled to find momentum.
US markets closed higher led by tech strength: • NASDAQ +0.69%
• Russell 2000 +0.68%
• S&P 500 +0.52%
• DOW +0.04%
Meanwhile, European markets traded mostly lower: • FTSE 100 -0.75%
• DAX -0.34%
• CAC 40 -0.23%
Asian markets also showed mixed-to-weak performance: • Hang Seng -1.27%
• ASX 200 -1.43%
• Nikkei slipped despite early recovery attempts
📊 The divergence is becoming clearer: US equities continue attracting risk appetite, while Europe and Asia remain under pressure from sl
User_any
#StockTradingChallengeUpTo17000U
🇺🇸 Wall Street stayed green while Europe and Asia struggled to find momentum.
US markets closed higher led by tech strength: • NASDAQ +0.69%
• Russell 2000 +0.68%
• S&P 500 +0.52%
• DOW +0.04%
Meanwhile, European markets traded mostly lower: • FTSE 100 -0.75%
• DAX -0.34%
• CAC 40 -0.23%
Asian markets also showed mixed-to-weak performance: • Hang Seng -1.27%
• ASX 200 -1.43%
• Nikkei slipped despite early recovery attempts
📊 The divergence is becoming clearer: US equities continue attracting risk appetite, while Europe and Asia remain under pressure from slowing growth concerns, weak manufacturing data, and cautious central bank expectations.
Investors are now watching whether US strength can continue alone, or if global weakness eventually drags sentiment lower across all markets.
⚠️ Not financial advice.
#Stocks #NASDAQ #SP500 #GlobalMarkets
repost-content-media
  • Reward
  • Comment
  • 1
  • Share
Bonds On-Chain?
Tokenized U.S. Treasuries just shattered another record. The market cap for on-chain government debt has surged to $13.7 billion, locking in a breathtaking 120% year-over-year growth rate. This is not a pilot program anymore — it is a structural migration of one of the world's deepest capital markets onto blockchain rails.
🔹 The growth trajectory is steep and sustained. The market crossed $10 billion earlier this year and has added nearly $4 billion in a matter of months. BlackRock's BUIDL fund leads the charge with over $2.58 billion in assets, carrying a AAA-mf rating from M
BENJI2.18%
ONDO-0.13%
User_any
Bonds On-Chain?
Tokenized U.S. Treasuries just shattered another record. The market cap for on-chain government debt has surged to $13.7 billion, locking in a breathtaking 120% year-over-year growth rate. This is not a pilot program anymore — it is a structural migration of one of the world's deepest capital markets onto blockchain rails.
🔹 The growth trajectory is steep and sustained. The market crossed $10 billion earlier this year and has added nearly $4 billion in a matter of months. BlackRock's BUIDL fund leads the charge with over $2.58 billion in assets, carrying a AAA-mf rating from Moody's that signals institutional-grade credit quality. Franklin Templeton's BENJI product doubled its AUM year-to-date to surpass $2.05 billion, now deployed across nine blockchains with peer-to-peer share transfers live.
🔹 The institutional stampede is accelerating. Ondo Finance, JPMorgan's Kinexys, Mastercard, and Ripple completed a landmark cross-border redemption of tokenized Treasuries in under five seconds earlier this May. That pilot connected public blockchain infrastructure with interbank settlement rails, proving that government debt can move seamlessly between on-chain assets and traditional fiat channels outside banking hours.
🔹 The value proposition is elegantly simple. Tokenized Treasuries offer 3.4% to 3.5% annualized yield backed by the full faith and credit of the U.S. government. Institutions holding idle stablecoins are rotating into yield-bearing, programmable cash equivalents that settle instantly and integrate directly into collateral management systems. The 24/7 liquidity and fractional ownership capabilities transform a traditionally rigid asset class into a flexible building block for on-chain finance.
🔹 The broader real-world asset tokenization market has surged to $34 billion, more than tripling since early 2025. Tokenized Treasuries account for roughly 40% of that total, yet they still represent just 0.2% of the $6.6 trillion short-duration U.S. Treasury market. The runway ahead is measured in trillions, not billions.
The world's safest asset is learning to move at blockchain speed. A market that took decades to build its first trillion in traditional form has tokenized $13.7 billion in under three years — and the institutions driving this shift are just getting started. How are you positioning for the moment when tokenized government debt becomes the default collateral layer for global finance?#StockTradingChallengeUpTo17000U
⚠️ Not financial advice.
DYOR ‼️
repost-content-media
  • Reward
  • Comment
  • Repost
  • Share
Community Buzz Today: $WLD surges over 30% this week as AI hype returns
📈 $WLD up over 7% in 24h, with weekly gains exceeding 30%
📈 AI identity verification narrative continues heating up
📈 Traders are starting to worry about bearish divergence
Everyone’s discussing:
🔥 How much upside is left in the OpenAI narrative?
🔥 Chase now or wait for a pullback?
🔥 Will the AI sector explode again?
🎁 Join the discussion
Join daily discussions for a chance to win 250U Futures Position Vouchers!
👉 Join Gate Hot Chat👇
https://gate.onelink.me/Hls0/group?chatroom=group&ref=VVhBVA9a&ref_type=105
WLD-9.01%
Gate_Square
Community Buzz Today: $WLD surges over 30% this week as AI hype returns
📈 $WLD up over 7% in 24h, with weekly gains exceeding 30%
📈 AI identity verification narrative continues heating up
📈 Traders are starting to worry about bearish divergence
Everyone’s discussing:
🔥 How much upside is left in the OpenAI narrative?
🔥 Chase now or wait for a pullback?
🔥 Will the AI sector explode again?
🎁 Join the discussion
Join daily discussions for a chance to win 250U Futures Position Vouchers!
👉 Join Gate Hot Chat👇
https://gate.onelink.me/Hls0/group?chatroom=group&ref=VVhBVA9a&ref_type=105
repost-content-media
  • Reward
  • Comment
  • Repost
  • Share
Layer 2 solutions aim to improve the scalability and efficiency of blockchain networks while maintaining the security of the underlying main chain. Current mainstream Layer 2 solutions include Arbitrum, Optimism, zkSync, Starknet, Base, and others.
#LearnWithGateSquare
ARB-2.82%
OP-4.54%
ZK-2.81%
STRK0.53%
Gate_Square
Layer 2 solutions aim to improve the scalability and efficiency of blockchain networks while maintaining the security of the underlying main chain. Current mainstream Layer 2 solutions include Arbitrum, Optimism, zkSync, Starknet, Base, and others.
#LearnWithGateSquare
repost-content-media
  • Reward
  • Comment
  • Repost
  • Share
No Ban. New Era. ✨
"Slim to none." That is how the most powerful derivatives regulator in Washington just described the probability of the United States ever banning Bitcoin. Not "under review." Not "we'll see." CFTC Chairman Michael Selig looked straight into the microphone on the Market Disruptors Podcast and erased the darkest fear that has haunted crypto markets for over a decade.
🔹 Selig anchored his argument in something deeper than market structure — private property rights. "These protections should extend to personal wallets and crypto assets like Bitcoin," he told Mark Moss, framing
BTC-0.33%
SOL-1.22%
XRP-1.3%
Sand谋3S
No Ban. New Era. ✨
"Slim to none." That is how the most powerful derivatives regulator in Washington just described the probability of the United States ever banning Bitcoin. Not "under review." Not "we'll see." CFTC Chairman Michael Selig looked straight into the microphone on the Market Disruptors Podcast and erased the darkest fear that has haunted crypto markets for over a decade.
🔹 Selig anchored his argument in something deeper than market structure — private property rights. "These protections should extend to personal wallets and crypto assets like Bitcoin," he told Mark Moss, framing digital assets within the same constitutional tradition that protects American homes and bank accounts. He described the Trump administration as a "crypto president" administration actively shaping a long-term regulatory framework. The CFTC Chair — currently the only sitting commissioner on a five-member panel — holds extraordinary agenda-setting power, and he is using it to build guardrails, not walls.
🔹 The legislative machinery is grinding forward in parallel. The CLARITY Act cleared the Senate Banking Committee by a 15-9 bipartisan vote on May 22 — the furthest any comprehensive U.S. crypto market structure bill has ever advanced through the Senate. The bill draws a permanent jurisdictional line: Bitcoin and other decentralized digital commodities fall under CFTC oversight, while investment contract assets remain with the SEC. On March 17, the SEC and CFTC jointly classified 16 major tokens — including Bitcoin, Ether, XRP, and Solana — as digital commodities outside SEC jurisdiction, a 68-page interpretation that ended years of regulatory ambiguity in a single stroke.
🔹 The "crypto capital" rhetoric has escalated to the highest level of government. Trump declared the U.S. "currently the Crypto (Bitcoin, etc.) Capital of the World" in a Truth Social post on May 26, adding: "It is a major Industry, and we must protect it." He praised Selig for setting "rules of the road that are the Gold Standard for the States" and warned that other countries are "trying diligently to replace us". When a sitting president frames crypto as national competitiveness policy rather than a regulatory headache, the Overton window has shifted permanently.
🔹 The Strategic Bitcoin Reserve is transforming from executive order into statutory law. The American Reserve Modernization Act of 2026, introduced May 21 with 16 bipartisan co-sponsors, would codify a Treasury-managed Bitcoin reserve targeting 1 million BTC over five years — acquired through budget-neutral methods and locked for 20 years. The U.S. already holds approximately 328,372 BTC, making it the largest known sovereign Bitcoin holder. Patrick Witt of the President's Council of Advisors for Digital Assets called it "a breakthrough as far as getting everything in place, legally sound, properly safeguarding the assets".
🔹 The prediction market battle reveals how deeply this integration runs. Monthly volume has rocketed past $20 billion, and Bernstein projects $1 trillion annually by 2030. Trump demanded the CFTC retain "exclusive authority" over the sector on May 26, calling state-level opponents "scum" and framing federal jurisdiction as essential to keeping financial innovation onshore. The CFTC is now litigating against five states to defend federal authority — a legal fight almost certain to reach the Supreme Court.
🔹 The infrastructure is already operational. CME Bitcoin futures continue trading with CFTC oversight. The CFTC issued no-action letters in March 2026 allowing users to participate in regulated derivatives markets directly from non-custodial wallets. OCC and FDIC deregulation in 2025 opened the door for banks to custody Bitcoin. GENIUS Act, signed July 2025, created the first federal stablecoin framework — building the on-ramps and off-ramps that connect Bitcoin to the traditional financial system.
Ban risk was never the real question. It was always about which regulator writes the rules, how strict those rules become, and whether state-level crackdowns can fragment what federal policy is trying to unify. Selig just answered the first question. Congress is working on the second. The courts will settle the third. But the era of "will they ban it?" is over — replaced by something far more consequential: "how will they integrate it?"
The shift from prohibition to integration is the most underappreciated structural change in crypto today. What does this mean for your long-term conviction — are you positioning for the moment when regulatory clarity unlocks the next wave of institutional capital?
  • Reward
  • Comment
  • Repost
  • Share
$ONDO Wall Street, Meet On-Chain Rails
Tokenized equities just flipped from a niche experiment into a full-blown liquidity war. Ondo Finance's infrastructure is now powering a wave of stock tokens that mirror real-world giants like Union Pacific and Texas Instruments, and exchanges are pouring up to $1 million in rewards onto trading desks to capture the volume. The convergence of traditional equities and DeFi rails is accelerating faster than anyone projected — and Gate's own stock trading ecosystem sits at the center of this transformation.
🔹 The tokenized stock revolution is rewriting the
ONDO-0.13%
STX-0.07%
FLUX-4.74%
User_any
$ONDO Wall Street, Meet On-Chain Rails
Tokenized equities just flipped from a niche experiment into a full-blown liquidity war. Ondo Finance's infrastructure is now powering a wave of stock tokens that mirror real-world giants like Union Pacific and Texas Instruments, and exchanges are pouring up to $1 million in rewards onto trading desks to capture the volume. The convergence of traditional equities and DeFi rails is accelerating faster than anyone projected — and Gate's own stock trading ecosystem sits at the center of this transformation.
🔹 The tokenized stock revolution is rewriting the rulebook for equity exposure. Ondo Finance has built a bridge that tokenizes real-world equities onto blockchain rails, with tokens like UNPON (Union Pacific), NEMON (Newmont), STXON (Seagate), and TXNON (Texas Instruments) now trading across multiple major venues. These are not synthetic derivatives — they are on-chain claims that mirror the underlying company's economic rights, with dividends notionally reinvested into the tokenized position. The global tokenized stock market cap has surged to $1.54 billion, with derivatives volume smashing all-time highs of $3.57 billion on May 18 alone. This is no longer a pilot program — it is a structural migration.
🔹 The regulatory architecture is locking into place faster than most realize. Tokenized stocks now operate under the SEC's Innovation Exemption framework, which allows regulated trading provided platforms meet full securities-law obligations and use compliant token standards. The SEC and CFTC jointly classified digital assets in a 68-page interpretation on March 17, creating a legal pathway for tokenized equities that did not exist a year ago. Nasdaq approved tokenized Russell 1000 trading, and BlackRock's CEO publicly urged the SEC to accelerate stock and bond tokenization. The old wall between traditional equity market structure and blockchain settlement is dissolving in real time.
🔹 Ondo Finance anchors this infrastructure layer with a governance token that has accumulated serious market weight. ONDO currently trades near $0.30 with a market cap of $931 million, ranking among the top 75 digital assets globally. The Ondo DAO governs both the tokenization platform and Flux Finance, creating a decentralized coordination layer over institutional-grade financial products. The recent Ondo Tokenized Stocks Carnival has drawn heavy participation, with deposit cashback, lucky draw rewards, and a prize pool that reflects growing exchange-level conviction in tokenized equity products.
🔹 Liquidity and structure vary — and that is where the alpha lives. Some tokenized stocks are fully backed and integrated with transfer agents and custodians, while others track price synthetically without granting shareholder rights. The difference between a genuinely backed token and a price-tracking contract is the difference between owning an asset and renting exposure. Smart money is already filtering for tokens with deep liquidity, tight spreads, and clear regulatory standing — exactly the attributes that separate sustainable markets from promotional noise.
Tokenized equities are no longer a whitepaper concept — they are live, trading, and attracting serious capital. Ondo built the infrastructure, exchanges are fueling the liquidity, and Gate's stock trading challenge has already positioned its community at the center of this convergence. Are you trading tokenized stocks yet, or still waiting for the old guard to catch up?
#StockTradingChallengeUpTo17000U
repost-content-media
  • Reward
  • Comment
  • Repost
  • Share
#TradeCFDWinGold
#XIAOMI 📱📈
XIAOMI is currently entering one of the most important structural phases in its broader market cycle as global technology sentiment, consumer electronics demand, AI integration narratives, and EV sector expansion continue attracting institutional attention toward the company. Over recent months, XIAOMI has transformed from being viewed only as a smartphone manufacturer into a much broader technology ecosystem player, and this shift is heavily influencing trader sentiment across TradFi CFD markets.
From a macro perspective, XIAOMI is benefiting from several strong
XIAOMI-2.19%
PandaX
#TradeCFDWinGold
#XIAOMI 📱📈
XIAOMI is currently entering one of the most important structural phases in its broader market cycle as global technology sentiment, consumer electronics demand, AI integration narratives, and EV sector expansion continue attracting institutional attention toward the company. Over recent months, XIAOMI has transformed from being viewed only as a smartphone manufacturer into a much broader technology ecosystem player, and this shift is heavily influencing trader sentiment across TradFi CFD markets.
From a macro perspective, XIAOMI is benefiting from several strong growth narratives simultaneously. The company continues expanding its smartphone ecosystem, smart home infrastructure, AI-driven products, wearable technology presence, and electric vehicle ambitions. This diversification is strengthening long-term investor confidence because market participants increasingly value companies capable of building interconnected ecosystems rather than relying on a single revenue stream.
Current Market Structure
Technically, XIAOMI remains inside a bullish medium-to-long-term structure despite periodic consolidations. The overall market trend continues showing higher highs and higher lows on larger timeframes, which usually reflects sustained institutional accumulation behavior rather than temporary retail speculation.
The price structure currently suggests that buyers remain active during pullback phases, especially around major support zones where liquidity historically enters the market aggressively. Momentum traders are watching closely for continuation breakouts because the stock has repeatedly shown strong recovery behavior after corrective phases.
Trend Direction
Short-Term Trend: Bullish Consolidation
Mid-Term Trend: Strong Bullish Structure
Long-Term Trend: Expansion Phase
The broader structure indicates that XIAOMI is still trading inside a growth-focused narrative cycle. As long as major support levels continue holding, market participants are likely to maintain a positive directional bias.
Support Levels
Primary Support Zone:
18.20 – 18.80 HKD
This area represents a strong demand region where buyers previously defended price aggressively. Institutional liquidity historically becomes more active inside this range.
Secondary Support Zone:
16.90 – 17.40 HKD
If broader market weakness appears, this level could become a deeper retracement area where swing traders search for long re-entry opportunities.
Psychological Support:
15.00 HKD
This level remains psychologically important because markets often react strongly around round-number zones.
Resistance Levels
Immediate Resistance:
20.50 – 21.20 HKD
This area represents the first major breakout zone traders are monitoring closely.
Major Resistance:
22.80 – 24.00 HKD
A confirmed breakout above this structure could trigger accelerated momentum expansion.
Long-Term Expansion Target:
26.00 – 28.00 HKD
If bullish momentum strengthens further through institutional participation and broader tech-sector recovery, this zone may become the next major upside target.
Market Momentum
Momentum structure remains positive overall. Recent price behavior suggests that buyers continue controlling broader directional flow despite temporary corrections. Momentum indicators on higher timeframes still favor continuation rather than full structural reversal.
The strongest momentum periods often appear during:
Positive technology-sector sentiment
Strong earnings expectations
AI-related market optimism
EV ecosystem developments
Chinese tech-sector recovery phases
Volume Behavior
Volume activity around XIAOMI has shown increasing institutional participation during major breakout attempts. Rising volume during bullish continuation phases usually indicates stronger market confidence and broader participation from larger financial players.
Healthy volume expansion during upward movement is generally considered constructive because it confirms stronger buying conviction behind the trend.
Technical Formation
Current structure resembles a bullish continuation framework with accumulation behavior developing after previous expansion phases. Traders are monitoring whether price can build enough momentum for another breakout cycle.
Important formations being observed:
Bullish Flag Structure
Ascending Support Trendline
Higher Low Formation
Breakout Compression Range
These formations typically favor continuation when confirmed with strong volume participation.
Liquidity Structure
Liquidity currently appears concentrated near:
18.50 HKD support region
20.50 HKD breakout zone
22.00 HKD expansion trigger
Institutional traders often target liquidity pools before major directional movements occur. This means volatility may temporarily increase around these levels before stronger trends develop.
Intraday Trading Bias
Bullish Scenario:
If XIAOMI holds above 18.80 HKD and breaks 20.50 HKD with strong momentum, intraday traders may target:
21.20 HKD
22.00 HKD
22.80 HKD
Bearish Pullback Scenario:
If broader market weakness appears:
18.20 HKD becomes key support
Below that, 17.40 HKD may attract buyers again
Swing Trading Strategy
Conservative Entry Zone:
18.50 – 19.00 HKD
Aggressive Breakout Entry:
Above 20.50 HKD confirmation
Swing Targets:
TP1: 21.20 HKD
TP2: 22.80 HKD
TP3: 24.00 HKD
Risk Management Area:
SL below 17.40 HKD depending on volatility tolerance
Institutional Perspective
Large investors are increasingly focusing on ecosystem-driven technology companies with scalable long-term narratives. XIAOMI’s combination of hardware expansion, AI integration, smart ecosystem development, and EV ambitions creates a multi-sector growth profile that many growth-focused traders find attractive.
The EV narrative especially continues strengthening broader market attention because investors are evaluating whether XIAOMI can evolve into a serious participant inside the expanding intelligent mobility sector.
Macro Factors Influencing XIAOMI
Several macro elements continue affecting price behavior:
Chinese technology policy sentiment
Consumer electronics demand
AI sector momentum
Semiconductor supply conditions
Global equity risk appetite
EV market expansion
Institutional tech-sector rotation
Positive developments across these areas generally support stronger bullish continuation.
Psychological Structure
Psychological price levels matter heavily inside XIAOMI’s market structure:
20 HKD = breakout confidence level
25 HKD = expansion psychology zone
30 HKD = long-term speculative target
Markets often accelerate when psychological resistance zones break with strong momentum.
Overall Market Outlook
XIAOMI currently remains one of the more structurally interesting technology-focused TradFi CFD opportunities because it combines:
Strong ecosystem growth
Expanding product diversification
Positive technical structure
Institutional interest
AI narrative exposure
EV sector expansion potential
As long as broader market conditions remain supportive and major support levels continue holding, bullish continuation remains the dominant market structure scenario. Traders will likely continue monitoring breakout confirmation zones closely because strong momentum above resistance could trigger another major expansion phase in the coming cycle.
  • Reward
  • Comment
  • 1
  • Share
  • Pinned