SaharaDreams

vip
Diamond Hands
Market Analyst
Airdrop Hunter
Homeworker
Tokenized Reality?
$XLM just detonated 24% in a single session, capping a 43% weekly surge that left the broader market in the dust. The catalyst is not a rumor or a meme—it is a direct pipeline into the $2.3 quadrillion machinery of Wall Street settlement. Stellar’s landmark partnership with #DTCC is pulling the future of tokenized stocks, #ETFs, and Treasuries into the present, and the market is repricing the entire #RWA narrative in real time.
🔹 The RWA comeback is no longer a question—it is a structural migration. #Tokenized U.S. Treasuries have swelled to $13.7 billion, tokenized commodi
XLM4%
RWA-2.12%
Sand谋3S
Tokenized Reality?
$XLM just detonated 24% in a single session, capping a 43% weekly surge that left the broader market in the dust. The catalyst is not a rumor or a meme—it is a direct pipeline into the $2.3 quadrillion machinery of Wall Street settlement. Stellar’s landmark partnership with #DTCC is pulling the future of tokenized stocks, #ETFs, and Treasuries into the present, and the market is repricing the entire #RWA narrative in real time.
🔹 The RWA comeback is no longer a question—it is a structural migration. #Tokenized U.S. Treasuries have swelled to $13.7 billion, tokenized commodities crossed $5.1 billion, and the total on-chain real-world asset market now exceeds $34 billion. Stellar’s DTCC collaboration plugs blockchain settlement directly into the core plumbing of U.S. securities markets, transforming a theoretical use case into scheduled infrastructure. This is not a narrative revival; it is the acceleration phase of a multi-trillion-dollar shift.
🔹 The technical dashboard is flashing green with a caution light. XLM smashed through the $0.18 resistance with volume exploding past $1.7 billion, confirming genuine accumulation. Yet the RSI on 4-hour and daily charts has surged deep into overbought territory, and a 4-hour MACD divergence hints at near-term exhaustion. The $0.18 breakout level now serves as the critical floor—a successful retest would transform former resistance into a springboard for the next leg higher. Chasing the candle top carries risk; a disciplined pullback that holds support offers a higher-probability entry.
🔹 U.S. stock tokenization is rapidly becoming the next super-topic. Tokenized equities have rocketed to a $1.6 billion market cap, growing 40x year-over-year, while derivatives volume hit all-time highs above $3.5 billion. Nasdaq approved tokenized Russell 1000 trading, the SEC’s Innovation Exemption provides a regulatory pathway, and DTCC’s embrace of Stellar signals that the world’s largest securities depository is now building the on-chain rails. When the infrastructure that settles over $114 trillion annually targets a 2027 launch for tokenized assets, the conversation shifts from “if” to “how fast.”
XLM is not riding a speculative wave—it is anchoring the infrastructure layer where traditional finance meets blockchain settlement. The DTCC partnership validates the thesis, the volume confirms conviction, and the tokenization supercycle is still in its earliest innings. Are you positioning for the pullback to $0.18 as a gift, or riding the momentum toward $0.25 and beyond?
⚠️ Not financial advice.
  • Reward
  • Comment
  • Repost
  • Share
$JNJ A legal storm just scored a direct hit, yet this healthcare giant refuses to fall. Johnson & Johnson absorbed a blow after a Texas bankruptcy court rejected its structured settlement plan for talc lawsuits. The stock, trading at $225.33, held firm above its critical 200-day moving average of $211.62. This resilience points to a safe harbor, not a sinking ship.
🔹 Temporary legal fog cannot silence a roaring operational engine. The revenue loss from patent expirations on drugs like Stelara is being rapidly offset by powerful growth in the oncology segment. This portfolio transformation is
JNJ-2.34%
Sand谋3S
$JNJ A legal storm just scored a direct hit, yet this healthcare giant refuses to fall. Johnson & Johnson absorbed a blow after a Texas bankruptcy court rejected its structured settlement plan for talc lawsuits. The stock, trading at $225.33, held firm above its critical 200-day moving average of $211.62. This resilience points to a safe harbor, not a sinking ship.
🔹 Temporary legal fog cannot silence a roaring operational engine. The revenue loss from patent expirations on drugs like Stelara is being rapidly offset by powerful growth in the oncology segment. This portfolio transformation is so strong that the consensus earnings estimate for 2026 has been raised to $11.57 per share. The company is not simply shrinking; it is restructuring profitably.
🔹 The technical picture shows the scars of a short-term storm, but the defensive line holds. With a market capitalization of $542.4 billion and a dividend yield of 2.38%, JNJ remains a shelter for funds fleeing technology-driven volatility. The recent selling pressure is a healthy breather, not a panic.
A giant clearing a legal hurdle, closing a patent cliff with oncology strength, and sustaining a reliable cash flow stream. Do you keep this kind of defensive insurance in your portfolio?
⚠️ Not financial advice.
👉 DYOR ☑️
  • Reward
  • Comment
  • 1
  • Share
$4.16B Space Shield
SpaceX just landed a national security contract that reads like science fiction. The U.S. Space Force awarded the company a $4.16 billion deal to build a dedicated satellite network capable of tracking airborne targets from orbit. This is not about launching rockets — it is about building the eyes of the Pentagon in space, and the implications ripple across defense, technology, and commercial markets.
🔹 The contract tasks SpaceX with developing a proliferated low-Earth orbit constellation designed to detect, track, and monitor moving aerial threats. The system integrates w
SPCX-0.43%
User_any
$4.16B Space Shield
SpaceX just landed a national security contract that reads like science fiction. The U.S. Space Force awarded the company a $4.16 billion deal to build a dedicated satellite network capable of tracking airborne targets from orbit. This is not about launching rockets — it is about building the eyes of the Pentagon in space, and the implications ripple across defense, technology, and commercial markets.
🔹 The contract tasks SpaceX with developing a proliferated low-Earth orbit constellation designed to detect, track, and monitor moving aerial threats. The system integrates with the Space Development Agency's broader missile warning and tracking architecture, creating a layered sensor grid that spans from geostationary orbit down to the tactical edge. The award follows SpaceX's successful demonstration of missile tracking capabilities with its Starshield platform, the defense-focused sibling of Starlink.
🔹 The scope reflects the Pentagon's accelerating pivot toward distributed, resilient space architectures. Traditional defense satellites cost billions per unit and take decades to field. SpaceX's model — mass-produced satellites launched on reusable rockets — collapses both cost and timeline. The Space Force is betting that a constellation of hundreds of smaller, interconnected sensors can outperform a handful of exquisite but vulnerable legacy platforms.
🔹 This award deepens SpaceX's already formidable relationship with the U.S. military. The company now holds contracts spanning launch services, satellite communications via Starshield, and now persistent overhead surveillance. The $4.16 billion figure ranks among the largest single defense awards of 2026, placing SpaceX firmly inside the top tier of prime defense contractors alongside Boeing, Lockheed Martin, and Northrop Grumman.
🔹 The broader market context is equally significant. SpaceX is preparing for what could be the largest IPO in history, with a targeted valuation between $1.75 trillion and $2 trillion. A $4.16 billion defense contract landing weeks before the public debut strengthens every line of the S-1 prospectus — diversifying revenue beyond Starlink and launch services, demonstrating mission-critical government trust, and anchoring the valuation with long-duration, multi-year cash flows.
A $4.16 billion orbital sensor grid, a military that now views reusable rockets as essential infrastructure, and an IPO that could redefine public markets — SpaceX is compressing the future into the present. How do you see this defense expansion shaping the broader space economy and the coming public debut?#StockTradingChallengeUpTo17000U #TradeCFDWinGold
repost-content-media
  • Reward
  • Comment
  • Repost
  • Share
#WTICrudeFallsBelow90Dollars
Peace or Trap?
WTI crude just crashed through the $90 floor, landing at $89.81—a level that feels like a ceasefire gift to a global economy starved for cheaper energy. The White House confirmed a memorandum of understanding with Iran is now a reality, and traders are sprinting to reprice risk. But beneath this euphoric plunge, inventories are dangerously thin and macro demand is softening. The divergence between the peace premium and physical reality has rarely been this stark.
1️⃣ The Fragile Consensus Reshaping the Middle East
The MoU, brokered through Pakistan,
Last_Satoshi
#WTICrudeFallsBelow90Dollars
Peace or Trap?
WTI crude just crashed through the $90 floor, landing at $89.81—a level that feels like a ceasefire gift to a global economy starved for cheaper energy. The White House confirmed a memorandum of understanding with Iran is now a reality, and traders are sprinting to reprice risk. But beneath this euphoric plunge, inventories are dangerously thin and macro demand is softening. The divergence between the peace premium and physical reality has rarely been this stark.
1️⃣ The Fragile Consensus Reshaping the Middle East
The MoU, brokered through Pakistan, links a 60-day truce to a phased reopening of the Strait of Hormuz. The framework is a genuine breakthrough, yet the historical pattern is unequivocal: breakthroughs in this conflict are often followed by military incidents that test the deal's durability within days. The situation will likely stabilize in incremental steps—a brief window of calm as oil flows resume, punctuated by the risk of another strike-and-retaliation cycle that keeps risk premiums from fully evaporating.
2️⃣ The Great Oil Tug-of-War: Supply Fears vs. Demand Scars
Short-term, the technical breakdown below $90 opens a path toward the mid-$80s as the "war bid" deflates. However, a structural floor is already rising to meet this decline. U.S. commercial crude inventories remain stubbornly tight, having posted their sixth consecutive weekly draw. As ANZ strategist Daniel Hynes noted, "Oil supply remains constrained, and key sticking points have yet to be resolved." The market is caught between the weight of a slowing global economy and a low-inventory buffer that will violently amplify any supply disruption.
Bulls have the physical barrel count on their side. Bears have diplomacy on theirs. Crude is at the epicenter of a $90 standoff, and the next move depends entirely on whether the ink in that memorandum can hold back a missile. How are you navigating this whipsaw—fading the peace rally on thin supply, or piling into risk assets on the ceasefire momentum?
⚠️ Not financial advice.
  • Reward
  • Comment
  • 2
  • Share
The short position is off by 0.2—if you didn’t get in, then it’s fine. The nearer take-profit is 2023; the farther one stays unchanged.
Take 2046 with you—if you don’t enter with 2046, you can place an order at 2071.
PleaseCallMeDogzhuang
The short position is off by 0.2—if you didn’t get in, then it’s fine. The nearer take-profit is 2023; the farther one stays unchanged.
Take 2046 with you—if you don’t enter with 2046, you can place an order at 2071.
  • Reward
  • Comment
  • Repost
  • Share
Gold's Silent Roar
Gold just did something it hasn't done in 26 months — it exhaled. The monthly RSI slipped below 70 for the first time since March 2024, cooling off from an overbought extreme that had persisted through wars, rate hikes, and a global de-dollarization wave. This is not a warning sign; it is a healthy reset, and the physical and digital gold markets are both quietly reloading.
🔹 The physical bullion market is absorbing a historic sovereign accumulation cycle. Central banks globally have absorbed north of 60 tonnes per month, a pace that previously preceded the great gold bull
XAUUSD0.99%
XAUT0.18%
PAXG0.1%
BTC-0.33%
SinCity
Gold's Silent Roar
Gold just did something it hasn't done in 26 months — it exhaled. The monthly RSI slipped below 70 for the first time since March 2024, cooling off from an overbought extreme that had persisted through wars, rate hikes, and a global de-dollarization wave. This is not a warning sign; it is a healthy reset, and the physical and digital gold markets are both quietly reloading.
🔹 The physical bullion market is absorbing a historic sovereign accumulation cycle. Central banks globally have absorbed north of 60 tonnes per month, a pace that previously preceded the great gold bull runs of the 1970s and 2000s. The People's Bank of China extended its buying streak yet again, while Poland, Uzbekistan, and Kazakhstan all joined the accumulation in Q1. Spot gold corrected from $5,477 to hover near $4,450, but Goldman Sachs held firm on its $5,400 year-end target, reinforcing the view that this pullback is a consolidation within a secular uptrend.
🔹 Tokenized gold has crossed the $5 billion market cap threshold, with XAUt commanding a dominant share. The sector's rapid institutionalization mirrors the early days of stablecoin adoption, with blockchain-based ownership delivering instant settlement, fractional accessibility, and 24/7 liquidity. Q1 2026 spot trading volume across PAXG, XAUt, and other gold-backed tokens reached $90.7 billion — exceeding the entire 2025 full-year total of $84.6 billion.
🔹 XAUt is flexing its safe-haven credentials in real time. On May 28, while Bitcoin and Ethereum ETFs hemorrhaged billions in outflows, XAUt recorded a $3.1 million net inflow — one of the top five assets for capital absorption that day. When risk-off sentiment sweeps through crypto markets, capital is increasingly rotating into tokenized gold as a defensive store of value, confirming its role as a non-correlated hedge within digital asset portfolios.
🔹 Tether is laying the regulatory groundwork for a major Asian expansion. Seven trademark applications were filed in South Korea, covering both USDT and XAUt, ahead of the country's Digital Asset Basic Act implementation. South Korea remains one of the world's most active crypto markets, and securing a compliant local foothold could significantly expand XAUt's user base while positioning it ahead of competitors still navigating the regulatory maze.
The monthly RSI is resetting. Central banks are stacking physical bars at a record pace. Tokenized gold trading volume just smashed an all-time annual high — in a single quarter. XAUt is absorbing capital while risk assets bleed, and Tether is quietly planting its flag in Asia's most vibrant crypto market. Gold is not retreating; it is reloading across three parallel dimensions: physical, digital, and regulatory. How do you read this multi-layered expansion — a natural breather before the next leg up, or a structural shift that makes gold one of the most diversified macro plays in the current cycle?
$PAXG $XAUT $XAU
⚠️ Not financial advice
Allways DYOR
  • Reward
  • Comment
  • 1
  • Share
#TradFi交易分享挑战
#JNJ
Johnson & Johnson (JNJ) remains one of the strongest defensive healthcare companies in the global stock market as of late May 2026, combining pharmaceutical innovation, MedTech expansion, stable cash flows, and one of the longest dividend growth records in corporate America. While many technology and growth stocks continue experiencing heavy volatility due to interest-rate uncertainty, geopolitical instability, and broader macroeconomic concerns, JNJ has positioned itself as a relatively stable large-cap healthcare giant capable of delivering both defensive protection and
SinCity
#TradFi交易分享挑战
#JNJ
Johnson & Johnson (JNJ) remains one of the strongest defensive healthcare companies in the global stock market as of late May 2026, combining pharmaceutical innovation, MedTech expansion, stable cash flows, and one of the longest dividend growth records in corporate America. While many technology and growth stocks continue experiencing heavy volatility due to interest-rate uncertainty, geopolitical instability, and broader macroeconomic concerns, JNJ has positioned itself as a relatively stable large-cap healthcare giant capable of delivering both defensive protection and moderate long-term capital appreciation.
At the moment, JNJ is trading around the $230–234 range, with recent closes near $230.80 and intraday fluctuations between approximately $229.73 and $231.87. Some traders continue referencing prices near $239.53 because the stock traded around those levels during recent momentum phases earlier in May. Despite pulling back slightly from its highs, the broader trend remains constructive because JNJ continues holding well above major long-term support zones and remains significantly stronger than many traditional defensive stocks.
The most important factor attracting investors right now is the company’s transition into a new growth cycle. For years, investors viewed Johnson & Johnson primarily as a slow-moving dividend stock, but the recent acceleration in oncology, immunology, neuroscience, and MedTech revenues has changed market sentiment dramatically. The company is now increasingly viewed as a high-quality hybrid between a growth stock and a defensive healthcare compounder.
Historically, JNJ has experienced remarkable price appreciation over long periods despite temporary litigation concerns and patent-cycle fears. The stock’s 52-week low near $149.04 in June 2025 now looks extremely distant compared to current prices above $230. That rebound represents one of the strongest recoveries among mega-cap healthcare names during the past year. Meanwhile, the 52-week high near $251.71 reached around March 2026 continues acting as the major resistance zone traders are watching closely. The all-time closing highs near $247–248.56 also remain psychologically important because a breakout above those levels could open the door toward much higher valuation targets.
From a financial perspective, Johnson & Johnson delivered one of its strongest quarterly reports in recent years during Q1 2026. Revenue reached approximately $24.1 billion, representing reported growth close to 10%, while operational growth remained above 6%. These numbers exceeded analyst expectations comfortably, especially considering the massive biosimilar pressure facing Stelara. Many analysts originally feared that Stelara’s patent cliff would create a severe drag on company-wide growth, but the actual results showed that new growth engines are more than compensating for those declines.
One of the largest growth drivers continues to be Darzalex, which has become a dominant oncology product globally. Quarterly sales approached roughly $4 billion, making it one of the strongest-performing cancer drugs in the healthcare sector. Darzalex continues benefiting from expanded indications, rising adoption rates, and strong physician confidence. Investors increasingly believe the product still has significant room for global expansion, especially in international oncology markets.
Another major contributor is Tremfya, which generated around $1.6 billion in quarterly revenue and continues gaining market share in immunology. Tremfya’s momentum is particularly important because investors see it as one of the central products capable of replacing lost Stelara revenues over the next several years. Positive physician feedback, strong efficacy data, and expanding approvals continue supporting bullish expectations for long-term sales growth.
Beyond pharmaceuticals, Johnson & Johnson’s MedTech division has become an increasingly important pillar of growth. Acquisitions such as Abiomed and Shockwave Medical significantly strengthened JNJ’s cardiovascular and surgical technology exposure. MedTech operational growth between approximately 4.6% and 7.7% demonstrates that the business is no longer simply a stable but slow-growing segment. Instead, it is now becoming a meaningful earnings accelerator capable of diversifying overall company revenues.
Perhaps the most important development from the latest earnings report was management’s decision to raise full-year 2026 guidance. The company now expects reported revenue around $100.8 billion at the midpoint, marking the first time Johnson & Johnson officially targets more than $100 billion in annual sales. This milestone carries huge psychological importance because it confirms the company’s transition into a larger and stronger earnings cycle.
Adjusted EPS guidance near $11.55 also signals confidence from management regarding margins, product demand, and operational efficiency. Analysts currently project around 7% earnings growth for 2026, which is impressive for a healthcare company already operating at such enormous scale. Investors generally reward large-cap defensive companies heavily when they demonstrate stable mid-to-high single-digit growth alongside reliable dividends.
Dividend strength remains one of the most attractive aspects of the JNJ investment case. Johnson & Johnson has increased its dividend for more than 60 consecutive years, placing it among the elite Dividend Kings in the U.S. stock market. The forward annual dividend near $5.36 currently provides a yield around 2.3%, which remains attractive relative to treasury yields and many competing defensive equities. Long-term institutional investors continue viewing JNJ as a cornerstone portfolio holding because of this stability.
Analyst sentiment across Wall Street remains broadly constructive. Most firms maintain Buy, Overweight, or Outperform ratings on the stock, while only a minority remain cautious due to litigation and biosimilar concerns. Consensus 12-month price targets generally range between approximately $252 and $261, implying moderate upside from current levels. More optimistic firms such as HSBC continue projecting targets near $280, while aggressive bullish scenarios from independent analysts sometimes reach the $285–289 area.
The bullish argument centers around several core themes simultaneously. First, investors believe the pharmaceutical pipeline remains underappreciated. Second, MedTech integration is improving faster than expected. Third, defensive healthcare demand tends to strengthen during uncertain economic environments. Finally, many portfolio managers increasingly rotate capital from overextended technology stocks into high-quality healthcare companies offering stable earnings visibility.
Technically, the chart structure remains relatively healthy. Immediate support is located around $229–230, followed by secondary support near $224–225. Stronger institutional support appears around $221–222, which many traders consider the key defensive zone maintaining the current bullish structure. As long as JNJ continues trading above those areas, the broader uptrend remains intact.
On the upside, resistance between $235 and $236 remains critical because repeated failures near that zone created short-term consolidation pressure. A confirmed breakout above $236 could rapidly trigger momentum buying toward $246–248, where the all-time highs become the next major obstacle. If those levels break decisively, Fibonacci extension models and bullish technical projections begin pointing toward the $257–264 region. In extremely bullish scenarios supported by strong earnings and favorable FDA developments, some traders even discuss possible movement toward $270–280 later in 2026.
Trading volume patterns also suggest accumulation behavior rather than aggressive institutional selling. Defensive funds, dividend-focused portfolios, and healthcare ETFs continue maintaining strong exposure to JNJ despite broader market volatility. This relative stability reinforces the stock’s reputation as a safer large-cap holding during uncertain macroeconomic periods.
However, risks still exist and cannot be ignored. The largest ongoing concern remains litigation exposure related to talc products. Although investors have become somewhat desensitized to these headlines, sudden legal developments could still create temporary volatility spikes. Additionally, patent expirations and biosimilar competition remain structural challenges for all major pharmaceutical companies, including JNJ.
Another potential risk involves U.S. healthcare policy changes, particularly around drug pricing reforms. Any aggressive government pricing regulation could pressure future pharmaceutical margins across the sector. Currency fluctuations, recession fears, or global healthcare spending slowdowns could also affect growth expectations temporarily.
Despite these risks, overall market sentiment toward Johnson & Johnson remains relatively optimistic because the company possesses enormous diversification advantages. Unlike smaller biotech companies dependent on one or two products, JNJ operates across multiple therapeutic categories, surgical technologies, medical devices, and global healthcare markets simultaneously. This diversification significantly reduces operational risk compared to many competitors.
For traders, several strategies currently appear popular. Long-term investors continue accumulating shares gradually during pullbacks near the $225–230 support range while collecting dividends and targeting eventual appreciation toward $250–270 over time. Swing traders are watching for momentum breakouts above $235–236 with potential targets near $250–260. Conservative investors often prefer scaling into positions slowly because healthcare stocks typically move more steadily than high-volatility technology names.
Risk management remains essential despite the stock’s defensive reputation. Traders commonly place stop-loss levels below the $220 region because a breakdown beneath that zone could shift medium-term momentum bearish. Portfolio diversification also remains important since even defensive healthcare stocks can experience sudden event-driven volatility.
Looking toward the second half of 2026, several catalysts could determine JNJ’s next major move. Investors are closely monitoring upcoming earnings reports, FDA approvals, late-stage clinical trial data, MedTech integration progress, and broader healthcare sector flows. Positive developments in oncology, immunology, and cardiovascular technologies could further strengthen institutional confidence.
Overall, Johnson & Johnson currently stands as one of the most fundamentally stable mega-cap healthcare companies in the market. The combination of strong earnings growth, expanding pharmaceutical leadership, rising MedTech momentum, massive global diversification, and reliable dividend increases continues supporting a constructive long-term outlook. While short-term volatility and resistance zones may create temporary pullbacks, the broader consensus among analysts and institutional investors remains moderately bullish with expectations for continued steady growth throughout 2026 and beyond.
This analysis is for informational purposes only and not financial advice. Stock prices remain volatile and can change rapidly based on earnings, news, regulation, and broader market conditions. Investors should conduct independent research and manage risk carefully before making trading or investment decisions.
  • Reward
  • Comment
  • Repost
  • Share
#TradeCFDWinGold
In periods when risks are redefined in the global financial markets, and macroeconomic data and geopolitical developments set the direction, the strategic importance of safe haven assets becomes much more prominent. For professionals seeking to benefit from price movements instantly by stepping outside traditional investment patterns, forward contracts offer unique solutions in terms of liquidity and flexibility. Especially, precious metals, which are recognized globally as the most durable store of value, play a leading role in capital growth and portfolio balancing moves by
PandaX
#TradeCFDWinGold
In periods when risks are redefined in the global financial markets, and macroeconomic data and geopolitical developments set the direction, the strategic importance of safe haven assets becomes much more prominent. For professionals seeking to benefit from price movements instantly by stepping outside traditional investment patterns, forward contracts offer unique solutions in terms of liquidity and flexibility. Especially, precious metals, which are recognized globally as the most durable store of value, play a leading role in capital growth and portfolio balancing moves by investors with high financial literacy.
The Safe Haven Role of Precious Metals and Market Context
Gold, accepted for centuries as the strongest shield against global economic shocks, inflationary pressures, and currency devaluations, maintains its strategic significance in today’s modern trading world. Changes in central banks’ reserve policies, interest rate cycles, and fluctuations in the global supply chain create strong and dynamic movement opportunities in the ounce price of this precious metal.
[A futuristic glowing gold bar representing safe-haven assets in modern trading]
For a professional trader, these fluctuations mean significant opportunities to be managed directly based on price expectations, without dealing with additional costs of physical buying and selling processes, storage risks, and high spreads.
Managing Opportunities in Ounce Price with Dual Dynamics
In classic spot asset management, profits depend solely on rising prices, but modern contracts give investors directional freedom. This flexible system allows active participation not only during upward trends but also during sharp pullbacks and correction phases of the precious metal.
Bullish Expectation (Long Position): During periods of escalating geopolitical risks or discussions of interest rate cuts, buy positions are preferred to evaluate the upward momentum in the ounce price.
Bearish Expectation (Short Position): In scenarios where strong employment data, rising bond yields, or continued tight monetary policies suppress the ounce price, profits can be generated through short-selling strategies or existing physical portfolios can be hedged for protection.
Leverage Amplifier and Risk Discipline in Precious Metal Transactions
The precious metals market is one of the areas with the highest liquidity and the most stable response to technical analysis data. Thanks to the leverage system offered by forward contracts, even small percentage changes in the ounce price enable maximum capital efficiency and high-volume trading.
However, the high volatility (fluctuations) that gold exhibits periodically requires this power to be managed with strict discipline. A successful portfolio manager closely follows the macroeconomic calendar, avoiding emotional analysis. They determine support and resistance levels in light of global inflation rates, unemployment data, and statements from central bank governors. By placing stop-loss orders with millimeter precision, they safeguard capital.
Strategic Diversification and Enhancing the Portfolio with Precious Rewards
The secret to lasting success in modern finance is not putting all eggs in one basket. While trading global stock indices, technology shares, or energy commodities, always allocating a portion of the portfolio to proven, reliable precious metals optimizes risk.
Investors who use data-driven analysis methods, proceed with patience and discipline, and interpret the dynamic cycles of the markets correctly, achieve the comfort of managing their financial decisions with maximum efficiency. Operations conducted in accordance with risk management principles are the most professional way to capture liquidity in global markets and reap financial success rewards.
  • Reward
  • Comment
  • 1
  • Share
#TradFi交易分享挑战
#TSM
Taiwan Semiconductor Manufacturing Company (TSM) is currently trading around $419.60 as of late May 2026. The stock has delivered an exceptional rally of over +116% in the past year, making it one of the strongest large-cap performers in the global semiconductor sector. The company now holds a market capitalization of approximately $2.17 trillion, placing it among the most valuable technology-related firms in the world.
TSMC remains the world’s leading semiconductor foundry, producing advanced chips for major technology companies such as Nvidia, Apple, AMD, Qualcomm, and B
TSM-1.02%
PandaX
#TradFi交易分享挑战
#TSM
Taiwan Semiconductor Manufacturing Company (TSM) is currently trading around $419.60 as of late May 2026. The stock has delivered an exceptional rally of over +116% in the past year, making it one of the strongest large-cap performers in the global semiconductor sector. The company now holds a market capitalization of approximately $2.17 trillion, placing it among the most valuable technology-related firms in the world.
TSMC remains the world’s leading semiconductor foundry, producing advanced chips for major technology companies such as Nvidia, Apple, AMD, Qualcomm, and Broadcom. The recent price action reflects strong investor confidence driven by artificial intelligence demand, advanced chip manufacturing leadership, and long-term supply dominance.
Recent Performance and Price Action
TSM recently reached a new 52-week high above $422 before slightly pulling back toward the $415–$419 zone. This minor decline is considered a normal consolidation phase after a strong breakout. Over the past year, the stock has risen from approximately $170 to above $419, reflecting a gain of more than 140%.
The trend remains strongly bullish across all major timeframes. Buyers continue to step in on dips, while institutional demand remains steady due to long-term AI infrastructure expansion. Short-term volatility is present, but it is occurring within a clearly upward structural trend.
Earnings Performance and Financial Strength
The latest Q1 2026 earnings report showed strong fundamentals. Revenue reached approximately $35.9 billion, reflecting over 35% year-over-year growth and beating market expectations. Earnings per share also exceeded forecasts, confirming strong operational efficiency.
Gross margins expanded significantly to above 66%, driven by increasing production of advanced nodes such as 3nm and preparation for 2nm manufacturing. Management also raised full-year revenue guidance to above 30% growth, reinforcing confidence in continued demand strength.
Capital expenditure is projected to reach up to $56 billion in 2026, showing aggressive expansion plans to meet rising global chip demand. The company also emphasized that AI demand is not temporary but structural and long-term in nature.
AI Supercycle and Growth Drivers
The main growth driver for TSMC is the global artificial intelligence infrastructure cycle. The company manufactures the most advanced AI chips used in data centers, including GPUs and custom AI accelerators.
Demand from hyperscale cloud providers and AI companies continues to accelerate, requiring significantly more advanced semiconductor capacity. TSMC benefits directly from this trend because it controls leading-edge manufacturing technology and high-performance chip production.
Additional growth comes from advanced packaging technologies and new production nodes such as 3nm and upcoming 2nm chips. These technologies increase pricing power and improve margins.
Technical Analysis and Key Levels
TSM remains in a strong uptrend on the technical chart. The stock trades above its 20-day, 50-day, and 200-day moving averages, confirming a long-term bullish structure.
Key support levels are located around $400, followed by stronger support near $382. The 200-day moving average near $323 represents the long-term trend base. On the upside, resistance is seen near $420–$425. A breakout above this zone could lead to price movement toward $440–$460.
Momentum indicators show strength but also suggest short-term consolidation due to extended conditions after a strong rally.
Forecast and Price Outlook
Analyst forecasts remain generally positive. Most models suggest a 12-month price range between $460 and $500 under normal conditions. More optimistic projections suggest potential movement toward $520 if AI demand continues to accelerate and earnings remain strong.
Short-term expectations suggest trading between $400 and $425 as the market consolidates recent gains. Medium-term outlook points toward $440–$480 if resistance is broken with strong volume.
Long-term projections remain bullish due to structural AI demand, capacity expansion, and pricing power in advanced semiconductor manufacturing.
Market Sentiment and Trader Positioning
Investor sentiment is strongly positive. Institutional investors continue to accumulate positions due to TSMC’s central role in global AI infrastructure. Hedge funds and long-term portfolios view the stock as a core holding in semiconductor exposure.
Retail trader sentiment is also bullish, driven by strong price momentum and consistent earnings growth. Options activity shows balanced positioning, with both hedging and continuation trades present.
Despite strong optimism, some caution exists due to extended valuation levels and geopolitical exposure, which may lead to short-term volatility.
Risk Factors
The main risk for TSMC is geopolitical uncertainty, particularly related to Taiwan’s strategic position. Any escalation in regional tensions could significantly impact market sentiment.
Valuation risk is also present, as the stock trades at a premium due to strong growth expectations. Any slowdown in earnings or guidance could trigger corrections.
Other risks include global demand fluctuations, supply chain disruptions, and shifts in AI investment cycles. Short-term technical pullbacks of 5–10% remain possible even within a strong bullish trend.
Trading Strategy Overview
For short-term traders, the key resistance zone is $420–$425. A confirmed breakout above this level may open upside toward $440. Support near $400 provides a potential entry zone during pullbacks.
Medium-term traders may consider accumulation between $386 and $400 with targets toward $460–$480. Stop-loss levels are typically placed below $380 to manage downside risk.
Long-term investors may view dips as accumulation opportunities, focusing on the structural AI growth trend and semiconductor leadership position of TSMC.
Conclusion
Taiwan Semiconductor Manufacturing Company remains one of the strongest structural growth stories in global markets. The combination of AI-driven demand, technological leadership, and pricing power supports a long-term bullish outlook.
While short-term volatility and geopolitical risks remain important factors, the overall trend structure continues to favor upside. Medium-term targets point toward $460–$500, while extended bullish scenarios may reach beyond $520 if current conditions persist.
@Gate_Square @Gate广场_Official
  • Reward
  • Comment
  • 1
  • Share
Swipe the Dip. Earn the Top. 💳
Crypto just broke out of the charts and landed at the checkout counter. Gate Card is transforming idle digital assets into everyday purchasing power, bridging the gap between the volatility of the markets and the simplicity of a morning coffee. With cumulative crypto card spending rocketing past $7.8 billion, the narrative has shifted: this is not just about HODLing until the moon; it's about living on the way there.
🔹 Real Utility, Real Rewards
Every purchase sends a reward straight back to your stack. The Gate Card delivers up to 5% cashback, and it pays you
BTC-0.33%
ETH-1.07%
GT2.42%
SATS-1.54%
Sand谋3S
Swipe the Dip. Earn the Top. 💳
Crypto just broke out of the charts and landed at the checkout counter. Gate Card is transforming idle digital assets into everyday purchasing power, bridging the gap between the volatility of the markets and the simplicity of a morning coffee. With cumulative crypto card spending rocketing past $7.8 billion, the narrative has shifted: this is not just about HODLing until the moon; it's about living on the way there.
🔹 Real Utility, Real Rewards
Every purchase sends a reward straight back to your stack. The Gate Card delivers up to 5% cashback, and it pays you in the hardest assets in the world: $BTC, $ETH, $USDT, or $GT. In a down market, that is forced accumulation. In an up market, it's a multiplier on your daily spending.
🔹 Zero Friction, Pure Firepower
The traditional banking model of annual fees, monthly charges, and hidden application costs is gone. Gate has permanently eliminated spending fees and designed the card to draw directly from your spot account in real time. No separate wallet reloads, no waiting for funds to clear—just instant conversion at over 130 million Visa merchants globally.
🔹 Instant Integration
The physical card fits in your pocket, but the virtual card is ready in minutes. With seamless support for Apple Pay and Google Pay, security and speed are literally in your hand. Every swipe is a step away from outdated banking infrastructure and a step into a fully integrated digital economy.
The old division between "investing" and "spending" has dissolved. Your assets are meant to move with you—through shopping aisles, dining tables, and ride-hailing apps—stacking sats along the way. Have you made the switch from stale fiat points to real crypto cashback yet?
https://www.gate.com/card?channel=8¤cy=USD
#GateCard
  • Reward
  • Comment
  • Repost
  • Share
The Russell 2000 has surged 18% year-to-date, leaving the S&P 500 and Nasdaq in its dust. This is the index's most explosive start since 1991—a year that kicked off a decade of remarkable small-cap dominance. History is knocking, and the knock is getting louder by the day.
🔹 This surge is rewriting the narrative of a narrow market. While traders fixate on mega-cap AI giants, the 2,000 smaller companies forming the backbone of the domestic economy are printing multi-year highs. The equal-weight S&P 500 confirmed this breadth by hitting its own records, proving that gains are no longer concentr
US2000-0.56%
US5000.04%
GT2.42%
HYPE3.74%
User_any
The Russell 2000 has surged 18% year-to-date, leaving the S&P 500 and Nasdaq in its dust. This is the index's most explosive start since 1991—a year that kicked off a decade of remarkable small-cap dominance. History is knocking, and the knock is getting louder by the day.
🔹 This surge is rewriting the narrative of a narrow market. While traders fixate on mega-cap AI giants, the 2,000 smaller companies forming the backbone of the domestic economy are printing multi-year highs. The equal-weight S&P 500 confirmed this breadth by hitting its own records, proving that gains are no longer concentrated in a handful of names. Capital is rotating down the market cap spectrum, a classic hallmark of a durable, healthy bull cycle.
🔹 The connection to risk appetite is direct and powerful. Small caps are often the first to sprint when economic optimism takes hold. Their high sensitivity to domestic growth, interest rate expectations, and consumer spending makes them a real-time barometer of market sentiment. This 18% liftoff signals that deep pools of capital are betting on economic expansion, not recession.
🔹 The crypto corridor is wide open. When the Russell 2000 leads the charge, it signals a broad risk-on environment that historically provides a fertile backdrop for digital assets. The same liquidity seeking out undervalued small-cap equities often finds its way into high-beta crypto plays. As capital flows embrace domestic growth stories, the appetite for innovative, decentralized networks typically expands alongside it.
🔹 Historically, the last time small caps started this strong, the index surged over 43% for the full year. The combination of easing geopolitical tensions, declining oil prices, and resilient corporate earnings is creating a supportive macro foundation. If the 1991 playbook holds, this initial sprint could be the early phase of a much longer marathon.
The Russell 2000 is not just breaking out—it's ripping a page straight out of the early '90s bull market playbook. Broad-based strength is replacing narrow AI concentration, and history strongly suggests that a small-cap surge of this magnitude rarely fades quietly. How are you positioning your portfolio to ride this broadening tide?
#StockTradingChallengeUpTo17000U
#TradeCFDWinGold
$GT $HYPE $SOL
repost-content-media
  • Reward
  • Comment
  • 1
  • Share
Bonds On-Chain?
Tokenized U.S. Treasuries just shattered another record. The market cap for on-chain government debt has surged to $13.7 billion, locking in a breathtaking 120% year-over-year growth rate. This is not a pilot program anymore — it is a structural migration of one of the world's deepest capital markets onto blockchain rails.
🔹 The growth trajectory is steep and sustained. The market crossed $10 billion earlier this year and has added nearly $4 billion in a matter of months. BlackRock's BUIDL fund leads the charge with over $2.58 billion in assets, carrying a AAA-mf rating from M
BENJI2.18%
ONDO-0.13%
User_any
Bonds On-Chain?
Tokenized U.S. Treasuries just shattered another record. The market cap for on-chain government debt has surged to $13.7 billion, locking in a breathtaking 120% year-over-year growth rate. This is not a pilot program anymore — it is a structural migration of one of the world's deepest capital markets onto blockchain rails.
🔹 The growth trajectory is steep and sustained. The market crossed $10 billion earlier this year and has added nearly $4 billion in a matter of months. BlackRock's BUIDL fund leads the charge with over $2.58 billion in assets, carrying a AAA-mf rating from Moody's that signals institutional-grade credit quality. Franklin Templeton's BENJI product doubled its AUM year-to-date to surpass $2.05 billion, now deployed across nine blockchains with peer-to-peer share transfers live.
🔹 The institutional stampede is accelerating. Ondo Finance, JPMorgan's Kinexys, Mastercard, and Ripple completed a landmark cross-border redemption of tokenized Treasuries in under five seconds earlier this May. That pilot connected public blockchain infrastructure with interbank settlement rails, proving that government debt can move seamlessly between on-chain assets and traditional fiat channels outside banking hours.
🔹 The value proposition is elegantly simple. Tokenized Treasuries offer 3.4% to 3.5% annualized yield backed by the full faith and credit of the U.S. government. Institutions holding idle stablecoins are rotating into yield-bearing, programmable cash equivalents that settle instantly and integrate directly into collateral management systems. The 24/7 liquidity and fractional ownership capabilities transform a traditionally rigid asset class into a flexible building block for on-chain finance.
🔹 The broader real-world asset tokenization market has surged to $34 billion, more than tripling since early 2025. Tokenized Treasuries account for roughly 40% of that total, yet they still represent just 0.2% of the $6.6 trillion short-duration U.S. Treasury market. The runway ahead is measured in trillions, not billions.
The world's safest asset is learning to move at blockchain speed. A market that took decades to build its first trillion in traditional form has tokenized $13.7 billion in under three years — and the institutions driving this shift are just getting started. How are you positioning for the moment when tokenized government debt becomes the default collateral layer for global finance?#StockTradingChallengeUpTo17000U
⚠️ Not financial advice.
DYOR ‼️
repost-content-media
  • Reward
  • Comment
  • Repost
  • Share
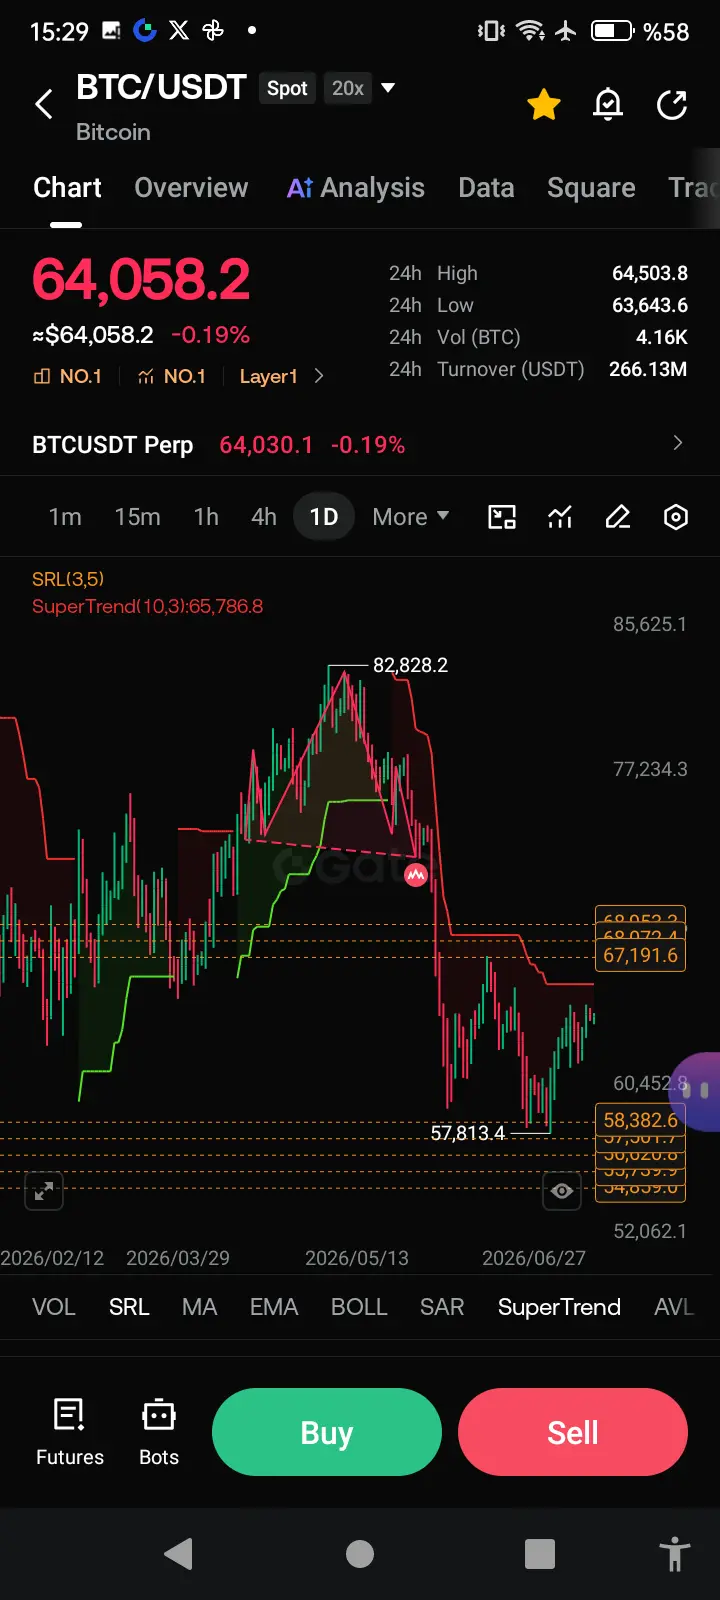
$BTC 13th Giant
Bitcoin is sitting at the same table as the world's most valuable companies—and it's quietly tightening the spring. A $1.46 trillion market cap places it as the 13th largest asset on the planet, nestled comfortably among titans like TSMC, Broadcom, Tesla, and Saudi Aramco. The ranking is a quiet flex, and the next move is building.
🔹 The consolidation zone between $66,000 and $80,000 is growing historically significant. Supply distribution across the network has leveled out, with nearly half of all holders positioned at cost bases that form a powerful support cluster. The mark
BTC-0.33%
User_any
$BTC 13th Giant
Bitcoin is sitting at the same table as the world's most valuable companies—and it's quietly tightening the spring. A $1.46 trillion market cap places it as the 13th largest asset on the planet, nestled comfortably among titans like TSMC, Broadcom, Tesla, and Saudi Aramco. The ranking is a quiet flex, and the next move is building.
🔹 The consolidation zone between $66,000 and $80,000 is growing historically significant. Supply distribution across the network has leveled out, with nearly half of all holders positioned at cost bases that form a powerful support cluster. The market is absorbing every shakeout and building a foundation that could support the next structural leg higher.
🔹 Patience is the play. A full 40% of market participants are positioned at higher cost bases, a setup that often precedes a breakout as sellers exhaust and accumulators step in. The lower end of the range forms a dense buyer zone where conviction has repeatedly overwhelmed fear, and the upper boundary is thinning as resistance gets tested time and again.
🔹 The macro context frames this consolidation in a compelling light. With global equities at all-time highs, small caps surging at their best pace since 1991, and regulatory clarity advancing through the Clarity Act, the broader risk environment remains supportive. Digital gold is coiling while traditional markets rally—and that divergence rarely stays quiet for long.
A $1.46 trillion base camp, a compressed trading range, and a global economy that is warming to risk. Bitcoin is writing its next chapter in the company of giants, and the breakout—when it comes—is being forged in the patience of this very moment. How are you reading this consolidation: a launchpad for the next climb, or a range that still needs time to settle?
#StockTradingChallengeUpTo17000U
repost-content-media
  • Reward
  • Comment
  • 1
  • Share
#WTICrudeFallsBelow90Dollars
Peace or Trap?
WTI crude just crashed through the $90 floor, landing at $89.81—a level that feels like a ceasefire gift to a global economy starved for cheaper energy. The White House confirmed a memorandum of understanding with Iran is now a reality, and traders are sprinting to reprice risk. But beneath this euphoric plunge, inventories are dangerously thin and macro demand is softening. The divergence between the peace premium and physical reality has rarely been this stark.
1️⃣ The Fragile Consensus Reshaping the Middle East
The MoU, brokered through Pakistan,
User_any
#WTICrudeFallsBelow90Dollars
Peace or Trap?
WTI crude just crashed through the $90 floor, landing at $89.81—a level that feels like a ceasefire gift to a global economy starved for cheaper energy. The White House confirmed a memorandum of understanding with Iran is now a reality, and traders are sprinting to reprice risk. But beneath this euphoric plunge, inventories are dangerously thin and macro demand is softening. The divergence between the peace premium and physical reality has rarely been this stark.
1️⃣ The Fragile Consensus Reshaping the Middle East
The MoU, brokered through Pakistan, links a 60-day truce to a phased reopening of the Strait of Hormuz. The framework is a genuine breakthrough, yet the historical pattern is unequivocal: breakthroughs in this conflict are often followed by military incidents that test the deal's durability within days. The situation will likely stabilize in incremental steps—a brief window of calm as oil flows resume, punctuated by the risk of another strike-and-retaliation cycle that keeps risk premiums from fully evaporating.
2️⃣ The Great Oil Tug-of-War: Supply Fears vs. Demand Scars
Short-term, the technical breakdown below $90 opens a path toward the mid-$80s as the "war bid" deflates. However, a structural floor is already rising to meet this decline. U.S. commercial crude inventories remain stubbornly tight, having posted their sixth consecutive weekly draw. As ANZ strategist Daniel Hynes noted, "Oil supply remains constrained, and key sticking points have yet to be resolved." The market is caught between the weight of a slowing global economy and a low-inventory buffer that will violently amplify any supply disruption.
Bulls have the physical barrel count on their side. Bears have diplomacy on theirs. Crude is at the epicenter of a $90 standoff, and the next move depends entirely on whether the ink in that memorandum can hold back a missile. How are you navigating this whipsaw—fading the peace rally on thin supply, or piling into risk assets on the ceasefire momentum?
⚠️ Not financial advice.
repost-content-media
  • Reward
  • Comment
  • Repost
  • Share
Tokenized Reality?
$XLM just detonated 24% in a single session, capping a 43% weekly surge that left the broader market in the dust. The catalyst is not a rumor or a meme—it is a direct pipeline into the $2.3 quadrillion machinery of Wall Street settlement. Stellar’s landmark partnership with #DTCC is pulling the future of tokenized stocks, #ETFs, and Treasuries into the present, and the market is repricing the entire #RWA narrative in real time.
🔹 The RWA comeback is no longer a question—it is a structural migration. #Tokenized U.S. Treasuries have swelled to $13.7 billion, tokenized commodi
XLM4%
RWA-2.12%
User_any
Tokenized Reality?
$XLM just detonated 24% in a single session, capping a 43% weekly surge that left the broader market in the dust. The catalyst is not a rumor or a meme—it is a direct pipeline into the $2.3 quadrillion machinery of Wall Street settlement. Stellar’s landmark partnership with #DTCC is pulling the future of tokenized stocks, #ETFs, and Treasuries into the present, and the market is repricing the entire #RWA narrative in real time.
🔹 The RWA comeback is no longer a question—it is a structural migration. #Tokenized U.S. Treasuries have swelled to $13.7 billion, tokenized commodities crossed $5.1 billion, and the total on-chain real-world asset market now exceeds $34 billion. Stellar’s DTCC collaboration plugs blockchain settlement directly into the core plumbing of U.S. securities markets, transforming a theoretical use case into scheduled infrastructure. This is not a narrative revival; it is the acceleration phase of a multi-trillion-dollar shift.
🔹 The technical dashboard is flashing green with a caution light. XLM smashed through the $0.18 resistance with volume exploding past $1.7 billion, confirming genuine accumulation. Yet the RSI on 4-hour and daily charts has surged deep into overbought territory, and a 4-hour MACD divergence hints at near-term exhaustion. The $0.18 breakout level now serves as the critical floor—a successful retest would transform former resistance into a springboard for the next leg higher. Chasing the candle top carries risk; a disciplined pullback that holds support offers a higher-probability entry.
🔹 U.S. stock tokenization is rapidly becoming the next super-topic. Tokenized equities have rocketed to a $1.6 billion market cap, growing 40x year-over-year, while derivatives volume hit all-time highs above $3.5 billion. Nasdaq approved tokenized Russell 1000 trading, the SEC’s Innovation Exemption provides a regulatory pathway, and DTCC’s embrace of Stellar signals that the world’s largest securities depository is now building the on-chain rails. When the infrastructure that settles over $114 trillion annually targets a 2027 launch for tokenized assets, the conversation shifts from “if” to “how fast.”
XLM is not riding a speculative wave—it is anchoring the infrastructure layer where traditional finance meets blockchain settlement. The DTCC partnership validates the thesis, the volume confirms conviction, and the tokenization supercycle is still in its earliest innings. Are you positioning for the pullback to $0.18 as a gift, or riding the momentum toward $0.25 and beyond?
⚠️ Not financial advice.
repost-content-media
  • Reward
  • Comment
  • Repost
  • Share
#TradFi交易分享挑战
#EthereumMarketWatch #ETHOutlook
Ethereum is entering a highly sensitive phase where market structure, institutional positioning, and macroeconomic pressure are colliding at the same time. After several weeks of unstable price movement, ETH continues trading inside a compressed range near the $2,080 region, reflecting a market that has not yet decided whether it wants to build a recovery structure or prepare for another downside expansion.
Over the last 24 hours, Ethereum briefly tested upper intraday liquidity zones near $2,140 before sellers regained control, pushing price
ETH-1.07%
CryptoSelf
#TradFi交易分享挑战
#EthereumMarketWatch #ETHOutlook
Ethereum is entering a highly sensitive phase where market structure, institutional positioning, and macroeconomic pressure are colliding at the same time. After several weeks of unstable price movement, ETH continues trading inside a compressed range near the $2,080 region, reflecting a market that has not yet decided whether it wants to build a recovery structure or prepare for another downside expansion.
Over the last 24 hours, Ethereum briefly tested upper intraday liquidity zones near $2,140 before sellers regained control, pushing price action back toward the lower consolidation area. The reaction confirms that buyers still lack enough momentum to fully reverse the broader bearish structure that has dominated medium-term charts throughout May.
What makes the current setup especially important is the growing disconnect between market participation and price conviction.
Derivatives activity remains elevated, open interest continues holding near multi-week highs, and leveraged traders are still actively positioning around key levels. However, spot demand has weakened considerably compared to earlier phases of the rally. This imbalance often creates unstable trading conditions where volatility expands rapidly once support or resistance zones finally break.
From a technical perspective, Ethereum is currently sitting inside a compression structure that may soon trigger a larger directional move.
Momentum indicators continue showing weakness beneath the surface. RSI remains below the bullish expansion zone, suggesting buyers have not fully regained control. MACD structure has improved slightly compared to previous sessions, yet the overall momentum profile still lacks strong continuation signals. Trend strength indicators remain soft across both short-term and higher-timeframe charts, confirming that the market is still trapped inside a consolidation phase rather than a true trend reversal.
Moving averages also reveal an important detail many traders are watching closely.
Short-term averages are beginning to flatten near current price action, but medium- and long-term moving averages continue leaning downward. ETH remains below several major dynamic resistance levels, meaning every rebound attempt still faces heavy overhead pressure from trapped sellers and defensive positioning.
Several key price zones now define Ethereum’s short-term battlefield:
• The $2,060–$2,055 region remains the most important immediate support cluster.
This zone previously attracted dip buyers and aligns closely with short-term liquidity defense levels. A confirmed breakdown could expose ETH to accelerated selling pressure toward the psychological $2,000 area.
• The $2,088–$2,100 range continues acting as the first major resistance barrier.
This area combines upper volatility-band resistance with medium-term moving average pressure. Without strong volume expansion, bullish continuation above this region may remain difficult.
• The $2,140 level represents the primary breakout trigger for bulls.
If buyers reclaim this zone with momentum, short liquidations and renewed speculative participation could fuel a stronger upside recovery phase.
Beyond technical structure, macro conditions remain one of the largest variables influencing Ethereum’s direction.
Financial markets continue reacting aggressively to inflation data, Treasury yield movements, and shifting expectations surrounding monetary policy. Risk-sensitive assets such as crypto remain highly correlated to liquidity conditions, which means upcoming economic data releases may heavily influence Ethereum’s next major move.
At the same time, blockchain fundamentals remain surprisingly resilient.
Layer 2 adoption continues expanding rapidly, staking participation remains elevated, and institutional interest surrounding tokenized assets built on Ethereum infrastructure keeps growing. These long-term structural drivers continue supporting the broader Ethereum ecosystem even while short-term price action remains fragile.
Professional traders are now approaching the market with far more tactical discipline.
Instead of chasing emotional momentum, experienced participants are focusing on liquidity zones, volatility compression patterns, and macroeconomic timing. Many are waiting for confirmation before committing heavily in either direction.
Several strategies currently dominate professional positioning:
• Short-term range trading between compression zones
• Reduced leverage during macro uncertainty
• Watching for breakout confirmation above resistance
• Monitoring whale activity and exchange inflows carefully
• Preparing for increased volatility around upcoming economic reports
The most important reality about Ethereum’s current structure is this:
The market is no longer moving purely on hype.
It is reacting to institutional flows, liquidity conditions, derivatives positioning, macroeconomics, and real blockchain utility simultaneously. That combination creates a far more mature — but also far more demanding — trading environment.
And in phases like this, patience often becomes more valuable than prediction.
  • Reward
  • Comment
  • Repost
  • Share
#TradFi交易分享挑战
#MMM
3M Company (MMM) Tech Review: Current Chance and Risk Check for Gate Trade
Date: May 27, 2026
Current Price: 155.00 (+1.78 | +1.16%)
Time Frame: 1-Hour Chart | ∼1 minute to Close
Overall Market View
3M Company (MMM), a long-time leader in the field of goods for firms and buyers, showed a firm rise today. A buy wave that began at the 152.22 intraday level pushed the share to a 156.61 high. It now holds at 155.00. With a bounce in firm stockpiles of late and signs of better work flow at the firm, MMM keeps moving inside a mid-run rising trend lane.
Tech Review: Hol
MMM0.18%
discovery
#TradFi交易分享挑战
#MMM
3M Company (MMM) Tech Review: Current Chance and Risk Check for Gate Trade
Date: May 27, 2026
Current Price: 155.00 (+1.78 | +1.16%)
Time Frame: 1-Hour Chart | ∼1 minute to Close
Overall Market View
3M Company (MMM), a long-time leader in the field of goods for firms and buyers, showed a firm rise today. A buy wave that began at the 152.22 intraday level pushed the share to a 156.61 high. It now holds at 155.00. With a bounce in firm stockpiles of late and signs of better work flow at the firm, MMM keeps moving inside a mid-run rising trend lane.
Tech Review: Hold and Push Zones
Key Push Levels:
156.00 – 156.61 (Short-Run Key Push): Today’s high area. A firm break here could open the path to the 157.55 zone.
158.00 – 160.00: Mid-run mind and tech push band.
Key Hold Levels:
153.80 – 155.10 (Firm Hold): MA30 (153.82), MA10 (155.10), and MA5 (155.46) cross area. Price holding this zone is key for the trend to go on.
152.22 – 153.00: Day low and open area. To keep the short-run bull build, price should not slip under this zone.
147.13: Main hold point if a deeper pullback comes.
Moving Average View:
Price runs above MA5 (155.46) and MA10 (155.10).
MA5 > MA10 > MA30 order proves a clear up trend. This line-up shows the bull market is firm in a tech sense.
MACD Read:
MACD (12,26,9) is at +0.03 in gain ground and just above the zero line. The plus gap between DIF (0.77) and DEA (0.74) shows drive is slowly growing for buyers. Green bars in the histogram point to a chance of more buy push in the short run.
Trader Mood and Market Flow
The chart shows a clear “Pullback After Drop → Bounce” case:
152.22 low level: Made many traders think “is the trend over?” and led to panic sells. Weak hands were cleared here.
Fast rise (152.22 → 156.61): Area where pro and big buyers (smart money) stepped in. The quick bounce proves buy desire in the market is still firm.
Light pullback from 156.61 high: Usual “Profit Take” and “Fear on the Rise” mood. Short-run traders who think “it rose too much, a drop comes” built pressure.
Mind Tips for Gate Trade Users:
When price breaks 156.61, do not fall into FOMO. Take some gains.
At the 153.80 – 155.00 hold zone, look for a planned buy chance, not panic sells.
Swings are at a mid level; trade with rules, not feeling.
Gate Trade Plans (Short and Mid Run)
Bull Case (Odds: 70%):
Lasting hold above 155.00 and break of the 156.61 push.
Aim: 156.61 → 158.00 → 160.00
Stop-Loss: Move under 153.70.
Bear Case (Odds: 30%):
Break of 153.80 hold and close under MA30.
Aim: 152.22 → 149.00 → 147.13
In this case, cut size or hedge is wise.
Tip:
We sit in a mid-firm bull tilt now. For those who plan to open new longs at 155.00, a trade with a 153.70 stop-loss looks sound. For scalpers, band trade chances exist in the 153.80 – 156.60 range.
$MMM
repost-content-media
  • Reward
  • Comment
  • Repost
  • Share
$PAXG Paper Slips. Vaults Fill.
Gold just dropped 2.47% in a single day to $4,439 on May 27 — a $112 haircut that looks brutal on the screen. The tokenized twins, $XAUT and PAXG, slumped in near-perfect lockstep, dragging portfolios lower alongside the spot rout. Yet while the paper market prints red candles, the physical world is quietly hoarding the yellow metal at a pace that rewrites record books. The sell-off you are watching is a tale of two markets, and they are telling completely opposite stories.
🔹 The speculative engine that lifted gold to $5,477 in January has thrown itself into re
PAXG0.1%
XAUT0.18%
XAU0.04%
Sand谋3S
$PAXG Paper Slips. Vaults Fill.
Gold just dropped 2.47% in a single day to $4,439 on May 27 — a $112 haircut that looks brutal on the screen. The tokenized twins, $XAUT and PAXG, slumped in near-perfect lockstep, dragging portfolios lower alongside the spot rout. Yet while the paper market prints red candles, the physical world is quietly hoarding the yellow metal at a pace that rewrites record books. The sell-off you are watching is a tale of two markets, and they are telling completely opposite stories.
🔹 The speculative engine that lifted gold to $5,477 in January has thrown itself into reverse. CFTC data shows non-commercial net long positions tumbled from 171,600 contracts to 159,800 as large speculators cashed out. The 20-day EMA near $4,586 now acts as a hard ceiling, with the RSI wallowing near 39 and pointing lower. The dollar flexing above 106.5 has made gold more expensive for global buyers, while hawkish Fed chatter has shrunk rate-cut bets to zero — raising the opportunity cost of holding a non-yielding asset with every passing session. Goldman captured the near-term risk with precision: gold is "a natural source of cash if private investors face liquidity needs" during equity stress.
🔹 Beneath the paper sell-off, physical demand is rewriting the rules of the gold market. Central banks absorbed 244 tonnes in Q1 2026 — a 17% quarterly surge that places sovereign buying within striking distance of the 350-tonne threshold above which gold prices have historically risen. Goldman Sachs just revised its nowcast of monthly central bank purchases from 29 tonnes to 50 tonnes in March, then guided to 60 tonnes per month through year-end — citing "strong underlying interest in gold" and geopolitical developments that "are likely to reinforce diversification over time". The People's Bank of China added 260,000 troy ounces in April alone, extending an 18-month buying streak. Poland, Uzbekistan, and Kazakhstan all joined the accumulation in Q1.
🔹 The East is absorbing physical metal at a velocity the West has not yet priced in. Chinese investors purchased a record 207 tonnes of gold bars and coins during Q1 2026 — up 67% year-over-year and smashing the previous quarterly record of 155 tonnes set in 2013. Bar and coin demand globally jumped 42% to 474 tonnes, one of the strongest physical buying quarters ever recorded. Gold ETF flows in Asia extended their inflow streak to eight consecutive months, adding another $1.8 billion in April alone, while Hong Kong funds posted a record $732 million monthly inflow. The West may be selling paper gold — the East is buying vaults.
🔹 COMEX inventories are quietly tightening. Registered inventory sits at approximately 15.7 million ounces — a level that has drawn consistent attention throughout May. The structural imbalance between paper claims and physical metal has been building for months, and a June contract with 26.2 million ounces in potential delivery exposure continues to test the system. When the paper-to-physical ratio widens this far, the eventual reconciliation rarely happens gently.
🔹 Tokenized gold has crossed a structural inflection point that decouples it from crypto sentiment. Q1 2026 spot trading volume across PAXG, XAUt, and other gold-backed tokens reached $90.7 billion — exceeding the entire 2025 full-year total of $84.6 billion. Average monthly spot volume hit $11.69 billion, with PAXG and XAUt commanding nearly $6 billion each per month. PAXG alone was ranking fourth by daily trading volume on major exchanges at approximately $868 million — outpacing Solana over that period. Chainalysis data confirms tokenized gold trading correlation with traditional gold markets crossed the high-correlation threshold above 0.70 starting in Q2 2025 and stayed there through Q1 2026. XAUt's market cap has surged past $2.5 billion with 154 tonnes of physical gold in reserve, while PAXG's market share climbed to 41.8%. Tokenized gold is behaving like a gold investment vehicle — with the bonus of 24/7 settlement, instant transfer, and a yield layer that DeFi protocols are only beginning to tap.
🔹 Goldman Sachs held firm on its $5,400 year-end target even as spot gold slid toward $4,450. UBS and ANZ published similarly bullish calls. The fundamental thesis has not changed — inflation remains sticky at 3.8%, the U.S. fiscal deficit is structural, and global de-dollarization is accelerating. The pullback is being read by the deepest-pocketed buyers as a clearance sale, not a regime change.
A $112 single-day drop screams risk. 60 tonnes a month into sovereign vaults whispers something else entirely. The question is: are you trading the paper market that is liquidating, or positioning alongside the central banks that are quietly stacking physical gold — and now tokenized gold — at a pace this market has never seen before?
#StockTradingChallengeUpTo17000U
⚠️ Not financial advice.
  • Reward
  • Comment
  • Repost
  • Share
The Giant Walks Through
The door that kept most of crypto out for a decade just swung wide open for the company that moves $9.5 trillion a year. Mastercard secured a New York BitLicense on May 27 — planting its flag inside the strictest digital asset regulatory fortress in America.
🔹 Mastercard Transaction Services (U.S.) LLC is now officially licensed by the NYDFS. Only three BitLicenses have been issued in all of 2026, and roughly 40 total since 2015 — making this one of the most exclusive lists in finance. This is not a pilot. This is not a press release about "exploring" blockchain. This
MA0.26%
PYUSD-0.01%
User_any
The Giant Walks Through
The door that kept most of crypto out for a decade just swung wide open for the company that moves $9.5 trillion a year. Mastercard secured a New York BitLicense on May 27 — planting its flag inside the strictest digital asset regulatory fortress in America.
🔹 Mastercard Transaction Services (U.S.) LLC is now officially licensed by the NYDFS. Only three BitLicenses have been issued in all of 2026, and roughly 40 total since 2015 — making this one of the most exclusive lists in finance. This is not a pilot. This is not a press release about "exploring" blockchain. This is a fully operational regulated entity now authorized to handle stablecoins, tokenized deposits, and on-chain settlement inside the financial capital of the world.
🔹 Jorn Lambert, Mastercard's Chief Product Officer, drew the line: "Clear regulatory frameworks play an important role in building trust and confidence as new forms of digital value move from experimentation toward practical application. This approval underscores our focus on aligning innovation with regulatory expectations". The payment network that built the global card rails is now wiring those same rails directly into blockchain infrastructure.
🔹 Two months ago, Mastercard dropped a $1.8 billion deal to acquire BVNK, the stablecoin infrastructure firm that moves $30 billion annually across 130 countries. The Genius Act, signed in July 2025, enshrined stablecoin regulation into federal law. The BVNK deal closes the loop — building the plumbing that connects traditional banking with on-chain settlement. The BitLicense is the final piece: the regulatory permission to operate that plumbing in New York, the jurisdiction every institutional counterparty requires before integrating.
🔹 Mastercard's Multi-Token Network already carries JPMorgan, Standard Chartered, and over 85 crypto partners across 176 million wallets. USDC, PYUSD, USDG, and SoFiUSD now settle card transactions in near real-time, 24/7. The BVNK acquisition combined with the BitLicense creates the first regulated bridge where tokenized deposits flow directly into card settlement infrastructure.
A decade-old regulatory fortress, a $1.8 billion stablecoin bet, and 150 million merchant endpoints waiting on the other side — Mastercard is building the on-ramp the entire industry has been waiting for. What do you think this means for the broader crypto market?
$BTC $GT $ETH
#MarketResearch 🕵️
repost-content-media
  • Reward
  • Comment
  • Repost
  • Share
🔥 Gate Newcomer Exclusive Privilege: First deposit 100% cashback, unlock up to 26 USDT
⚡️ All rewards from this event are automatically distributed and credited in real-time
👇 Exclusive real money benefits for new users:
✔️ Verification Gift: Complete identity verification and receive 5 USDT
✔️ Deposit Gift: First deposit ≥ 20 USDT, enjoy 100% cashback
✔️ Contract Gift: First contract trade meets the target, receive 1 USDT cash
Limited prize pool, first come, first served. Click to register now and secure your spot
Join now 🔗:https://gate.onelink.me/7pdk/8010be459ba4a01c
discovery
🔥 Gate Newcomer Exclusive Privilege: First deposit 100% cashback, unlock up to 26 USDT
⚡️ All rewards from this event are automatically distributed and credited in real-time
👇 Exclusive real money benefits for new users:
✔️ Verification Gift: Complete identity verification and receive 5 USDT
✔️ Deposit Gift: First deposit ≥ 20 USDT, enjoy 100% cashback
✔️ Contract Gift: First contract trade meets the target, receive 1 USDT cash
Limited prize pool, first come, first served. Click to register now and secure your spot
Join now 🔗:https://gate.onelink.me/7pdk/8010be459ba4a01c
repost-content-media
  • Reward
  • Comment
  • Repost
  • Share
  • Pinned