PandaX

vip
Age 0.4 Year
Peak Tier 0
No content yet
$FIL Dead Storage or Sleeping Giant?
Filecoin is currently trading under the heavy weight of a $1.00 round number, but the network is quietly transforming from a speculative storage play into verifiable infrastructure for the AI era. The pivot is real, and the chart is compressing in a way that suggests a big move is brewing.
🔹 The fundamental shift is from bootstrapping supply to driving paid, on-chain storage deals. The Filecoin Onchain Cloud, launched in late 2025, is creating a programmable, verifiable storage layer that directly ties FIL usage to service payments. Integrations with AI pr
FIL-6.73%
M谋ngYueZen
$FIL Dead Storage or Sleeping Giant?
Filecoin is currently trading under the heavy weight of a $1.00 round number, but the network is quietly transforming from a speculative storage play into verifiable infrastructure for the AI era. The pivot is real, and the chart is compressing in a way that suggests a big move is brewing.
🔹 The fundamental shift is from bootstrapping supply to driving paid, on-chain storage deals. The Filecoin Onchain Cloud, launched in late 2025, is creating a programmable, verifiable storage layer that directly ties FIL usage to service payments. Integrations with AI projects like AethirCloud and SingularityNET are beginning to connect Filecoin to the booming compute economy. This is no longer about speculative capacity—it is about actual, revenue-generating enterprise usage.
🔹 The tokenomics model, often cited as a headwind, is also a subtle strength. While miner rewards and investor unlocks continue, the real metric to watch is the locked-to-circulating supply ratio. FIL is collateralized for storage deals, removing it from the liquid float. As more enterprises onboard and lock up tokens, the effective circulating supply shrinks, creating a supply-side squeeze that analysts often overlook.
🔹 The technical picture is a classic compression setup. The daily RSI at 46.9 shows neutral momentum, neither overbought nor oversold. Both the 15-minute and 4-hour timeframes are flashing MACD bottom divergence, a signal that selling momentum is exhausting. The price is hovering near the lower end of its range, with immediate resistance sitting at the 78.6% Fibonacci retracement level of $0.973. A decisive break above $1.25 would signal a meaningful recovery, but the current coiling action suggests that the market is preparing for a sharp directional move.
🔹 The upcoming Korean exchange resumption, following the network upgrade halt, could provide a near-term liquidity boost. Standard upgrade halts often precede renewed interest, especially if the upgrade delivers on its promise of improved network efficiency.
The gap between Filecoin's improving fundamentals and its subdued market price is widening. The AI data narrative is gaining traction, the lock-up ratio is climbing, and the chart is coiling. How are you reading this: a value play building a foundation, or a trade that still needs a catalyst to justify a position?
⚠️ Not financial advice.
  • Reward
  • 1
  • 1
  • Share
ybaser:
The bullish market is at its zenith 🐂
$SHIB Quiet Whispers, Loud Charts 🕵️
SHIB is barely moving—up a modest 0.82%—but beneath this sleepy price action, a quiet rotation is stirring. The Altcoin Season Index just climbed 9.38%, and capital is beginning to trickle out of Bitcoin and into the smaller, high-beta names. For a token as sensitive to sentiment as Shiba Inu, the first drip often precedes the wave.
🔹 The early rotation signal is impossible to ignore. When the Altcoin Season Index rises sharply, meme tokens historically catch a bid as retail speculation reignites. SHIB's modest outperformance against a flat Bitcoin sugges
SHIB-1.57%
BTC-0.56%
M谋ngYueZen
$SHIB Quiet Whispers, Loud Charts 🕵️
SHIB is barely moving—up a modest 0.82%—but beneath this sleepy price action, a quiet rotation is stirring. The Altcoin Season Index just climbed 9.38%, and capital is beginning to trickle out of Bitcoin and into the smaller, high-beta names. For a token as sensitive to sentiment as Shiba Inu, the first drip often precedes the wave.
🔹 The early rotation signal is impossible to ignore. When the Altcoin Season Index rises sharply, meme tokens historically catch a bid as retail speculation reignites. SHIB's modest outperformance against a flat Bitcoin suggests the smart money is positioning before the crowd arrives. The index sitting at 35 leaves plenty of room to run before reaching the 75 threshold that signals full-blown altseason.
🔹 The chart is compressed and coiling. Short-term timeframes flash a bullish alignment with the 15-minute Williams %R oversold, hinting at an immediate snapback. The daily structure tells a different story—the 7-day moving average remains below the 30-day and 120-day, and the ADX at 32.9 confirms the downtrend has momentum. This is a tug-of-war between a short-term bounce and a dominant daily trend.
🔹 The $0.0000050 support zone is the critical floor. Holding above it keeps the path open toward $0.0000055, a level that would confirm the relief rally has genuine strength. A breakdown below opens the door to recent lows near $0.0000052. The 24-hour volume has dipped, suggesting the market is waiting for a catalyst—and Bitcoin's next move is likely to provide it.
A whisper of rotation, a chart waiting for confirmation, and a token that has historically rewarded those who positioned before the stampede. The gap between the sleepy price and the stirring Altcoin Season Index is where the opportunity hides. Are you waiting for the breakout confirmation, or quietly accumulating while SHIB rests at support?
  • Reward
  • 1
  • Repost
  • Share
ybaser:
The bullish market is at its zenith 🐂
#WTICrudeFallsBelow90Dollars
The break below the 90-dollar level by WTI crude oil has become one of the most closely watched developments across global financial markets. More importantly, it highlights a significant shift in market focus. For months, traders were primarily concerned about geopolitical risks in the Middle East and the possibility of supply disruptions. Today, however, investors appear increasingly focused on slowing economic activity, high interest rates, and their potential impact on global energy demand.
The decline below 90 dollars is not simply a price movement. It repr
CL1.2%
Last_Satoshi
#WTICrudeFallsBelow90Dollars
The break below the 90-dollar level by WTI crude oil has become one of the most closely watched developments across global financial markets. More importantly, it highlights a significant shift in market focus. For months, traders were primarily concerned about geopolitical risks in the Middle East and the possibility of supply disruptions. Today, however, investors appear increasingly focused on slowing economic activity, high interest rates, and their potential impact on global energy demand.
The decline below 90 dollars is not simply a price movement. It represents a change in market psychology.
Throughout recent months, geopolitical tensions between the United States and Iran created a substantial risk premium in oil prices. Markets feared potential disruptions to shipping routes, regional instability, and supply-chain shocks. Yet despite ongoing uncertainty, traders have gradually become less reactive to geopolitical headlines and more sensitive to economic indicators.
The reason is straightforward.
High interest rates continue to pressure economic growth across many major economies. Elevated borrowing costs reduce business investment, slow manufacturing activity, and weaken consumer spending. Since crude oil demand is closely linked to economic activity, investors are increasingly questioning whether global consumption growth can remain strong enough to support higher prices.
At the same time, the downside for oil remains limited by a crucial factor: inventories.
Global crude stockpiles remain relatively tight compared with historical averages. Production discipline from major exporters and ongoing supply management efforts continue to provide structural support beneath the market. This explains why every sharp decline has so far attracted buyers looking for value opportunities.
From a professional trading perspective, oil is currently caught between two competing forces.
Bearish Factors
• High interest rates restricting economic expansion
• Slower industrial activity in several major economies
• Concerns regarding future energy demand growth
• Stronger focus on macroeconomic risks than geopolitical risks
Bullish Factors
• Relatively low global inventories
• Ongoing supply discipline from major producers
• Potential geopolitical disruptions that could quickly impact supply
• Seasonal demand support during peak consumption periods
This balance creates an environment where volatility remains elevated.
Looking ahead, the most important support zone sits near the mid-to-upper 80-dollar range. If buyers continue defending this area, crude oil could establish a stable base before attempting a recovery. A sustained move back above 90 dollars would likely improve sentiment and attract momentum traders once again.
On the other hand, if economic data deteriorates further and recession concerns gain momentum, crude oil may face additional selling pressure despite supportive inventory conditions.
Investor psychology remains particularly interesting at this stage.
Large institutional participants are no longer aggressively bullish, yet they are also reluctant to build substantial bearish positions. The combination of tight supply conditions and unresolved geopolitical risks makes it difficult to justify an extremely negative outlook. As a result, many professional traders are adopting a more flexible approach, focusing on short-term opportunities while waiting for stronger directional signals.
The evolving negotiations surrounding Iran also remain a key variable. While diplomatic progress could reduce part of the geopolitical premium embedded in energy markets, any unexpected escalation would likely trigger an immediate reassessment of supply risks. This uncertainty continues to act as an invisible support mechanism beneath crude prices.
My overall view is that crude oil is entering a consolidation phase rather than a prolonged collapse. Demand concerns are real and deserve attention, but supply conditions remain sufficiently tight to prevent a deep and sustained downturn under current circumstances.
For traders, this is a market that rewards patience, discipline, and adaptability. The next major move will likely be determined not by a single headline, but by the interaction between economic growth expectations, inventory trends, central-bank policy, and developments across the Middle East.
In today's environment, oil is no longer trading solely as an energy commodity. It has become a real-time indicator of global growth expectations, inflation pressures, geopolitical stability, and investor confidence all at once.
  • Reward
  • Comment
  • Repost
  • Share
#Polymarket每日热点
June Fed Decision Prediction: Interest Rates to Remain Unchanged, Hawkish Tone
While Kevin Warsh's appointment has raised expectations that the Fed may adopt a more hawkish stance, it is likely that the June 16-17 meeting will see no change in the federal funds rate. Market pricing in futures and forecast markets continues to overwhelmingly support a pause rather than a sudden increase or decrease.
Why I expect it to remain unchanged:
1. Leadership changed, but data hasn't improved enough
* Inflation remains above the Fed's comfort zone, and recent readings show persistent pri
SinCity
#Polymarket每日热点
June Fed Decision Prediction: Interest Rates to Remain Unchanged, Hawkish Tone
While Kevin Warsh's appointment has raised expectations that the Fed may adopt a more hawkish stance, it is likely that the June 16-17 meeting will see no change in the federal funds rate. Market pricing in futures and forecast markets continues to overwhelmingly support a pause rather than a sudden increase or decrease.
Why I expect it to remain unchanged:
1. Leadership changed, but data hasn't improved enough
* Inflation remains above the Fed's comfort zone, and recent readings show persistent price pressures.
* At the same time, the Fed generally avoids abrupt policy changes at a new president's first meeting unless conditions are extreme.
  • Reward
  • Comment
  • Repost
  • Share
$BTC Institutional Grip Tightens
One in every five Bitcoin now sits in the vaults of Wall Street, governments, and corporate treasuries. Institutions control 18.5% of Bitcoin's circulating supply, a figure that has quietly surged as the latest price dip shakes out short-term speculators. While the 15-minute chart flashes bearish, the daily timeframe is coiling for a move that history suggests could be explosive.
🔹 The concentration of supply in institutional hands is accelerating. Spot ETFs, public companies like Strategy holding over 843,000 BTC, the U.S. government's strategic stash of 328,
BTC-0.56%
IBIT-2.1%
XAUUSD0.99%
User_any
$BTC Institutional Grip Tightens
One in every five Bitcoin now sits in the vaults of Wall Street, governments, and corporate treasuries. Institutions control 18.5% of Bitcoin's circulating supply, a figure that has quietly surged as the latest price dip shakes out short-term speculators. While the 15-minute chart flashes bearish, the daily timeframe is coiling for a move that history suggests could be explosive.
🔹 The concentration of supply in institutional hands is accelerating. Spot ETFs, public companies like Strategy holding over 843,000 BTC, the U.S. government's strategic stash of 328,372 coins, and private funds have quietly absorbed the sell-side pressure that dominated late May. This isn't a passive trend—it's a deliberate accumulation by entities with multi-year horizons. Exchange reserves have simultaneously collapsed to seven-year lows, draining the liquid float that short-term traders rely on.
🔹 The technical dashboard shows a market at maximum tension. The 15-minute MACD is flashing a bearish divergence, hinting at immediate pullback risk. Yet zoom out: the 4-hour and daily CCI and Williams %R are deep in oversold territory, and the daily Parabolic SAR remains locked in a bullish trend. Panic volume is spiking—a classic signature of a capitulation flush that often precedes sharp reversals. The $72,500 zone is being tested, but the daily structure suggests a rebound is brewing beneath the surface.
🔹 The divergence between short-term fear and long-term conviction is staggering. ETF outflows made headlines last week, with BlackRock's IBIT shedding $528 million in a single day. But the broader institutional universe keeps stacking. Wallets holding significant BTC have accumulated 61,000 coins in May alone. The supply shock thesis is not a theory anymore—it's a visible contraction of available coins while demand quietly builds.
🔹 The macro backdrop adds a layer of urgency. Global equities are at all-time highs, small caps are posting their best start since 1991, and regulatory clarity is advancing through the CLARITY Act. Bitcoin's 85% correlation with gold reinforces its status as a strategic hedge in a world of persistent inflation and geopolitical friction. When the RSI resets from these oversold depths, the snapback has historically been swift and punishing for late shorts.
Institutions are buying the fear while the crowd is panic-selling. The daily chart is oversold, the weekly structure remains intact, and 18.5% of the supply is locked in hands that don't flinch. How are you reading this moment—a dangerous trap for bulls, or the final shakeout before the next leg up?
⚠️ Not financial advice.
repost-content-media
  • Reward
  • Comment
  • 1
  • Share
Regulation Ignites. Altcoins Awaken.
A single CFTC approval just detonated a sector-wide rally while Bitcoin consolidates. The U.S. regulator greenlit the first listed perpetual derivatives contract on May 29, and the market responded with a $2.48 trillion surge. Capital is sprinting toward the tokens that carry regulatory clarity and institutional infrastructure on their backs.
🔹 Stellar erupted 24% in a single session, capping a 78% weekly gain that stands as the most powerful altcoin breakout of the month. The DTCC partnership—connecting the $2.3 quadrillion securities settlement giant to
BTC-0.56%
XLM-0.88%
LIT-6.17%
HYPE0.95%
User_any
Regulation Ignites. Altcoins Awaken.
A single CFTC approval just detonated a sector-wide rally while Bitcoin consolidates. The U.S. regulator greenlit the first listed perpetual derivatives contract on May 29, and the market responded with a $2.48 trillion surge. Capital is sprinting toward the tokens that carry regulatory clarity and institutional infrastructure on their backs.
🔹 Stellar erupted 24% in a single session, capping a 78% weekly gain that stands as the most powerful altcoin breakout of the month. The DTCC partnership—connecting the $2.3 quadrillion securities settlement giant to the Stellar network—is a fundamental re-rating, not a speculative pump. Over $12 million in short positions were liquidated as the market repriced XLM for its new role in tokenized securities infrastructure.
🔹 Lighter surged 22% on the CFTC approval itself. As a decentralized perpetuals exchange, LIT is a direct beneficiary of regulatory clarity for on-chain derivatives. The market is pricing in the protocol's potential to capture a share of the $3.57 billion tokenized derivatives volume that smashed all-time highs this month. Speculation around future partnerships adds a layer of upside optionality.
🔹 Hyperliquid printed a fresh all-time high at $67.15 as the CFTC's green light validated the entire on-chain perpetuals sector. The platform already controls nearly 70% of the on-chain perpetual futures market, and the regulatory tailwind strengthens its position as the dominant infrastructure layer. The buyback engine—routing 97-99% of trading revenue into open-market HYPE purchases—adds a structural demand floor beneath the price.
🔹 The broader market is flashing a cautious but genuine relief rally. The Altcoin Season Index climbed 5.56%, the Fear & Greed Index ticked up from extreme fear, and capital is rotating out of stagnant majors into high-beta narratives. The $2.53 trillion resistance zone is the next hurdle—a clean break above it opens the door to $2.60 trillion. The $2.47 trillion support must hold to confirm this bounce has staying power.
One CFTC approval. Three tokens surging over 20%. A market that was starved for regulatory clarity just found its catalyst. The old playbook of waiting for Bitcoin to lead is being rewritten in real time—sector-specific news is driving alpha, and the traders who spot it first capture the lion's share. How are you positioning: chasing the momentum names that just broke out, or accumulating the infrastructure plays still waiting for their catalyst?
#CryptoMarket
⚠️ Not financial advice.
🕵️ DYOR
repost-content-media
  • Reward
  • Comment
  • Repost
  • Share
$JNJ A legal storm just scored a direct hit, yet this healthcare giant refuses to fall. Johnson & Johnson absorbed a blow after a Texas bankruptcy court rejected its structured settlement plan for talc lawsuits. The stock, trading at $225.33, held firm above its critical 200-day moving average of $211.62. This resilience points to a safe harbor, not a sinking ship.
🔹 Temporary legal fog cannot silence a roaring operational engine. The revenue loss from patent expirations on drugs like Stelara is being rapidly offset by powerful growth in the oncology segment. This portfolio transformation is
JNJ0.07%
User_any
$JNJ A legal storm just scored a direct hit, yet this healthcare giant refuses to fall. Johnson & Johnson absorbed a blow after a Texas bankruptcy court rejected its structured settlement plan for talc lawsuits. The stock, trading at $225.33, held firm above its critical 200-day moving average of $211.62. This resilience points to a safe harbor, not a sinking ship.
🔹 Temporary legal fog cannot silence a roaring operational engine. The revenue loss from patent expirations on drugs like Stelara is being rapidly offset by powerful growth in the oncology segment. This portfolio transformation is so strong that the consensus earnings estimate for 2026 has been raised to $11.57 per share. The company is not simply shrinking; it is restructuring profitably.
🔹 The technical picture shows the scars of a short-term storm, but the defensive line holds. With a market capitalization of $542.4 billion and a dividend yield of 2.38%, JNJ remains a shelter for funds fleeing technology-driven volatility. The recent selling pressure is a healthy breather, not a panic.
A giant clearing a legal hurdle, closing a patent cliff with oncology strength, and sustaining a reliable cash flow stream. Do you keep this kind of defensive insurance in your portfolio?
⚠️ Not financial advice.
👉 DYOR ☑️
repost-content-media
  • Reward
  • 1
  • 1
  • Share
ybaser:
The bullish market is at its zenith 🐂
$XRP Outflow Proof?
While crypto markets wrestle with fear, a silent $11.88 million just flowed into XRP ETFs, pushing total net assets to a solid $1.12 billion. XRP itself climbed 1.85% to $1.35, leaving Bitcoin's flat performance in the dust. This is not a sympathy bounce—it's independent accumulation happening in plain sight.
🔹 Institutional capital is voting with its wallets. The funds from Bitwise, Canary, and Franklin Templeton attracted fresh inflows on May 29, a session where broader crypto ETF complexes continued their withdrawal streaks. This resilience signals a deliberate allocati
XRP-1.88%
BTC-0.56%
User_any
$XRP Outflow Proof?
While crypto markets wrestle with fear, a silent $11.88 million just flowed into XRP ETFs, pushing total net assets to a solid $1.12 billion. XRP itself climbed 1.85% to $1.35, leaving Bitcoin's flat performance in the dust. This is not a sympathy bounce—it's independent accumulation happening in plain sight.
🔹 Institutional capital is voting with its wallets. The funds from Bitwise, Canary, and Franklin Templeton attracted fresh inflows on May 29, a session where broader crypto ETF complexes continued their withdrawal streaks. This resilience signals a deliberate allocation shift, with investors anticipating the regulatory and adoption milestones now taking shape.
🔹 The XRP Ledger is fortifying its foundations. RippleX Engineering Director Vijay Khanna confirmed that the recent security update is only the first step. An AI-assisted red team reviewed hundreds of issues, and a new culture of "attackathons" will harden future protocol amendments. This institutional-grade commitment to reliability directly supports the network's appeal for financial institutions.
🔹 The macro backdrop keeps improving. The CLARITY Act's progress toward a Senate vote offers the prospect of permanent commodity classification, while CME's upcoming 24/7 XRP futures expand institutional access. Every piece of regulatory clarity broadens the path for the kind of steady ETF demand now materializing.
🔹 XRP's outperformance against Bitcoin carries a clear message. The daily chart shows a hold above $1.30 support, with a path toward the $1.40–$1.45 resistance zone. The 1.85% gain was built without a volume spike, indicating quiet accumulation rather than a speculative pump. When buying pressure absorbs supply without fanfare, it often signals conviction rather than hype.
The ETF complex is planting its flag, the engineers are hardening the rails, and the price is quietly climbing the wall of worry. Institutional money often speaks in whispers before it roars. Are you listening to the flows, or waiting for the headline that everyone else will chase?
##XRP #ETF
⚠️ Not financial advice.
Pls DYOR ☑️
repost-content-media
  • Reward
  • Comment
  • Repost
  • Share
#TradFi交易分享挑战
#TSM
Taiwan Semiconductor Manufacturing Company (TSM) is currently trading around $419.60 as of late May 2026. The stock has delivered an exceptional rally of over +116% in the past year, making it one of the strongest large-cap performers in the global semiconductor sector. The company now holds a market capitalization of approximately $2.17 trillion, placing it among the most valuable technology-related firms in the world.
TSMC remains the world’s leading semiconductor foundry, producing advanced chips for major technology companies such as Nvidia, Apple, AMD, Qualcomm, and B
TSM-1.02%
discovery
#TradFi交易分享挑战
#TSM
Taiwan Semiconductor Manufacturing Company (TSM) is currently trading around $419.60 as of late May 2026. The stock has delivered an exceptional rally of over +116% in the past year, making it one of the strongest large-cap performers in the global semiconductor sector. The company now holds a market capitalization of approximately $2.17 trillion, placing it among the most valuable technology-related firms in the world.
TSMC remains the world’s leading semiconductor foundry, producing advanced chips for major technology companies such as Nvidia, Apple, AMD, Qualcomm, and Broadcom. The recent price action reflects strong investor confidence driven by artificial intelligence demand, advanced chip manufacturing leadership, and long-term supply dominance.
Recent Performance and Price Action
TSM recently reached a new 52-week high above $422 before slightly pulling back toward the $415–$419 zone. This minor decline is considered a normal consolidation phase after a strong breakout. Over the past year, the stock has risen from approximately $170 to above $419, reflecting a gain of more than 140%.
The trend remains strongly bullish across all major timeframes. Buyers continue to step in on dips, while institutional demand remains steady due to long-term AI infrastructure expansion. Short-term volatility is present, but it is occurring within a clearly upward structural trend.
Earnings Performance and Financial Strength
The latest Q1 2026 earnings report showed strong fundamentals. Revenue reached approximately $35.9 billion, reflecting over 35% year-over-year growth and beating market expectations. Earnings per share also exceeded forecasts, confirming strong operational efficiency.
Gross margins expanded significantly to above 66%, driven by increasing production of advanced nodes such as 3nm and preparation for 2nm manufacturing. Management also raised full-year revenue guidance to above 30% growth, reinforcing confidence in continued demand strength.
Capital expenditure is projected to reach up to $56 billion in 2026, showing aggressive expansion plans to meet rising global chip demand. The company also emphasized that AI demand is not temporary but structural and long-term in nature.
AI Supercycle and Growth Drivers
The main growth driver for TSMC is the global artificial intelligence infrastructure cycle. The company manufactures the most advanced AI chips used in data centers, including GPUs and custom AI accelerators.
Demand from hyperscale cloud providers and AI companies continues to accelerate, requiring significantly more advanced semiconductor capacity. TSMC benefits directly from this trend because it controls leading-edge manufacturing technology and high-performance chip production.
Additional growth comes from advanced packaging technologies and new production nodes such as 3nm and upcoming 2nm chips. These technologies increase pricing power and improve margins.
Technical Analysis and Key Levels
TSM remains in a strong uptrend on the technical chart. The stock trades above its 20-day, 50-day, and 200-day moving averages, confirming a long-term bullish structure.
Key support levels are located around $400, followed by stronger support near $382. The 200-day moving average near $323 represents the long-term trend base. On the upside, resistance is seen near $420–$425. A breakout above this zone could lead to price movement toward $440–$460.
Momentum indicators show strength but also suggest short-term consolidation due to extended conditions after a strong rally.
Forecast and Price Outlook
Analyst forecasts remain generally positive. Most models suggest a 12-month price range between $460 and $500 under normal conditions. More optimistic projections suggest potential movement toward $520 if AI demand continues to accelerate and earnings remain strong.
Short-term expectations suggest trading between $400 and $425 as the market consolidates recent gains. Medium-term outlook points toward $440–$480 if resistance is broken with strong volume.
Long-term projections remain bullish due to structural AI demand, capacity expansion, and pricing power in advanced semiconductor manufacturing.
Market Sentiment and Trader Positioning
Investor sentiment is strongly positive. Institutional investors continue to accumulate positions due to TSMC’s central role in global AI infrastructure. Hedge funds and long-term portfolios view the stock as a core holding in semiconductor exposure.
Retail trader sentiment is also bullish, driven by strong price momentum and consistent earnings growth. Options activity shows balanced positioning, with both hedging and continuation trades present.
Despite strong optimism, some caution exists due to extended valuation levels and geopolitical exposure, which may lead to short-term volatility.
Risk Factors
The main risk for TSMC is geopolitical uncertainty, particularly related to Taiwan’s strategic position. Any escalation in regional tensions could significantly impact market sentiment.
Valuation risk is also present, as the stock trades at a premium due to strong growth expectations. Any slowdown in earnings or guidance could trigger corrections.
Other risks include global demand fluctuations, supply chain disruptions, and shifts in AI investment cycles. Short-term technical pullbacks of 5–10% remain possible even within a strong bullish trend.
Trading Strategy Overview
For short-term traders, the key resistance zone is $420–$425. A confirmed breakout above this level may open upside toward $440. Support near $400 provides a potential entry zone during pullbacks.
Medium-term traders may consider accumulation between $386 and $400 with targets toward $460–$480. Stop-loss levels are typically placed below $380 to manage downside risk.
Long-term investors may view dips as accumulation opportunities, focusing on the structural AI growth trend and semiconductor leadership position of TSMC.
Conclusion
Taiwan Semiconductor Manufacturing Company remains one of the strongest structural growth stories in global markets. The combination of AI-driven demand, technological leadership, and pricing power supports a long-term bullish outlook.
While short-term volatility and geopolitical risks remain important factors, the overall trend structure continues to favor upside. Medium-term targets point toward $460–$500, while extended bullish scenarios may reach beyond $520 if current conditions persist.
@Gate_Square @Gate广场_Official
  • Reward
  • Comment
  • 1
  • Share
#$LAB
LAB/USDT 深度市场分析 — 动量、结构、心理与项目展望
LAB 已进入当前 DeFi 轮换周期中最激进的扩张阶段之一。最新突破中区盘整区,推动波动性急剧上升,同时交易活动加快,投机参与度也在增加。在4小时结构中,价格在短时间内扩展超过31%,并暂时接近上方波动带,显示出强劲的短期动量,但也表明情绪化交易条件升高。
当前市场结构
图表显示在大约3.6到5.0 USDT之间的长时间横盘压缩阶段后出现强劲的冲破。这种结构通常表示积累后伴随流动性扩张。
最重要的观察是价格重新占领布林带中轨,并立即加速向上轨移动。在强势动量环境中,这种行为通常反映出买方占优和空头清算,而非纯粹的现货需求。
目前,市场参与者似乎分为三组:
早期买家保护利润
追逐持续性的动量交易者
因害怕错失而情绪性入场的后期买家
这种组合通常会产生非常锐利的蜡烛线和不稳定的盘中波动。
关键阻力区
第一区域
5.90 — 6.15 USDT
此区域在心理上非常重要,因为当前的突破蜡烛正激烈测试此区域。卖家可能会在此尝试获利了结。
主要阻力区
6.80 — 7.45 USDT
这是图表上最强的可见供应区。之前向7.451的爆炸性蜡烛显示出沉重的历史卖压和可能的鲸鱼分布活动。
如果价格再次到达此区域且成交量减弱,拒绝的概率将大大增加。
关键支撑区
即时支撑
5.20 — 5.35 USDT
短期动量支撑。保持
LAB12.88%
BTC-0.56%
discovery
#$LAB
LAB/USDT Deep Market Analysis — Momentum, Structure, Psychology & Project Outlook
LAB has entered one of the most aggressive expansion phases seen in the current DeFi rotation cycle. The latest move above the mid-range consolidation zone pushed volatility sharply higher, while trading activity accelerated together with speculative participation. On the 4H structure, price expanded more than 31% within a short period and temporarily approached the upper volatility band, signaling strong short-term momentum but also elevated emotional trading conditions.
Current Market Structure
The chart shows a powerful impulsive breakout after a prolonged sideways compression phase between approximately 3.6 and 5.0 USDT. This type of structure usually indicates accumulation followed by liquidity expansion.
The most important observation is that price reclaimed the Bollinger mid-band and immediately accelerated toward the upper band. In strong momentum environments, this behavior often reflects aggressive buyer dominance and short liquidations rather than purely spot-driven demand.
At the moment, market participants appear divided into three groups:
Early buyers protecting profits
Momentum traders chasing continuation
Late entrants entering through emotional fear of missing out
That combination usually creates very sharp candles and unstable intraday swings.
Key Resistance Zones
First Resistance Area
5.90 — 6.15 USDT
This region is psychologically important because the current breakout candle is testing this zone aggressively. Sellers may attempt profit realization here.
Major Resistance Area
6.80 — 7.45 USDT
This is the strongest visible supply zone on the chart. The previous explosive wick toward 7.451 indicates heavy historical selling pressure and possible whale distribution activity.
If price reaches this region again with weakening volume, rejection probability rises significantly.
Key Support Zones
Immediate Support
5.20 — 5.35 USDT
Short-term momentum support. Remaining above this area preserves bullish control.
Structural Support
4.55 — 4.70 USDT
This aligns closely with the Bollinger middle band and previous consolidation range. A healthy correction could revisit this area without damaging the broader structure.
Critical Breakdown Zone
3.60 — 3.75 USDT
Loss of this region would severely weaken bullish structure and could trigger broader fear-driven selling pressure.
Volatility & Market Psychology
LAB currently reflects a classic high-beta speculative behavior pattern.
Several psychological stages are visible:
Compression Phase
Low attention, reduced volatility, silent accumulation.
Expansion Phase
Sudden volume growth attracts speculative capital.
Emotional Participation
Retail traders begin entering after large green candles appear.
Profit Rotation Risk
Early buyers may distribute positions into rising momentum.
The current stage appears to be between phases 3 and 4.
This is usually the period where volatility becomes extreme. Candle movements may become irrational temporarily due to leveraged positioning and aggressive sentiment swings.
Bollinger Band Analysis
The Bollinger Bands are expanding aggressively, which confirms volatility expansion.
Current structure suggests:
Upper band breakout momentum remains active
Mean reversion risk increases after vertical candles
Short-term overheating conditions may develop if volume weakens
When candles move too far away from the middle band without healthy consolidation, correction probability statistically rises.
Liquidity Behavior & Whale Activity
The chart structure suggests that liquidity sweeps are playing a major role.
Several long lower wicks indicate:
Stop-hunting behavior
Forced liquidations
Rapid absorption by larger participants
This kind of price action is common in smaller-cap high-volatility assets where liquidity depth remains limited.
Large players often exploit emotional entries by creating sharp upward expansions followed by rapid retracements.
DeFi Sector Context
LAB’s recent strength also aligns with broader renewed attention toward DeFi-related ecosystems and speculative infrastructure narratives.
Capital rotation inside crypto markets typically moves through phases:
Bitcoin dominance expansion
Large-cap altcoin recovery
Mid-cap speculative rotation
High-risk DeFi acceleration
LAB currently appears positioned inside the speculative rotation phase where traders seek higher volatility opportunities.
Risk Factors Investors Should Watch Carefully
Overextended Momentum
Parabolic candles rarely continue infinitely without consolidation.
Volume Sustainability
If price rises while volume declines, exhaustion risk increases.
Liquidation Cascades
Highly leveraged conditions can create sudden sharp reversals.
Whale Distribution
Large holders may use breakout excitement to exit positions gradually.
Emotional Trading
Fear-driven entries near resistance zones often create poor risk positioning.
What Strong Bulls Need To Maintain
For bullish continuation:
Price should remain above 5.20
Volume should remain elevated
Pullbacks should produce higher lows
Momentum candles should avoid immediate rejection
If these conditions remain valid, market structure can continue favoring upside continuation attempts toward higher resistance regions.
Professional Outlook
LAB currently shows one of the strongest short-term momentum structures among speculative DeFi-focused assets. However, the speed of the expansion also increases instability risk.
The most important factor now is whether buyers can transform this explosive breakout into sustainable higher-low structure instead of a temporary emotional spike.
Strong trends are built through:
Consolidation
Controlled pullbacks
Healthy volume continuation
Gradual market participation
If volatility becomes too aggressive without structural support formation, probability of sharp corrections rises significantly.
For disciplined investors, the coming sessions are likely more important than the breakout itself. Market behavior after excitement usually reveals whether the move represents genuine structural strength or temporary speculative overheating.
$LAB ‌
repost-content-media
  • Reward
  • Comment
  • Repost
  • Share
View Original
discovery
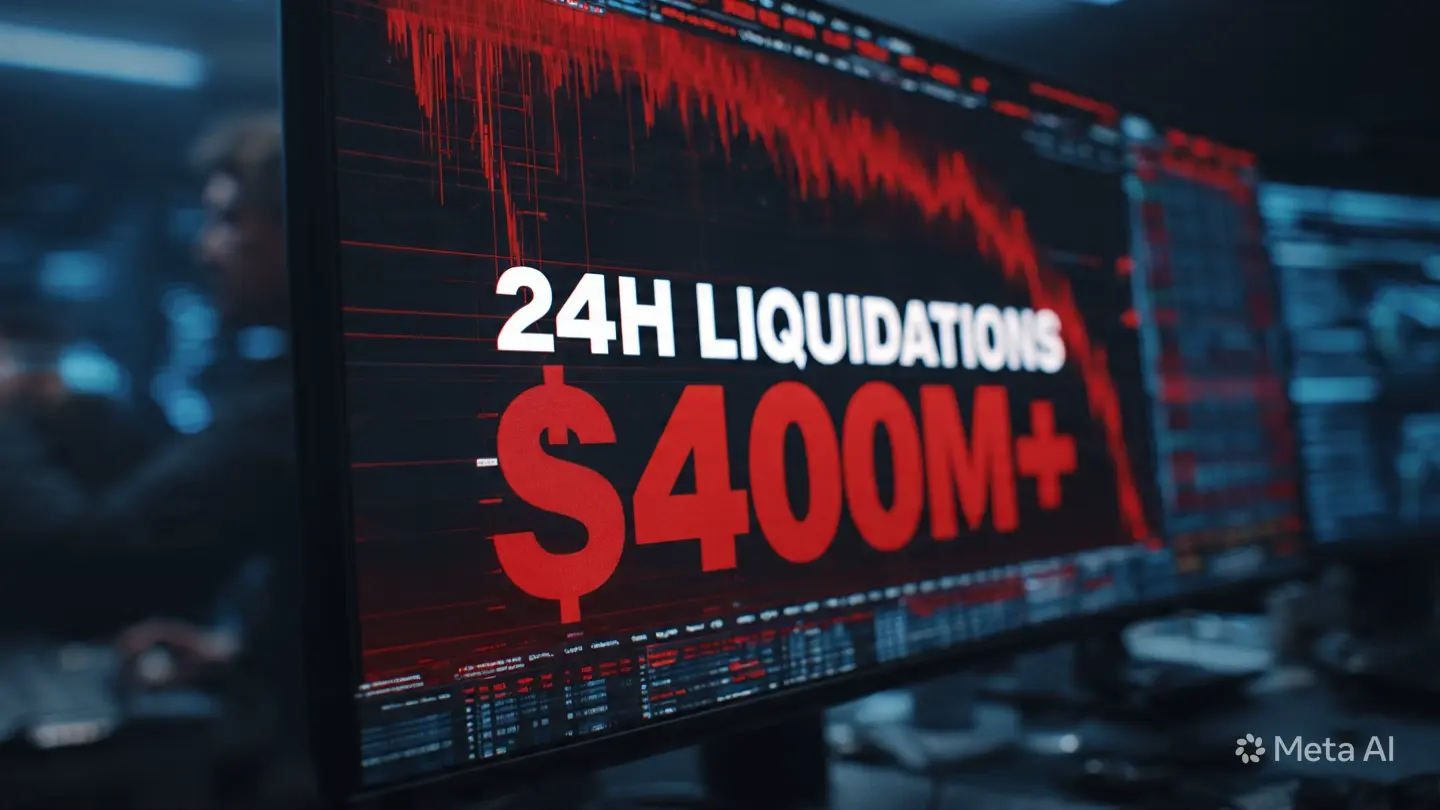
#24hCryptoFuturesLiquidationsTop400M
𝗠𝗔𝗥𝗞𝗘𝗧 𝗖𝗟𝗘𝗔𝗡𝗦𝗘: 𝗧𝗛𝗘 𝟰𝟬𝟬 𝗠𝗜𝗟𝗟𝗜𝗢𝗡 𝗗𝗢𝗟𝗟𝗔𝗥 𝗩𝗘𝗟𝗢𝗖𝗜𝗧𝗬 𝗦𝗛𝗔𝗞𝗜𝗡𝗚 𝗟𝗘𝗩𝗘𝗥𝗔𝗚𝗘𝗗 𝗣𝗢𝗦𝗜𝗧𝗜𝗢𝗡𝗦
The derivative ecosystem within global digital asset trading has witnessed one of its sharpest course corrections. High-leverage environments, while amplifying potential yields, introduce systemic vulnerability when sudden price swings trigger forced position closures. A massive wave of closures has swept through the order books, demonstrating how quickly capital efficiency can transform into rapid order execution spirals when market momentum shifts abruptly against crowded biases.
This massive adjustment, where total forced liquidations exceeded four hundred million dollars in a single daily cycle, underscores the delicate balance between systemic risk and open-source pricing mechanisms. When rapid fluctuations breach collateral thresholds, automated systems execute immediate risk-reduction protocols. This automatic closing of directional views creates a domino effect, accelerating order flow velocity and temporarily catching over-extended participants off guard.
The underlying catalyst for this recent volatility stems from a combination of global macroeconomic adjustments and shifts in institutional capital flows. As economic indicators signal changing parameters for global liquidity, high-yield derivative channels experience rapid re-pricing. When millions of dollars in biased exposure dissolve simultaneously, the market effectively flattens excess speculation, returning asset valuations to more sustainable baseline levels.
Looking ahead, this massive flushing of over-leveraged exposure serves as a structural reset that enhances overall market resilience. Successful portfolio managers use these macro liquidations as a blueprint to refine risk architecture, relying heavily on precise stop-loss implementation and disciplined capital allocation. By shaking out short-term speculative froth, the digital asset framework builds a deeper, more robust foundation, paving the way for sustainable volume growth and more stable integration with the wider global economy.
#24hCryptoFuturesLiquidationsTop400M
repost-content-media
  • Reward
  • Comment
  • Repost
  • Share
#TradeCFDWinGold
In periods when risks are redefined in the global financial markets, and macroeconomic data and geopolitical developments set the direction, the strategic importance of safe haven assets becomes much more prominent. For professionals seeking to benefit from price movements instantly by stepping outside traditional investment patterns, forward contracts offer unique solutions in terms of liquidity and flexibility. Especially, precious metals, which are recognized globally as the most durable store of value, play a leading role in capital growth and portfolio balancing moves by
M谋ngYueZen
#TradeCFDWinGold
In periods when risks are redefined in the global financial markets, and macroeconomic data and geopolitical developments set the direction, the strategic importance of safe haven assets becomes much more prominent. For professionals seeking to benefit from price movements instantly by stepping outside traditional investment patterns, forward contracts offer unique solutions in terms of liquidity and flexibility. Especially, precious metals, which are recognized globally as the most durable store of value, play a leading role in capital growth and portfolio balancing moves by investors with high financial literacy.
The Safe Haven Role of Precious Metals and Market Context
Gold, accepted for centuries as the strongest shield against global economic shocks, inflationary pressures, and currency devaluations, maintains its strategic significance in today’s modern trading world. Changes in central banks’ reserve policies, interest rate cycles, and fluctuations in the global supply chain create strong and dynamic movement opportunities in the ounce price of this precious metal.
[A futuristic glowing gold bar representing safe-haven assets in modern trading]
For a professional trader, these fluctuations mean significant opportunities to be managed directly based on price expectations, without dealing with additional costs of physical buying and selling processes, storage risks, and high spreads.
Managing Opportunities in Ounce Price with Dual Dynamics
In classic spot asset management, profits depend solely on rising prices, but modern contracts give investors directional freedom. This flexible system allows active participation not only during upward trends but also during sharp pullbacks and correction phases of the precious metal.
Bullish Expectation (Long Position): During periods of escalating geopolitical risks or discussions of interest rate cuts, buy positions are preferred to evaluate the upward momentum in the ounce price.
Bearish Expectation (Short Position): In scenarios where strong employment data, rising bond yields, or continued tight monetary policies suppress the ounce price, profits can be generated through short-selling strategies or existing physical portfolios can be hedged for protection.
Leverage Amplifier and Risk Discipline in Precious Metal Transactions
The precious metals market is one of the areas with the highest liquidity and the most stable response to technical analysis data. Thanks to the leverage system offered by forward contracts, even small percentage changes in the ounce price enable maximum capital efficiency and high-volume trading.
However, the high volatility (fluctuations) that gold exhibits periodically requires this power to be managed with strict discipline. A successful portfolio manager closely follows the macroeconomic calendar, avoiding emotional analysis. They determine support and resistance levels in light of global inflation rates, unemployment data, and statements from central bank governors. By placing stop-loss orders with millimeter precision, they safeguard capital.
Strategic Diversification and Enhancing the Portfolio with Precious Rewards
The secret to lasting success in modern finance is not putting all eggs in one basket. While trading global stock indices, technology shares, or energy commodities, always allocating a portion of the portfolio to proven, reliable precious metals optimizes risk.
Investors who use data-driven analysis methods, proceed with patience and discipline, and interpret the dynamic cycles of the markets correctly, achieve the comfort of managing their financial decisions with maximum efficiency. Operations conducted in accordance with risk management principles are the most professional way to capture liquidity in global markets and reap financial success rewards.
  • Reward
  • Comment
  • 1
  • Share
How to quickly participate in real-time hot event markets?
Gate Prediction Markets now support "Live Live," allowing real-time viewing of sports, eSports, and crypto event market changes.
You can quickly enter series event markets from a single match, watching the event while participating in prediction trades.
👉 Experience now:
https://gate.onelink.me/Hls0/prediction?page=home
M谋ngYueZen
How to quickly participate in real-time hot event markets?
Gate Prediction Markets now support "Live Live," allowing real-time viewing of sports, eSports, and crypto event market changes.
You can quickly enter series event markets from a single match, watching the event while participating in prediction trades.
👉 Experience now:
https://gate.onelink.me/Hls0/prediction?page=home
  • Reward
  • Comment
  • 1
  • Share
#TradFi交易分享挑战
#UPS
$UPS ‌United Parcel Service Inc (UPS) Tech Review
Date: May 28, 2026
Current Price: 104.32 (+2.45 | +2.40%)
Time Frame: 1-Hour Chart | Market Closed (∼16 hours 5 minutes to Open)
Overall Market View
United Parcel Service (UPS), a top global firm in freight and delivery, put up a solid move today. A buy wave that began at 102.11 pushed the share to a 104.73 high, and it closed firm at 104.32. Backed by firm need in the freight field, growth in e-trade volume, and better work flow, UPS now ranks among the key firms in the trade and move space that show a bounce of
UPS0.15%
SinCity
#TradFi交易分享挑战
#UPS
$UPS ‌United Parcel Service Inc (UPS) Tech Review
Date: May 28, 2026
Current Price: 104.32 (+2.45 | +2.40%)
Time Frame: 1-Hour Chart | Market Closed (∼16 hours 5 minutes to Open)
Overall Market View
United Parcel Service (UPS), a top global firm in freight and delivery, put up a solid move today. A buy wave that began at 102.11 pushed the share to a 104.73 high, and it closed firm at 104.32. Backed by firm need in the freight field, growth in e-trade volume, and better work flow, UPS now ranks among the key firms in the trade and move space that show a bounce of late.
Tech Review: Hold and Push Zones
Key Push Levels:
104.73 – 105.82 (Short-Run Key Push): Today’s high zone. A break above here could open the path to the 107.00 – 108.00 area.
108.00+: Mid-run major push band.
Key Hold Levels:
103.25 – 104.07 (Firm Hold): MA10 (103.25) and MA5 (104.07) cross area. Guard of this zone is key for the short-run trend to hold.
100.85 (MA30): Mid-run main trend hold.
93.76: Major mind-level hold if a deeper drop comes.
Moving Average View:
Price runs firm above MA5 (104.07) and MA10 (103.25).
MA5 > MA10 > MA30 (100.85) order proves a clear up trend. This line-up shows the bull build is sound and able to last in a tech sense.
MACD Read:
MACD (12,26,9) is at +0.14 in gain ground and holds up drive. DIF (1.43) > DEA (1.29) plus cross, with green bars in the histogram, shows buy push is slowly getting firm. This points to a chance for new up moves in the short run.
Trader Mood and Market Flow
The chart shows a clear “Fear at Low → Firm Bounce” loop:
93.76 low level: Made many traders fear “the drop will go on” and led to panic sells and weak hands being cleared.
93.76 → 104.73 rise: Firm bounce zone where smart money and big funds came in. The solid move up proves buy desire in the market is still alive.
Light pullback from 104.73 high: Usual move from short-run traders who take gains and those who think “the rise was too fast.”
Mind Tips for Gate Trade Users:
Do not fall into FOMO on fast rises; build spots step by step.
At the 103.25 – 104.07 hold zone, look for a buy chance, not panic sells.
Swings are at a mid-to-high level; rule-based risk control and calm are key.
Gate Trade Plans (Short and Mid Run)
Bull Case (Odds: 68%):
Hold above 104.32 and break of the 104.73 push.
Aim: 104.73 → 105.82 → 108.00+
Stop-Loss: Move under 103.00.
Bear Case (Odds: 32%):
Break of 103.25 hold and close under MA10.
Aim: 100.85 (MA30) → 98.00 → 95.00
In this case, cut size or hedge is wise.
Tip:
We sit in a mid-firm bull tilt now. For those who plan new longs at 104.32, a trade with a 103.00 stop-loss looks fair and good for risk/reward. For scalpers, chances exist in the 103.25 – 104.73 range.
End Note
United Parcel Service (UPS) draws eyes with its firm spot in the freight field and clear bounce signs. Today’s 2.40% rise and place above key moving averages back buyer control and a chance for the trend to go on. A firm break of the 104.73 push could be the sign of a new up wave.
  • Reward
  • Comment
  • Repost
  • Share
❤️ Redefining Live Interaction | GateLive Multi-Guest Feature Is Now Live!
• Flexible guest slot management: Invite up to 10 guests on stream simultaneously
• Built for multiple scenarios: Perfect for AMAs, roundtables, daily interactions, and more
• Stronger audience engagement: Real-time interaction makes every stream more lively
👉 Try the new multi-guest streaming experience now: https://www.gate.com/help/community-center/live/51369
💬 More product suggestions are always welcome in the comments!
GateLive
❤️ Redefining Live Interaction | GateLive Multi-Guest Feature Is Now Live!
• Flexible guest slot management: Invite up to 10 guests on stream simultaneously
• Built for multiple scenarios: Perfect for AMAs, roundtables, daily interactions, and more
• Stronger audience engagement: Real-time interaction makes every stream more lively
👉 Try the new multi-guest streaming experience now: https://www.gate.com/help/community-center/live/51369
💬 More product suggestions are always welcome in the comments!
repost-content-media
  • Reward
  • Comment
  • Repost
  • Share
🏎️ 2026 Red Bull Trading Tour Fourth Phase Registration Opens!
60,000 GT waiting for you to grab, the champion wins F1 tickets
New users who register and share the event can earn up to 50 USDT rewards
VIP members enjoy exclusive mileage benefits
Register now to participate: https://www.gate.com/competition/f1rb/s9
Event details: https://www.gate.com/announcements/article/51381
GT2.86%
CryptoChampion
🏎️ 2026 Red Bull Trading Tour Fourth Phase Registration Opens!
60,000 GT waiting for you to grab, the champion wins F1 tickets
New users who register and share the event can earn up to 50 USDT rewards
VIP members enjoy exclusive mileage benefits
Register now to participate: https://www.gate.com/competition/f1rb/s9
Event details: https://www.gate.com/announcements/article/51381
repost-content-media
  • Reward
  • Comment
  • 1
  • Share
Signal Evolved? 🤔
The cleanest liquidity signal in crypto just transformed beyond recognition. #Stablecoin supply growth used to spell dry powder piling up, waiting to rotate into #BTC and alts. That formula is history — and many traders, myself included, learned to read it religiously.
🔹 The old rule was beautifully simple. More $USDT or $USDC printed meant fresh fiat entered the system, parked as inventory, and sooner or later flowed into majors and high-beta assets. It worked because stablecoins mostly lived between trades.
🔹 That world has expanded. Stablecoin market cap now touches $32
BTC-0.56%
User_any
Signal Evolved? 🤔
The cleanest liquidity signal in crypto just transformed beyond recognition. #Stablecoin supply growth used to spell dry powder piling up, waiting to rotate into #BTC and alts. That formula is history — and many traders, myself included, learned to read it religiously.
🔹 The old rule was beautifully simple. More $USDT or $USDC printed meant fresh fiat entered the system, parked as inventory, and sooner or later flowed into majors and high-beta assets. It worked because stablecoins mostly lived between trades.
🔹 That world has expanded. Stablecoin market cap now touches $322 billion, and velocity has doubled since early 2024. The same dollars turn over faster — moving through remittances, cross-border settlement, #DeFi collateral, merchant rails, and institutional plumbing. They are no longer just idle powder.
🔹 Supply growth now reflects real economic activity alongside speculative positioning. A spike in issuance could mean a payroll processor settling invoices, a treasury manager moving capital on-chain, or a lending protocol absorbing liquidity — not necessarily a wall of money waiting to pump altcoins.
🔹 This shift makes the old signal noisier. The supply chart still matters deeply, but it now tells a much bigger story than deployable trading capital alone. Stablecoins became infrastructure, and the simple "supply up equals bullish" reading needs a second layer of context.
The printing press still hums, but the ink now flows through payment rails and settlement layers, not just into spot order books. What signals are you tracking to gauge true deployable liquidity in this new infrastructure age?
🕉️
repost-content-media
  • Reward
  • Comment
  • Repost
  • Share
Record Streak, Frozen Homes?
The world's most powerful central bank just lost a 62-month staring contest with its own target — and the housing market next door is quietly rewriting the affordability playbook while nobody was watching. These two forces are pulling on every risk asset from equities to crypto, and the connection is tighter than most traders realize.
🔹 #PCE inflation has burned above the Federal Reserve's 2% line since April 2021 — 62 consecutive months and counting, the longest overshoot since the target was formally adopted in 2012. Headline PCE clocked 3.5% year-over-year in M
SPX-2.28%
User_any
Record Streak, Frozen Homes?
The world's most powerful central bank just lost a 62-month staring contest with its own target — and the housing market next door is quietly rewriting the affordability playbook while nobody was watching. These two forces are pulling on every risk asset from equities to crypto, and the connection is tighter than most traders realize.
🔹 #PCE inflation has burned above the Federal Reserve's 2% line since April 2021 — 62 consecutive months and counting, the longest overshoot since the target was formally adopted in 2012. Headline PCE clocked 3.5% year-over-year in March, while core PCE held at 3.2%. The Cleveland Fed's Nowcasting model projects April PCE accelerating to roughly 3.83%, with May potentially hitting 4.06% — a trajectory that has former New York Fed President Bill Dudley openly warning the central bank risks losing all credibility as an inflation fighter. Consumers feel it with every transaction: #CPI surged to 3.8% in April, the hottest print since 2023.
🔹 The bond market absorbed this message with discipline. Wall Street's largest desks — Morgan Stanley, Goldman Sachs, and Bank of America — have collectively pushed rate cut expectations into 2027. The era of waiting for the pivot is officially over. Higher-for-longer has transitioned from a cautionary phrase into the structural backdrop for every portfolio allocation decision. For risk assets, this means liquidity stays expensive and the hurdle rate for speculative capital remains elevated.
🔹 Housing inventory has cycled from crisis to cautious recovery. Total existing home inventory reached 1.47 million units in April, translating to 4.3 months of supply — up from 4.2 a year ago. Single-family inventory rose 2.4% year-over-year, a dramatic shift from the deeply negative readings that defined 2022's peak shortage. Months of supply now sits at 5.10 in the single-family segment, bordering on buyer-friendly territory for the first time in years. The market has not tipped into excess — 4.4 months remains well below the 8+ months that triggered the 2008 correction — but the direction of travel is unmistakable.
🔹 Homebuilder stocks are absorbing this shift with surprising resilience. The SPDR S&P Homebuilders #ETF surged over 11% early in the year while the S&P 500 was barely positive, reflecting a contrarian bet that normalizing inventory supports transaction volumes even as mortgage rates hover near 6.4%. Builder sentiment, as measured by the NAHB index, rose three points in May to 37. Builders are deploying incentives aggressively — 61% offered sales sweeteners including mortgage-rate buydowns — and their ability to subsidize financing gives them a structural edge over existing homeowners locked into sub-3% mortgages. The lock-in effect continues suppressing resale inventory, which is exactly what keeps builders in the game.
🔹 The macro through-line is a slow-burning pressure cooker. Persistent inflation above target forces the Fed to keep rates elevated, which sustains mortgage costs above 6%, which locks homeowners in place, which constrains resale supply, which props up prices, which keeps shelter costs — the single largest component of the CPI basket — elevated, which feeds right back into inflation. The housing market is no longer a bystander in the inflation story; it is a transmission mechanism.
The Fed is chasing a target it has not touched in five years, and the housing market is frozen precisely because rates cannot come down until that target is met. A contradiction wrapped in a stalemate — and every asset class is positioned somewhere inside that tension. How are you navigating the persistence of sticky inflation and a housing market that refuses to break either higher or lower?
repost-content-media
  • Reward
  • Comment
  • Repost
  • Share
Fund Giants Tokenize Reality
A $7 billion yield fund just landed on-chain, and it carries the same credit rating as a government bond. Fidelity International launched its first tokenized product — the Fidelity USD Digital Liquidity Fund — plugging directly into Chainlink infrastructure and opening round-the-clock access to institutional-grade liquidity for the first time.
🔹 FILQ debuted on May 6 through Sygnum Bank's Desygnate tokenization platform, with Chainlink delivering real-time net asset value and distribution data on-chain. Moody's awarded the fund its top AAA-mf assessment, signaling
LINK-2.47%
ETH-1.29%
BTC-0.56%
GT2.86%
User_any
Fund Giants Tokenize Reality
A $7 billion yield fund just landed on-chain, and it carries the same credit rating as a government bond. Fidelity International launched its first tokenized product — the Fidelity USD Digital Liquidity Fund — plugging directly into Chainlink infrastructure and opening round-the-clock access to institutional-grade liquidity for the first time.
🔹 FILQ debuted on May 6 through Sygnum Bank's Desygnate tokenization platform, with Chainlink delivering real-time net asset value and distribution data on-chain. Moody's awarded the fund its top AAA-mf assessment, signaling the highest level of credit quality, liquidity, and capital preservation. JPMorgan provides approved daily NAV data, while Apex Group handles transfer agency services — a full institutional stack operating on Ethereum rails.
🔹 The underlying strategy mirrors Fidelity International's existing Irish-domiciled low-volatility NAV fund, which holds nearly $7 billion in assets under management. FILQ provides exposure to highly rated government securities while keeping the fund usable across on-chain workflows. Stablecoin subscriptions and redemptions enable 24/7 settlement, bypassing traditional market-hour constraints.
🔹 Tokenized real-world assets have surged to a record $33.78 billion in May 2026, more than tripling since early 2025. Tokenized U.S. Treasury products alone now exceed $15 billion, up from just $1 billion two years ago. Fidelity, DTCC, and Vayana have all expanded to Chainlink infrastructure this month, signaling that institutional adoption is accelerating at the infrastructure layer.
🔹 "There is no tokenized finance without tokenized liquidity. Once markets settle in real time, cash must settle in real time too," stated Emma Pecenicic, head of digital assets distribution at Fidelity International. Chainlink Labs' president of capital markets Fernando Vazquez emphasized that the integration delivers "tamper-proof transparency required to securely bridge traditional finance with the on-chain economy".
A $7 billion fund, a AAA-mf rating, and round-the-clock settlement — Fidelity is building the on-ramp that institutional capital has been waiting for. How are you reading this: the moment traditional finance fully embraces on-chain rails, or just another step in a much longer migration?
$BTC $GT
$LINK
repost-content-media
  • Reward
  • Comment
  • Repost
  • Share
$2 Trillion Signal?
Corporate America just went on a borrowing spree unlike anything credit markets have ever seen — and nearly one in every five dollars raised is chasing artificial intelligence. This wave of debt is reshaping the relationship between stocks and bonds at a structural level, and crypto markets are absorbing the shockwaves in ways that only sharp-eyed traders are fully tracking.
🔹 US investment-grade bond issuance has surged to $794 billion year-to-date, putting the market on pace to smash through $2 trillion for the full year for the first time in history. SIFMA data confirms
BTC-0.56%
User_any
$2 Trillion Signal?
Corporate America just went on a borrowing spree unlike anything credit markets have ever seen — and nearly one in every five dollars raised is chasing artificial intelligence. This wave of debt is reshaping the relationship between stocks and bonds at a structural level, and crypto markets are absorbing the shockwaves in ways that only sharp-eyed traders are fully tracking.
🔹 US investment-grade bond issuance has surged to $794 billion year-to-date, putting the market on pace to smash through $2 trillion for the full year for the first time in history. SIFMA data confirms issuance reached $1.01 trillion through April alone, up 28.2% from the same period in 2025. Morgan Stanley strategists describe this as the largest capital-spending cycle in a generation. Not a trickle — a flood that is rewriting the liquidity playbook across every asset class.
🔹 The technology sector now accounts for an unprecedented 18% to 20% share of all investment-grade issuance — roughly one-fifth of the entire market. UBS raised its 2026 tech issuance forecast to $360 billion, while AI-related debt financing across public and private markets is projected to approach $500 billion this year. The five major hyperscalers are expected to spend over $690 billion in combined capex during 2026, with Morgan Stanley now forecasting nearly $800 billion.
🔹 AI-related debt has overtaken the banking sector to become the single largest segment of the investment-grade market, reaching a staggering $1.2 trillion in total issuance. JPMorgan estimates 14% of the entire US investment-grade debt market is already tied to AI. Alphabet's century-bond issued in February 2026 opened a new chapter in ultra-long-term tech financing, signaling that major firms are betting big on multi-decade growth horizons — and funding those bets with debt markets rather than equity.
🔹 The stock-bond correlation has collapsed to its most negative level since 1999. Goldman Sachs reports the 2-month rolling correlation between the S&P 500 and the 10-year Treasury yield has fallen to levels unseen since the late 1990s. Charles Schwab data confirms the 30-day rolling correlation has slipped into negative territory, meaning yields rise while equities face pressure — a reversal of the growth-driven positive correlation that dominated much of the past decade. BCA Research warns that stocks and bonds "are on a collision course," with only a significant equity market sell-off capable of driving bond yields lower.
🔹 Rising real yields are pulling capital away from risk assets globally. StoneX analysis confirms US 10-year real yields have returned to levels historically associated with "heightened volatility, weaker risk appetite and sizable drawdowns". Higher Treasury yields are acting like "a sponge, soaking up capital from other parts of the world and from other asset classes". The dollar-yield correlation has also surged, strengthening the greenback and creating additional headwinds for risk-sensitive markets.
🔹 The crypto connection operates through two channels. On one side, massive AI infrastructure spending — funded by debt — has fueled explosive growth in AI-related tokens and GPU compute protocols, with Render and similar projects rallying sharply alongside the AI capex wave. The correlation between tech equities and crypto has run hot, with Alphabet's century-bond announcement coinciding with a 7% BTC surge. On the other side, the stock-bond correlation breakdown signals a regime where inflation-driven yield spikes can trigger simultaneous equity and crypto selloffs — a risk that 40% of global fund managers now rank as their top concern, with 18% specifically worried about disorderly bond yield spikes. Meanwhile, 34% of those same managers see AI-related capital spending as the most likely source of a future systemic credit event, a share that doubled from April.
🔹 The financial stability backdrop is shifting fast. Hyperscaler capex now absorbs 94% of operating cash flow versus just 40% in 2023. Free cash flow is turning negative across the group, forcing heavier reliance on debt markets. Future lease commitments total $822 billion and have yet to be fully recognized on balance sheets. History offers a cautionary parallel: the late-1990s telecom infrastructure boom was transformational technology funded by record debt issuance — and the aftermath was brutal for overleveraged players.
Nearly $2 trillion in corporate bonds, one-fifth flowing straight into AI infrastructure, and the traditional stock-bond hedge unraveling at its fastest pace in 25 years. Capital is not disappearing — it is being repriced, reallocated, and redirected into a credit super-cycle that touches every corner of the market from equities to crypto. How are you reading this moment: a secular AI productivity boom that justifies the debt load, or a credit bubble building quietly beneath the surface?
#StockTradingChallengeUpTo17000U #GatePredictionMarketAddsSmartMoneyTracking #InstitutionalCapitalRotatesFromBTCToHYPEAndXRP #TradeCFDWinGold #DailyPolymarketHotspot
repost-content-media
  • Reward
  • Comment
  • Repost
  • Share
  • Pinned