discovery

vip
Market Analyst
Hello friends I'm new .
🚀 VIP Newcomer Promotion, Episode 5, is now officially live!
A newly upgraded VIP 5+ unlocks multiple rewards:
1️⃣ Newcomer package + contract trading experience bonus
2️⃣ Challenge your trading volume and win a World Cup gift box
3️⃣ Contract/TradFi/spot trading, win the highest 3,000 USDT airdrop
4️⃣ Returning old friends get up to 1,888 USDT rewards too!
Event period: 2026.06.26 14:00 – 2026.07.25 23:59 (UTC+8)
Register now: https://www.gate.com/zh/campaigns/5312
GateSquare
🚀 VIP Newcomer Promotion, Episode 5, is now officially live!
A newly upgraded VIP 5+ unlocks multiple rewards:
1️⃣ Newcomer package + contract trading experience bonus
2️⃣ Challenge your trading volume and win a World Cup gift box
3️⃣ Contract/TradFi/spot trading, win the highest 3,000 USDT airdrop
4️⃣ Returning old friends get up to 1,888 USDT rewards too!
Event period: 2026.06.26 14:00 – 2026.07.25 23:59 (UTC+8)
Register now: https://www.gate.com/zh/campaigns/5312
repost-content-media
  • Reward
  • 3
  • 1
  • Share
ShainingMoon:
To The Moon 🌕
View More
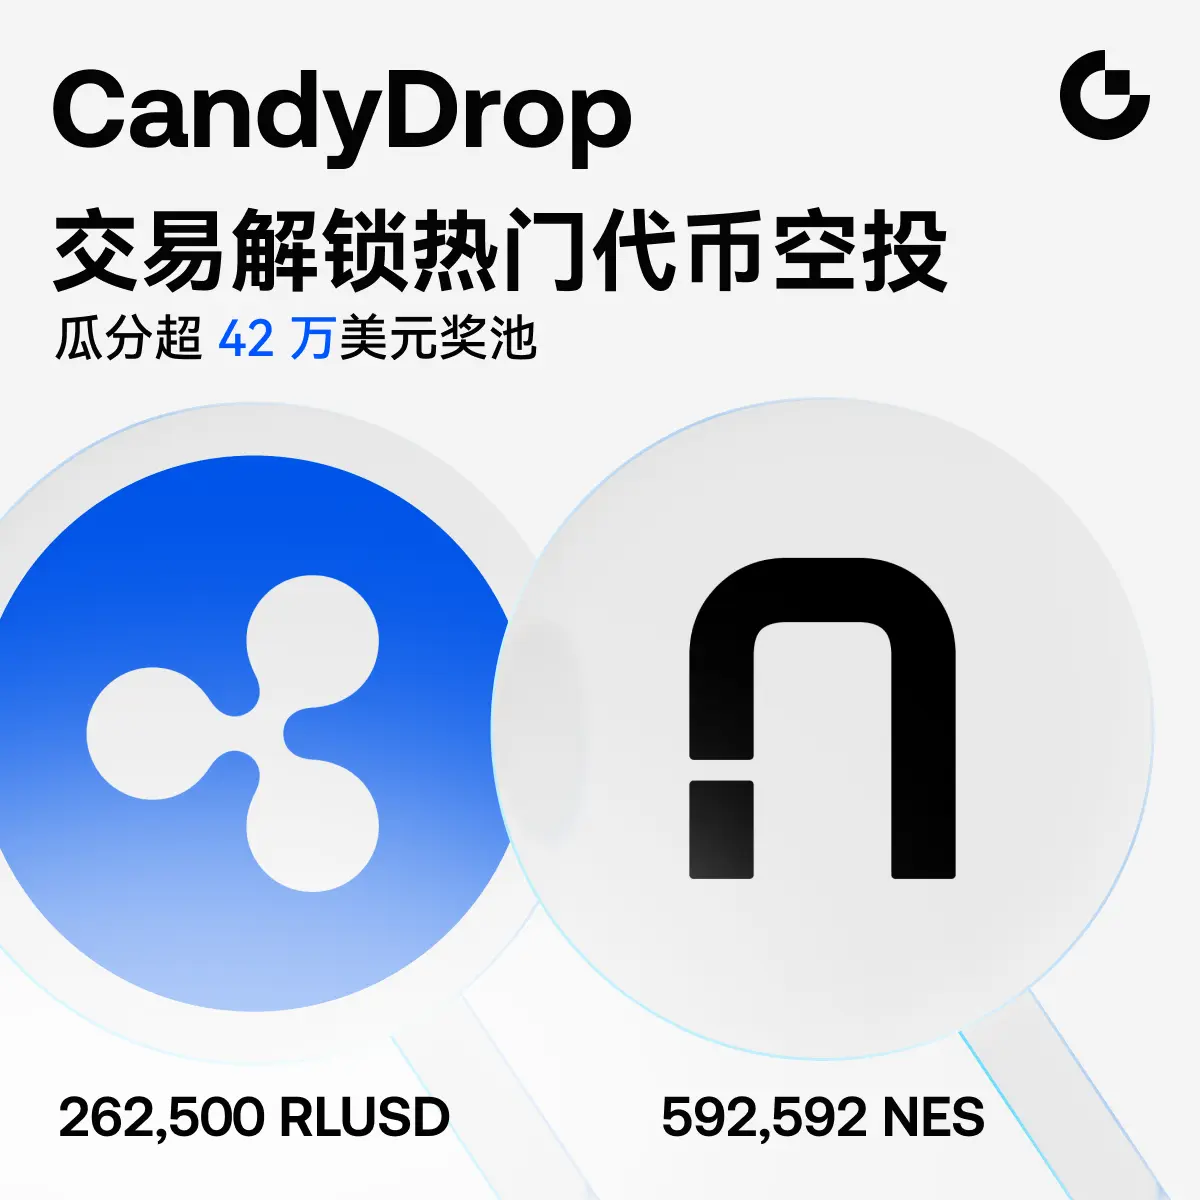
#CandyDrop Double benefits—the total prize pool is over $420,000 and it’s yours to share! 🍬
🔹 $RLUSD Special event:
Total prize pool: 262,500 $RLUSD
Maximum you can get: 205 $RLUSD (≈ 205 $USDT)
Task types: first spot trading, spot trading, deposits, invitations
🔹 $NES Special event:
Total prize pool: 592,592 $NES
Maximum you can get: 800 $NES (≈ 215 $USDT)
Task types: first futures trading, futures trading, deposits, invitations
Participate in $RLUSD CandyDrop: https://www.gate.com/candy-drop/detail/RLUSD-347
Participate in $NES CandyDrop: https://www.gate.com/candy-drop/detail/NES-348
RLUSD0.01%
NES-1.69%
GateSquare
#CandyDrop Double benefits—the total prize pool is over $420,000 and it’s yours to share! 🍬
🔹 $RLUSD Special event:
Total prize pool: 262,500 $RLUSD
Maximum you can get: 205 $RLUSD (≈ 205 $USDT)
Task types: first spot trading, spot trading, deposits, invitations
🔹 $NES Special event:
Total prize pool: 592,592 $NES
Maximum you can get: 800 $NES (≈ 215 $USDT)
Task types: first futures trading, futures trading, deposits, invitations
Participate in $RLUSD CandyDrop: https://www.gate.com/candy-drop/detail/RLUSD-347
Participate in $NES CandyDrop: https://www.gate.com/candy-drop/detail/NES-348
repost-content-media
  • Reward
  • 3
  • Repost
  • Share
ShainingMoon:
To The Moon 🌕
View More
$MAGMA
$MAGMA is getting attention again. Here’s what traders are watching 👇
*Quick Overview:*
*MAGMA/USDT* - Pair to watch for altcoin volatility and momentum plays.
*What to track:*
1. *Volume*: Spike in USDT pair volume = interest returning
2. *Key Levels*: Break above recent resistance could trigger more upside
3. *BTC Correlation*: Altcoins like MAGMA often move after BTC stabilizes
4. *Community*: Project updates and listings drive short-term price action
*Risk reminder:*
Low-cap tokens are high risk, high volatility. Do your own research. Manage risk and never trade with money you can
MAGMA-11.38%
BTC-1.57%
FenerliBaba
$MAGMA
$MAGMA is getting attention again. Here’s what traders are watching 👇
*Quick Overview:*
*MAGMA/USDT* - Pair to watch for altcoin volatility and momentum plays.
*What to track:*
1. *Volume*: Spike in USDT pair volume = interest returning
2. *Key Levels*: Break above recent resistance could trigger more upside
3. *BTC Correlation*: Altcoins like MAGMA often move after BTC stabilizes
4. *Community*: Project updates and listings drive short-term price action
*Risk reminder:*
Low-cap tokens are high risk, high volatility. Do your own research. Manage risk and never trade with money you can’t afford to lose.
*Your turn:*
Are you bullish or bearish on MAGMA/USDT right now?
Comment your target
*#MagmaUsdt #MAGMA #Crypto #Altcoins
repost-content-media
  • Reward
  • Comment
  • Repost
  • Share
ETF Inflows Roar Back as Spot Ether Funds Pull $1.8 Billion in Six Sessions
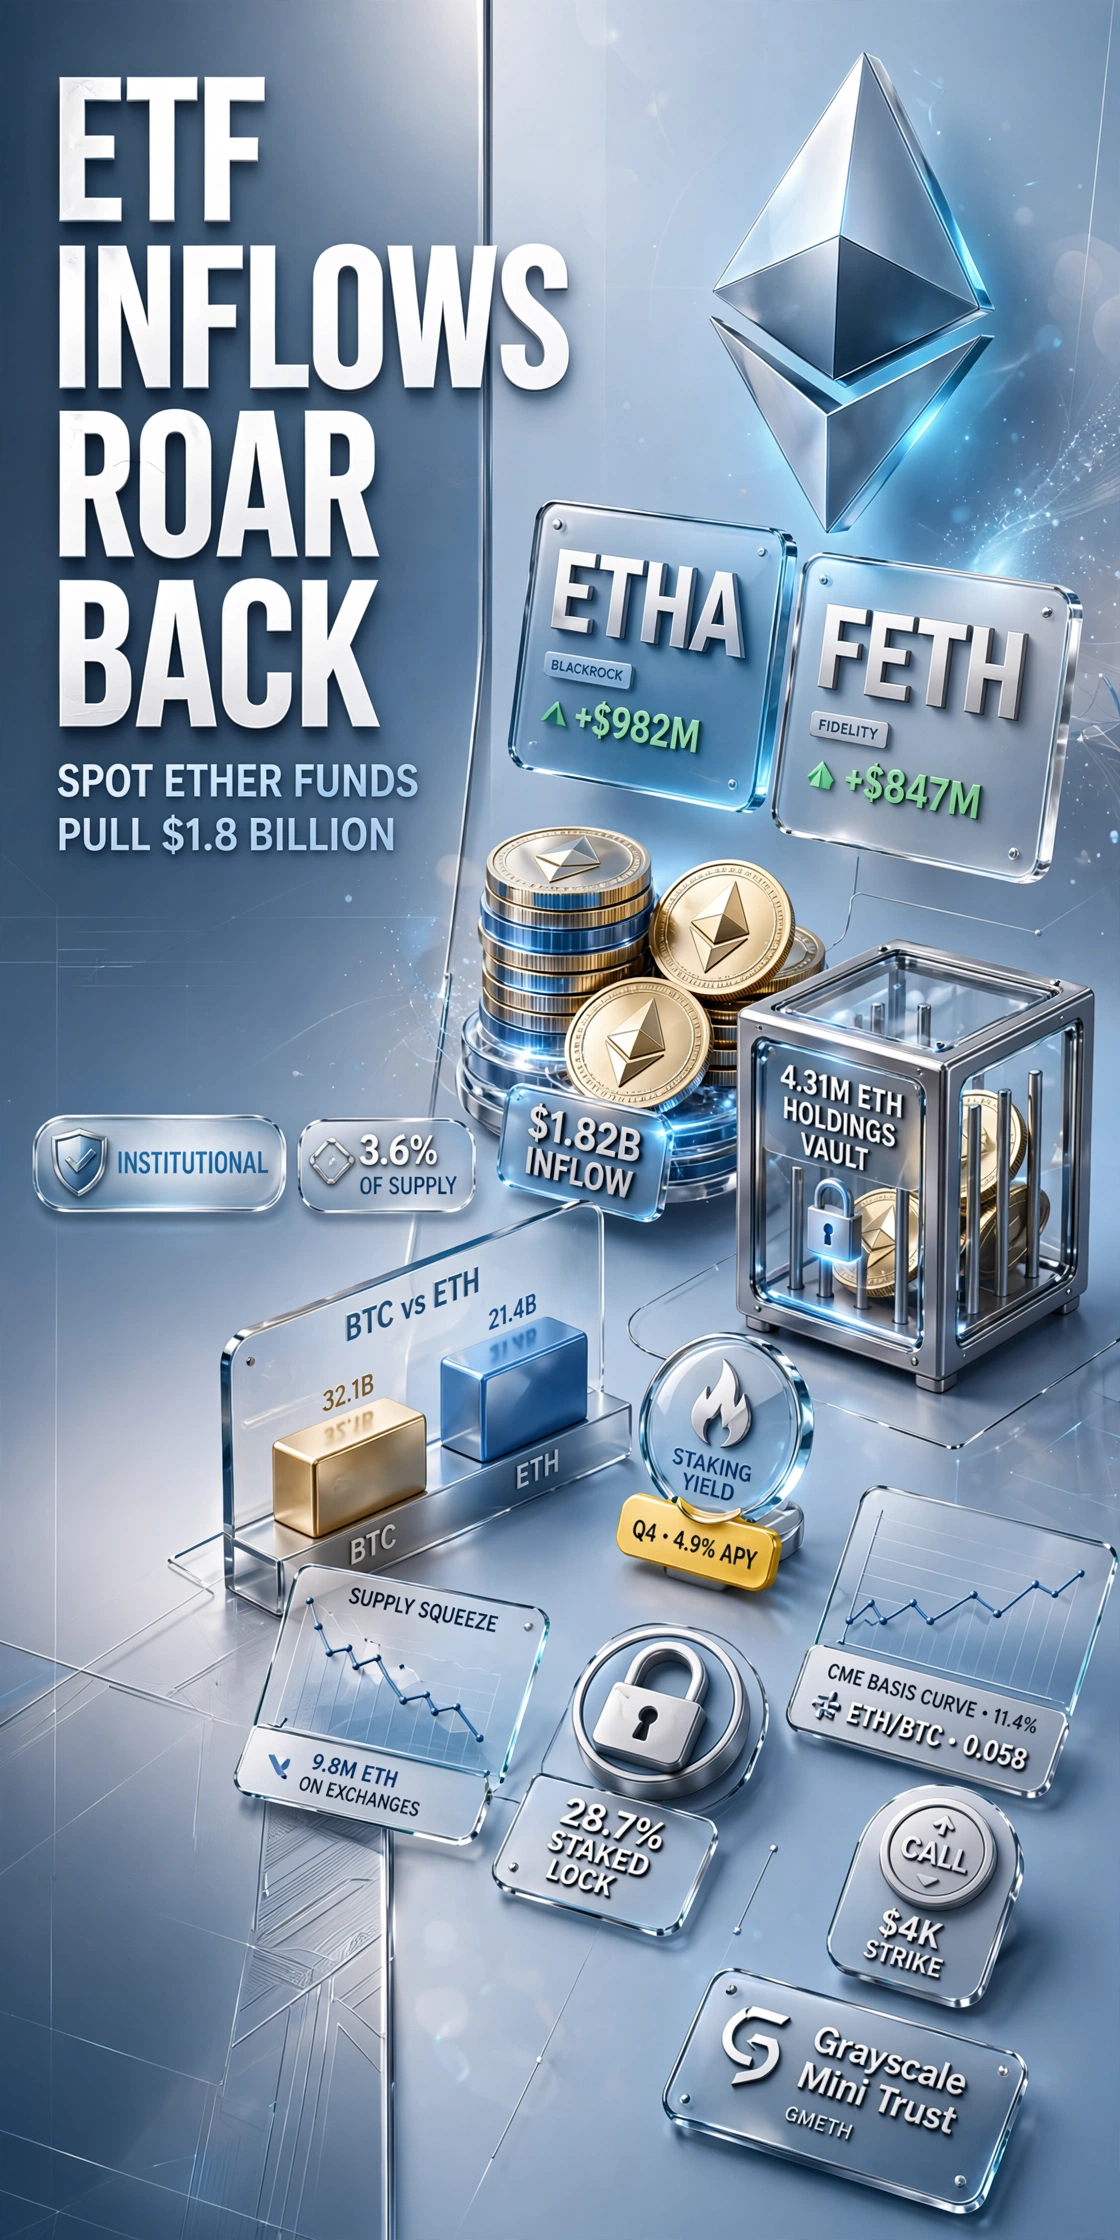
The bid came back with size. From July 6 to July 11, 2026, U.S. spot Ether ETFs recorded $1.82 billion in net inflows, the strongest weekly print since January. The move erased three weeks of outflows and pushed combined ETH ETF holdings to 4.31 million ETH, roughly 3.6% of circulating supply. BTC ETFs added $620 million over the same stretch, but the story this week was ETH beta.
What drove the flow
Two catalysts aligned. First, a major custodian confirmed it will support ETH staking inside ETF trusts by Q4, pending
ETH-2.62%
BTC-1.06%
Venüs_
ETF Inflows Roar Back as Spot Ether Funds Pull $1.8 Billion in Six Sessions
The bid came back with size. From July 6 to July 11, 2026, U.S. spot Ether ETFs recorded $1.82 billion in net inflows, the strongest weekly print since January. The move erased three weeks of outflows and pushed combined ETH ETF holdings to 4.31 million ETH, roughly 3.6% of circulating supply. BTC ETFs added $620 million over the same stretch, but the story this week was ETH beta.
What drove the flow
Two catalysts aligned. First, a major custodian confirmed it will support ETH staking inside ETF trusts by Q4, pending final sign-off. The S-1 amendments hit late June, but compliance teams cleared the language this week. Second, on-chain data showed a supply squeeze: ETH on trading venues fell to 9.8 million, a 14-month low, while 28.7% of supply sits staked and illiquid. When ETF creations hit, authorized participants had to pull from thin books.
Favorite examples from the tape
1. BlackRock’s ETHA: Took in $742 million on July 9 alone, the second-largest single-day ETH ETF flow on record. The fund now holds 1.64 million ETH. Its premium to NAV stayed at 2 bps, showing smooth create-redeem mechanics. 2. Fidelity’s FETH: Added $408 million this week. The issuer’s crypto desk said 63% of the flow came from RIAs rebalancing model portfolios, not hedge funds. That suggests stickier capital. 3. Grayscale Mini Trust: Saw $116 million in inflows despite a 0.15% fee. The discount to NAV closed from -0.8% to -0.1%, implying arb desks covered shorts as redemption risk fell. 4. CME Basis: ETH futures basis on the regulated venue widened from 6.2% to 11.4% annualized. The jump signaled real spot demand, because ETF APs hedge creations by buying futures, lifting the curve.
Market structure impact
ETH/BTC broke 0.058 after stalling near 0.052 for a month. Options flow confirmed the move: $75k notional in ETH September 4k calls traded on July 10, the largest block since March. Perp funding on major venues flipped positive to 0.012% per 8h, but spot led, not leverage. On-chain, staked ETH queue jumped to 8 days as new validators entered, likely institutions prepping for ETF staking.
Risk and the road ahead
If staking inside ETFs gets delayed, part of this bid unwinds. Also, macro matters: a hot CPI on July 15 could hit duration assets and ETH with it. But flow is flow. When $1.8 billion enters in six sessions, it forces market makers to buy, slippage drops, and reflexive buyers appear. The key level is ETH’s March high at $4,090. A daily close above it with volume turns this inflow into a trend.
For allocators, the takeaway is simple. ETH now has a functioning ETF wrapper, a path to staking yield, and shrinking liquid supply. That trio pulled cash off the sidelines. In crypto, most searched topics this week were “ETH ETF inflows,” “staking ETF,” and “ETH supply.” The tape agreed.
#Ethereum #ETF #Institutional #ETH #Crypto
repost-content-media
  • Reward
  • Comment
  • 1
  • Share
Solana Firedancer Client Hits 1 Million TPS in Testnet as Jump Opens Code
Speed stopped being a slide deck. On July 11, 2026, Jump Crypto pushed the Firedancer validator client to open-source and ran a live testnet demo that cleared 1.02 million transactions per second with 400 ms block times. The run used 20 nodes across three continents, with real token transfers, NFT mints, and orderbook trades, not empty loops. Latency p50 landed at 1.2 seconds for full finality.
Why the demo matters
Firedancer is a full rewrite of Solana’s validator in C, built for parallelism and hardware offload. It r
Venüs_
Solana Firedancer Client Hits 1 Million TPS in Testnet as Jump Opens Code
Speed stopped being a slide deck. On July 11, 2026, Jump Crypto pushed the Firedancer validator client to open-source and ran a live testnet demo that cleared 1.02 million transactions per second with 400 ms block times. The run used 20 nodes across three continents, with real token transfers, NFT mints, and orderbook trades, not empty loops. Latency p50 landed at 1.2 seconds for full finality.
Why the demo matters
Firedancer is a full rewrite of Solana’s validator in C, built for parallelism and hardware offload. It removes the Rust client as a single point of failure and targets data-center grade throughput. The test showed no state bloat and 99.97% vote success, meaning the network can scale without skipping slots. Jump also published benchmarks: signature verify at 12M/s per core, and QUIC traffic handled in user-space, bypassing kernel limits.
Favorite examples builders are already using
1. Pyth Oracle Upgrade: The oracle team migrated feeds to a Firedancer-only cluster. Update latency fell from 600 ms to 180 ms, and it now pushes 1,200 price feeds per slot without backlogs. Perps venues said markouts improved 3 bps on average. 2. Phoenix Orderbook: The CLOB processed 740,000 order actions in one second during the test, with cancels and fills interleaved. A market-making firm quoted spreads at 1 bp on SOL-USDC with $2 million top-of-book, citing deterministic performance. 3. Mad Lads Mint Stress: A game studio simulated a 50,000 NFT drop. All mints cleared in 1.9 seconds, and RPC nodes saw no slowdown. Gas fees stayed at 0.000005 SOL per mint. Compare that to prior drops that spiked compute units and failed 30% of txs. 4. Helium Data Packets: The DePIN network routed 3.1 million IoT packets through Firedancer validators in an hour, paying fees in HNT. Settlement cost: $47 total. The team said it will move 80% of traffic off its L1 by August.
Market and token implications
SOL gained 8.4% on the week as the client news hit, outperforming BTC and ETH. Open interest on SOL perps rose $410 million, with funding staying neutral—spot led. Validators began shifting stake: Jito and Helius announced Firedancer partitions, and 6.2% of stake moved to Firedancer-ready nodes in 48 hours. If mainnet adoption crosses 33% by Q4, the network can activate new fee markets that burn more SOL.
Risks to track
Client diversity helps, but a bug in Firedancer could halt the chain if it holds supermajority. Jump will run a $10 million bug bounty and phased rollout: 5% stake, then 20%, then open. Hardware needs are also higher—64-core CPUs and 256 GB RAM are baseline. Still, the upside is a chain that can run a Nasdaq on-chain without rollups.
Throughput was crypto’s meme. With 1M TPS proven on testnet, it just became a spec sheet.
#Solana #Firedancer #Layer1 #Performance #Blockchain
repost-content-media
  • Reward
  • Comment
  • 1
  • Share
$BTC
Bitcoin underwent a full-blown geopolitical stress test this weekend, and the result presented an interesting picture that actually shows the market is maturing.
Following the third round of US attacks on Iran and Tehran's announcement that it was closing the Strait of Hormuz "until further notice," the bitcoin price experienced sharp but short-lived movements between approximately $61,200 and $64,700 over the past week. On Saturday, the price remained calm around $63,800, with only a 0.3% daily decline and a 2% weekly gain. But from Sunday night to Monday, tensions rose again, with Iran
BTC-1.57%
User_any
$BTC
Bitcoin underwent a full-blown geopolitical stress test this weekend, and the result presented an interesting picture that actually shows the market is maturing.
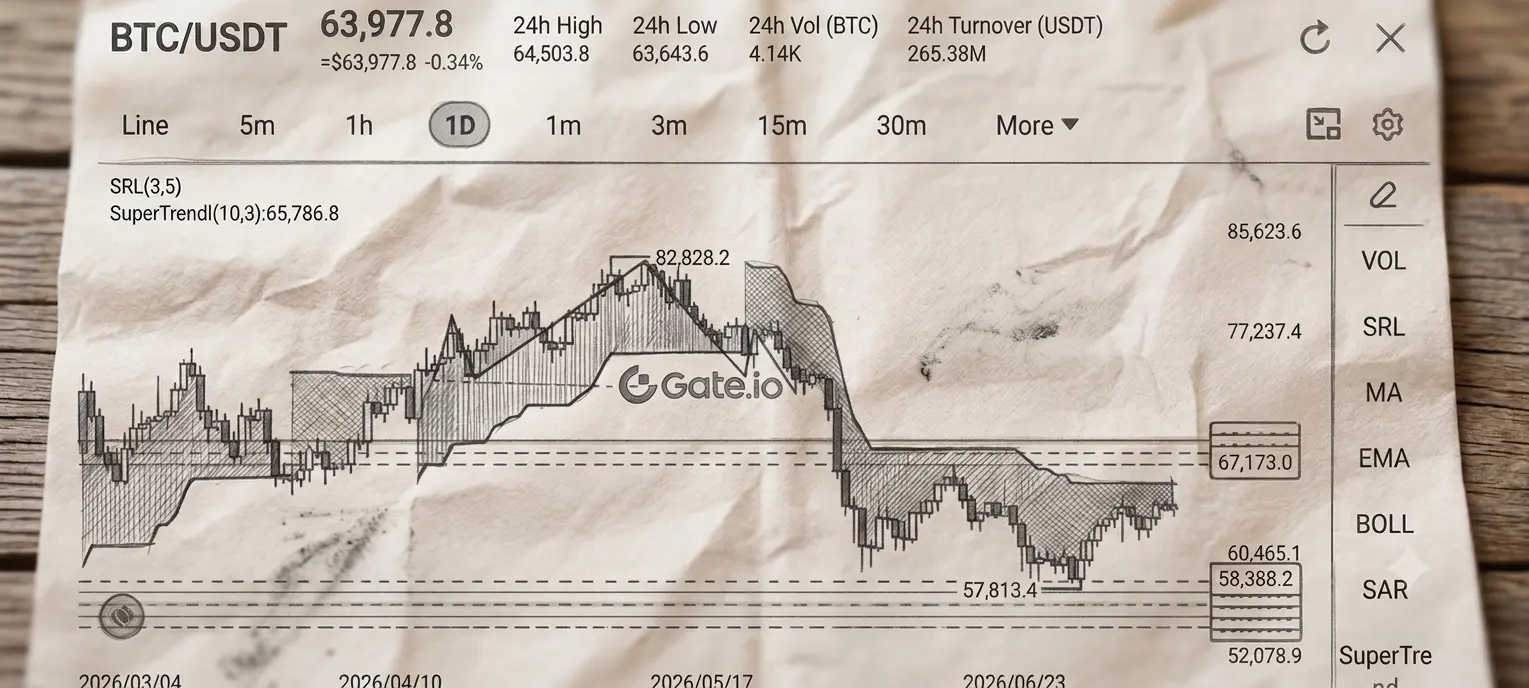
Following the third round of US attacks on Iran and Tehran's announcement that it was closing the Strait of Hormuz "until further notice," the bitcoin price experienced sharp but short-lived movements between approximately $61,200 and $64,700 over the past week. On Saturday, the price remained calm around $63,800, with only a 0.3% daily decline and a 2% weekly gain. But from Sunday night to Monday, tensions rose again, with Iran effectively closing the strait after firing warning shots at a ship using an unauthorized route, pushing bitcoin down to $61,688 and causing the VIX index to rise 4.77% to 16.90.
The main message of the last few days is that geopolitical risk is no longer reflected in every headline, but primarily in the crypto market through oil and inflation expectations. The total crypto market capitalization is currently between $2.2 and $2.28 trillion, with Bitcoin dominance slightly rising to around 58.44%, indicating a slight shift from altcoins towards Bitcoin's relative safety. 24-hour trading volume has significantly decreased compared to previous weeks, suggesting a cautious liquidity stance, while the fear and greed index remains in the fear zone.
The ETF side forms a separate and important channel. After eight weeks of uninterrupted outflows, spot Bitcoin ETFs reached a three-day positive streak last Tuesday, but these inflows remained very modest, only $21.44 million on Tuesday, not strong enough to support the price compared to the outflows of previous weeks. There's also a notable development on the leveraged positions side: liquidations have fallen by over 94% in 24 hours to $6.51 million, indicating that heavily leveraged short positions have been largely cleared.
There are three concrete signals to watch in the coming days. First, while markets were closed over the weekend, oil opened on Monday. Brent closed 5.2% higher on Wednesday at $78.02, even reaching $80 intraday. Whether this level will be maintained or rise further is critical. Second, the course of the conflict, news of new attacks or diplomatic developments, can quickly affect leveraged positions. Third, the US June CPI data on July 14th. If this figure comes in cold, it could pave the way for Bitcoin to move towards the $65,000-$67,000 resistance zone; if it comes in hot, it could revive hawkish Fed fears and push the price back to the $62,000 support zone.
For those following Bitcoin through Gate, the key point is that the current situation is a fragile balance between macroeconomic fears and technical support. The $61,000 to $61,376 range stands out as a critical threshold as it coincides with the 61.8% Fibonacci retracement level. Holding this level makes a recovery towards $63,000 possible, while a break below it could bring about a decline to $59,780. Currently, Bitcoin's movement depends more on how oil prices and interest rate expectations change than on individual headlines, so what's really to watch in the coming days is not the headlines, but how these macroeconomic and market channels react.
#𝐁𝐈𝐓𝐂𝐎𝐈𝐍 #CryptoMarket
DYOR ☑️
repost-content-media
  • Reward
  • Comment
  • 1
  • Share
CLSA Securities Korea data point putting it as high as 73 percent.
The mechanics behind this are worth understanding because they explain why this number got so large so fast. These single-stock leveraged and inverse ETFs, sixteen products tracking twice the daily return of Samsung and SK Hynix, only launched on May 27. Within about a month, assets under management jumped from roughly $3 billion at inception to around $9.1 billion, and 92 percent of holders are individual retail investors, known locally as "ants." Retail traders net purchased about $8.2 billion worth of these products in their
SK Hynix-11.52%
SAMSUNG-5.62%
User_any
CLSA Securities Korea data point putting it as high as 73 percent.
The mechanics behind this are worth understanding because they explain why this number got so large so fast. These single-stock leveraged and inverse ETFs, sixteen products tracking twice the daily return of Samsung and SK Hynix, only launched on May 27. Within about a month, assets under management jumped from roughly $3 billion at inception to around $9.1 billion, and 92 percent of holders are individual retail investors, known locally as "ants." Retail traders net purchased about $8.2 billion worth of these products in their first month alone, representing 63 percent of all retail ETF buying across the entire market during that stretch.
The volatility amplification mechanism is genuinely mechanical and predictable. To maintain a constant 2x leverage ratio, fund managers have to buy more of the underlying stock when it rises and sell more when it falls, every single day at rebalancing. On June 23, when Samsung fell 12.31 percent and SK Hynix fell 12.47 percent in their worst single-day showing since the 2008 financial crisis, sending KOSPI down nearly 10 percent, Bloomberg Intelligence estimated fund managers mechanically sold around $6 billion worth of these two stocks just to rebalance the leveraged products, directly deepening that day's crash. The country's own volatility gauge, VKOSPI, has jumped from an average of 53 before these products launched to nearly 89 now.
There's also a structural quirk unique to the Korean market making this worse, individual stock futures in Korea keep trading until 3:45pm, fifteen minutes after the ETFs and underlying stocks themselves stop at 3:30. That gap has produced strange pricing artifacts, on one occasion SK Hynix's leveraged ETF ended up trading at a 6-7% premium to its own NAV because futures kept moving in the final minutes after the ETF itself had already stopped.
The regulatory response has been notably reactive rather than preventive so far. The Financial Supervisory Service's own governor has publicly expressed regret over what he called rushed approvals, and an opposition lawmaker has called for the products to be delisted entirely, but no concrete remedial measures have been announced yet. Fund performance has been genuinely brutal too, all fourteen of the original single-stock leveraged products are posting average losses of nearly 27 percent since launch, a reminder that leveraged products decay mathematically even in choppy, directionless markets, a stock that drops 10 percent and then rises 10 percent doesn't return to breakeven for a 2x product.
For anyone tracking Korean semiconductor exposure or leveraged product risk more broadly on Gate, the key thing to watch is whether regulators actually move beyond expressing regret into real restrictions, position limits, tighter margin rules, or delisting some products, since as it stands, this concentration means Samsung and SK Hynix's daily price action isn't just reflecting fundamentals anymore, it's being mechanically amplified by the very products built to bet on it, in both directions.
#SKHynixADRIndicativePrice149
DYOR 🔍 NFA ✅
repost-content-media
  • Reward
  • Comment
  • 2
  • Share
⚽ The World Cup Quarterfinals continue!
🇪🇸 Spain 🆚 Belgium 🇧🇪
Can the Spanish side keep their momentum and secure a spot in the semifinals?
Can Belgium break through against a strong opponent and continue their push for the World Cup title?
🎁 Prediction Rewards Continue!
How to participate
1️⃣ Make your prediction for this match in the Gate Prediction Market
2️⃣ Share your prediction screenshot in the Gate World Cup Chat Group
3️⃣ After the match, users who made predictions will enter the lucky draw
🏆 10 users who share prediction screenshots will be selected for this match
🎁 Each
ToTheYUE
⚽ The World Cup Quarterfinals continue!
🇪🇸 Spain 🆚 Belgium 🇧🇪
Can the Spanish side keep their momentum and secure a spot in the semifinals?
Can Belgium break through against a strong opponent and continue their push for the World Cup title?
🎁 Prediction Rewards Continue!
How to participate
1️⃣ Make your prediction for this match in the Gate Prediction Market
2️⃣ Share your prediction screenshot in the Gate World Cup Chat Group
3️⃣ After the match, users who made predictions will enter the lucky draw
🏆 10 users who share prediction screenshots will be selected for this match
🎁 Each winner will receive a 5 USDT Prediction Market Trial Voucher
💬 Join the Gate World Cup Chat Group to watch, chat, predict, and win rewards!
👉 Make your prediction:
https://gate.onelink.me/Hls0/prediction?page=detail&event_ticker=676288&source=cex
📢 Join the Gate World Cup Chat Group:
https://gate.onelink.me/Hls0/group?chatroom=mOLmaY4TpB
  • Reward
  • Comment
  • Repost
  • Share
$EURUSD The euro has gained short-term momentum against the dollar, currently trading between 1.1424 and 1.1442, following a 0.5% weekly gain last week after weak employment data.
The story behind this movement is that both sides are largely balancing each other out. On the dollar side, June's non-farm payrolls data came in at just 57,000, significantly below expectations, and the unemployment rate fell to 4.2%, but this is due to a decline in labor force participation. This data significantly reduced the likelihood of a July rate hike, and the dollar is trading near its lowest level in two we
EURUSD-0.12%
Sand谋3S
$EURUSD The euro has gained short-term momentum against the dollar, currently trading between 1.1424 and 1.1442, following a 0.5% weekly gain last week after weak employment data.
The story behind this movement is that both sides are largely balancing each other out. On the dollar side, June's non-farm payrolls data came in at just 57,000, significantly below expectations, and the unemployment rate fell to 4.2%, but this is due to a decline in labor force participation. This data significantly reduced the likelihood of a July rate hike, and the dollar is trading near its lowest level in two weeks. However, there is a similar softening on the euro side; June inflation fell to 2.8%, below expectations, and core inflation also dropped to 2.4%, leading European Central Bank President Christine Lagarde to present a more balanced outlook at the Sintra forum, making statements that weakened the possibility of a third rate hike.
So, while both central banks are signaling tightening on their side, signs of the limits of this tightening are emerging on both sides, which explains why the pair is stuck in a narrow range. The main determining event this week will be the release of the FOMC meeting minutes. If the minutes show that the Fed maintained its hawkish stance, the dollar could regain strength despite last week's weak employment data, increasing the likelihood of a continued downward trend in the pair. On the European Central Bank side, the next meeting is on July 23rd, and any official statements leading up to that date are also worth watching.
Looking at the given technical levels, a break above 1.1450 could bring 1.1462, 1.1472, and 1.1488 into play, which would be a scenario where the euro's short-term momentum continues. On the downside, a break below 1.1433 could open a series of declines to 1.1426, 1.1418, 1.1407, 1.1394, and 1.1378, signaling a resurgence of dollar strength. In a broader technical context, the 1.1400 level stands out as a critical reference point; a sustained drop below this level could mean the pair enters a much larger downtrend.
For those following dollar-linked assets and the crypto market through Gate, the key point to watch is whether this week's Fed minutes will reinforce the market's expectation of loose monetary policy following last week's weak employment data. This narrow range in the euro-dollar pair reflects a balance where both central banks are on a similar tightening trajectory, but the market is still unsure how long either can sustain it.
DYOR 🔍 NFA ✅
#TradFiCFDGoldMasters
  • Reward
  • 2
  • Repost
  • Share
ThisIsTranslateContent::
Firmly HODL💎
View More
$CL Crude oil continued its consolidation trend at the start of the week, with WTI stuck around $68.60, briefly rising to $69.26 during the day before falling below $69 on Monday. This follows a weak attempt at a recovery that has continued since last Friday, but the strength of the recovery remains limited.
The situation in the Strait of Hormuz remains central to this pricing. According to the latest reports, some tankers were still making unusual route changes on Saturday, while major sea lanes reportedly returned to near-normal levels by Sunday. Saudi Arabia's crude oil exports have recover
CL1.06%
XTIUSD1.58%
XBRUSD0.98%
SaharaDreams
$CL Crude oil continued its consolidation trend at the start of the week, with WTI stuck around $68.60, briefly rising to $69.26 during the day before falling below $69 on Monday. This follows a weak attempt at a recovery that has continued since last Friday, but the strength of the recovery remains limited.
The situation in the Strait of Hormuz remains central to this pricing. According to the latest reports, some tankers were still making unusual route changes on Saturday, while major sea lanes reportedly returned to near-normal levels by Sunday. Saudi Arabia's crude oil exports have recovered to approximately ninety percent of pre-war levels, and the United Arab Emirates has similarly returned to pre-war export levels using the pipeline through the strait. Total daily flow through the strait has exceeded 10 million barrels.
However, supply-side pressure remains quite significant. OPEC+ has approved an additional production increase of 188,000 barrels per day for next month, primarily led by Saudi Arabia and Russia. Iran is also reportedly in talks to resume crude oil sales to Japanese companies under a temporary US sanctions waiver, which is reflected in expectations of additional supply to the market. Saudi Arabia also lowered its main crude oil price for Asia, discounting it to $1.50 per barrel compared to the Oman/Dubai reference, indicating that the supply surplus is also being felt on the pricing side.
However, geopolitical risk has not completely disappeared. Last week, the Iranian Revolutionary Guard warned tankers about unauthorized passage, and the dispute between Iran and the US over the long-term management of the strait and transit fees remains unresolved. Iran defines it as a maritime service fee, while the US argues that it is an international waterway and should not be charged. This unresolved dispute remains a real source of fragility underlying the current calm price environment.
The given resistance and support levels accurately reflect this balanced but tense environment. Short-term resistance starts at 68.90 and extends to 69.25, 69.95, 70.20, and 70.80, while support starts at 68.35 and extends to 68.00, 67.70, 67.40, and 67.00. The technical outlook remains weak at the moment; WTI is trading below its short-term moving averages, and the $70 level stands out as a critical ceiling. Some analysts suggest that if prices remain below this level, they could fall to $60, while a decisive breakout above $70 could reverse the outlook upwards.
For those following energy-related assets via the Gate, the key point to watch is that as long as transit through the strait continues to normalize, the geopolitical risk premium appears likely to continue eroding. However, it is still too early to assume this calm will be permanent until the transit fee dispute between Iran and the US is resolved. Any news of new friction could quickly break this narrow consolidation band upwards.
$XTIUSD $XBRUSD
DYOR 🔍
  • Reward
  • 1
  • Repost
  • Share
ThisIsTranslateContent::
Get in quick! 🚗
$USDJPY Japan's currency crisis has moved well past a simple exchange rate story and into something showing up directly in bankruptcy filings, bond yields, and the credibility of official intervention itself.
The corporate toll is now measurable and record setting. Forty five Japanese firms filed for bankruptcy in the first half of 2026 explicitly citing yen weakness as a cause, according to Tokyo Shoko Research, which only began tracking this category in 2022, making this the worst six month stretch on record, up more than 30 percent from 34 a year earlier. The damage is concentrated almost
BTC-1.57%
ToTheYUE
$USDJPY Japan's currency crisis has moved well past a simple exchange rate story and into something showing up directly in bankruptcy filings, bond yields, and the credibility of official intervention itself.
The corporate toll is now measurable and record setting. Forty five Japanese firms filed for bankruptcy in the first half of 2026 explicitly citing yen weakness as a cause, according to Tokyo Shoko Research, which only began tracking this category in 2022, making this the worst six month stretch on record, up more than 30 percent from 34 a year earlier. The damage is concentrated almost entirely among smaller firms, over three quarters of these bankruptcies involved companies with liabilities under 100 million yen, wholesale and import dependent businesses that have essentially no pricing power to pass rising costs onto customers. The mechanism making this worse for many smaller importers is a specific hedging instrument, reverse knockout options, which void themselves the moment the yen crosses a preset trigger level, forcing exactly the firms least equipped to absorb losses into buying dollars at the single worst possible moment.
The currency itself has been genuinely unstable this week rather than just steadily weak. USD/JPY pushed to 162 on Tuesday, its weakest since 1986 and effectively a four decade low, before yen bulls attempted a rebound past 161 on reports Tokyo might stop pre-signaling intervention plans, a tactic meant to catch speculative shorts off guard rather than telegraph moves the way April's operation did. That rebound gave back roughly half its gains by Monday as Tokyo again failed to actually intervene despite Finance Minister Satsuki Katayama repeating that authorities stand ready to act. Markets are increasingly skeptical any intervention delivers more than a temporary pause, April and May's combined interventions reportedly totaled a record 11.7 trillion yen, around 73 billion dollars, and the currency has still ground back toward these same lows.
The bond market side adds a genuinely difficult constraint on how Japan can respond. Ten year JGB yields have pushed up near multi decade highs, and for an economy carrying debt around 260 percent of GDP, financed for years on the assumption of persistently cheap yen funding, rising yields directly raise the government's own debt servicing costs. That creates the bind at the center of this whole situation, a weak yen feeds import driven inflation, but the Bank of Japan can't tighten fast enough to defend the currency without risking the debt service math becoming unsustainable. Goldman Sachs has reportedly revised its USD/JPY forecast up from 155 to 165, reflecting the view that yen weakness has further to run rather than nearing exhaustion, and other reporting suggests a push toward 170 isn't out of the question.
Tonight's calendar carries real weight given this backdrop. Japan releases labor cash earnings, current account, and bank lending data, and the read here matters more than usual, strong wage growth would raise the odds of further Bank of Japan tightening, while soft prints keep the central bank in a dovish holding pattern, meaning continued yen softness. This connects to broader risk assets in a fairly direct way, higher Japanese rates tend to drain global liquidity since Japan has long been a major funding source for carry trades into other assets, while continued BOJ dovishness acts as a liquidity tailwind. Outside Japan the calendar stays quiet until Wednesday's FOMC minutes, which remains the bigger catalyst this week.
For anyone tracking correlated macro risk across currencies, bonds, and crypto on Gate, the practical read is that USD/JPY, the dollar index, and Bitcoin liquidity conditions are worth watching together rather than separately this week. The underlying message from Japan's data run so far is straightforward, the corporate bankruptcy numbers show the weak yen is now actively breaking parts of the domestic economy, but the bond yield constraint means Tokyo has limited room to fix it quickly without creating a separate fiscal problem, and liquidity conditions tend to move risk assets more than headlines do.
DYOR 🔍
#TradFiCFDGoldMasters
  • Reward
  • 3
  • Repost
  • Share
ThisIsTranslateContent::
DYOR 🤓
View More
#gStocksTokenizedStocksLive
With gStocks, the days of market closure are over. Access to eligible tokenized shares is available 24/7 through Gate, without being limited by normal trading hours.
The working principle of these products is quite simple: each tokenized share is backed by a one-to-one collateral against the corresponding physical stock. This means that owning a tokenized share provides direct exposure to the price movement of that company's physical stock; only the trading hours and infrastructure are handled via blockchain.
The biggest practical advantage of this is the ability t
SaharaDreams
#gStocksTokenizedStocksLive
With gStocks, the days of market closure are over. Access to eligible tokenized shares is available 24/7 through Gate, without being limited by normal trading hours.
The working principle of these products is quite simple: each tokenized share is backed by a one-to-one collateral against the corresponding physical stock. This means that owning a tokenized share provides direct exposure to the price movement of that company's physical stock; only the trading hours and infrastructure are handled via blockchain.
The biggest practical advantage of this is the ability to react instantly to important news that emerges during nighttime hours or weekends when traditional exchanges are closed. Normally, if a critical development regarding a company occurs after the stock market closes on Friday evening, investors have to wait until Monday morning, which usually comes with the risk of a sharp opening gap. In a continuously trading environment, position management against such news becomes much more flexible.
Fractional trading is also a key part of this structure, allowing access to high-priced stocks with small amounts, making traditionally high-entry assets much more accessible. Because digital assets and traditional stocks can be managed together within the same account structure, users can track their entire portfolio from a single location without switching between different platforms.
There's also a point to consider in continuously trading markets: during periods of low liquidity, especially at night, price fluctuations can be sharper than during normal trading hours, so position size and risk management should be handled more cautiously during these times. But overall, the idea that the market no longer recognizes time constraints, and that opportunities should also be open to time, aligns with Gate's offering of this structure to its users via gStocks.
  • Reward
  • 4
  • Repost
  • Share
ThisIsTranslateContent::
DYOR 🤓
View More
US technology funds recorded net inflows of $14.3 billion in the week ending July 1, marking the second-largest weekly inflow in history. The four-week moving average also rose to a record high of $9.0 billion, with the annualized rate projected to reach $152 billion by 2026.
What's truly remarkable is not the figure itself, but the sharp fluctuations it represents. Two weeks ago, technology funds saw inflows of $19.2 billion; last week, this completely reversed, with outflows of $9.3 billion; and now we are witnessing a strong recovery. This three-week zigzag demonstrates the volatile and rap
MSCI2.44%
Z谋谋nxcrypto
US technology funds recorded net inflows of $14.3 billion in the week ending July 1, marking the second-largest weekly inflow in history. The four-week moving average also rose to a record high of $9.0 billion, with the annualized rate projected to reach $152 billion by 2026.
What's truly remarkable is not the figure itself, but the sharp fluctuations it represents. Two weeks ago, technology funds saw inflows of $19.2 billion; last week, this completely reversed, with outflows of $9.3 billion; and now we are witnessing a strong recovery. This three-week zigzag demonstrates the volatile and rapidly shifting nature of market appetite for the technology sector, with capital movements constantly changing direction instead of a stable trend.
This is further evidenced by the fact that broad-based US equity funds experienced their largest weekly outflow since March during the same period. According to a Bank of America report based on EPFR data, US equity funds saw outflows of $17.2 billion in a single week. This doesn't necessarily mean the market has crashed, but it indicates that investors are becoming more cautious after a period of strong rally. During the same week, global equity funds attracted a total of $10.4 billion in inflows, with Asian equity funds recording their strongest inflow in seven weeks, totaling $7 billion, while US funds saw limited inflows of around $1 billion. This is a clear sign of rotation; capital appears to be shifting away from US and technology concentrations to regions with less valuation pressure. However, technology funds themselves continue to attract strong inflows independently of this rotation, suggesting that both are occurring simultaneously.
A strategist at BNY interpreted this as a sign of fatigue in the AI-focused rally, and the MSCI World Index also fell 2.07% last week amid concerns about concentration risks and spending plans by large cloud companies. On the other hand, BNP Paribas's head of Asia Pacific equity research stated that the bank's technology analysts see no signs of a slowdown in the sector's earnings momentum and expect the second-quarter earnings season to be supportive. So, even among institutions, there's no clear consensus on what this data means.
The real significance of this picture is that it shows capital is now aggressively concentrating not on the broad-based US market, but directly on the technology and semiconductor sector. Such a concentration can lead to sharp rises when news supporting the sector emerges, but it also carries the risk of equally sharp pullbacks in the event of any negative surprises. For those following both equity and crypto markets through Gate, the key point to watch is whether this three-week zigzag of ups and downs will stabilize in one direction in the coming weeks, because the current picture shows less of a clear trend reversal and more how fragile the market's confidence in the technology sector has become.
#gStocksTokenizedStocksLive #ShareYourUSStocks #IntroducingGateStocks
  • Reward
  • 3
  • Repost
  • Share
ThisIsTranslateContent::
Firmly HODL💎
View More
The Russell 2000 forward price-to-earnings ratio, when considering all companies, has risen to approximately 33x, surpassing even the peak of the dot-com bubble in 2000. Excluding loss-making companies, the ratio remains around 16x, a level not seen in nearly thirty years.
The gap between these two figures is actually the most telling detail. It's widely known that approximately forty percent of the components of the small business index are currently not profitable, which is the main factor mathematically inflating the index's headline P/E ratio. Such a large segment of an index having negati
US2000-0.60%
US500-0.73%
Z谋谋nxcrypto
The Russell 2000 forward price-to-earnings ratio, when considering all companies, has risen to approximately 33x, surpassing even the peak of the dot-com bubble in 2000. Excluding loss-making companies, the ratio remains around 16x, a level not seen in nearly thirty years.
The gap between these two figures is actually the most telling detail. It's widely known that approximately forty percent of the components of the small business index are currently not profitable, which is the main factor mathematically inflating the index's headline P/E ratio. Such a large segment of an index having negative or near-zero earnings can make the average ratio appear absurdly high, as the earnings side becomes almost irrelevant as a denominator. Even when you exclude loss-making companies and only look at profitable ones, reaching a level of 16x indicates a real strain on the pure valuation side as well; this isn't just a statistical distortion.
This picture is the result of a dramatic transformation in the small business sector over the past year. At the start of the year, the Russell 2000 was trading at a historic valuation discount compared to the S&P 500, with forward P/E ratios around 18 times, while the S&P 500 was over 24 times. This rotation, driven by the expectation that Fed interest rate cuts would ease the variable-rate debt burden on small businesses, gained momentum over time, and the index experienced several sharp upward periods during the year. However, much of this growth came from multiple expansions rather than profit growth—meaning prices increased much faster than earnings.
The risk side of this should not be ignored. A significant portion of small business debt is variable-rate, and many of these companies will have to refinance debt taken out during low-rate periods. With the possibility of interest rate hikes back on the table and the Fed adopting a hawkish stance, these highly valued but low-earnings companies are particularly vulnerable. Historically, such widespread valuation excesses, especially in parts not supported by earnings growth, tend to experience the sharpest corrections when the interest rate environment tightens.
This means that beneath the strong performance story of the small business index lie two different realities: a reasonable recovery of genuinely profitable companies with solid balance sheets, and the simultaneous overvaluation of underperforming companies inflated by speculative interest and low interest rate expectations. For those following both the stock and crypto markets through Gate, the crucial point is that as long as this divergence continues, every new signal regarding the Fed's interest rate path will continue to produce much sharper reactions in the small business index compared to large stock indices, because this segment's debt structure and earnings quality represent a much more fragile version of the average.
#gStocksTokenizedStocksLive
#ShareYourUSStocks #IntroducingGateStocks #USStocks
$US2000
  • Reward
  • 4
  • Repost
  • Share
ThisIsTranslateContent::
DYOR 🤓
View More
The Russell 2000 forward price-to-earnings ratio, when considering all companies, has risen to approximately 33x, surpassing even the peak of the dot-com bubble in 2000. Excluding loss-making companies, the ratio remains around 16x, a level not seen in nearly thirty years.
The gap between these two figures is actually the most telling detail. It's widely known that approximately forty percent of the components of the small business index are currently not profitable, which is the main factor mathematically inflating the index's headline P/E ratio. Such a large segment of an index having negati
US2000-0.60%
US500-0.73%
ToTheYUE
The Russell 2000 forward price-to-earnings ratio, when considering all companies, has risen to approximately 33x, surpassing even the peak of the dot-com bubble in 2000. Excluding loss-making companies, the ratio remains around 16x, a level not seen in nearly thirty years.
The gap between these two figures is actually the most telling detail. It's widely known that approximately forty percent of the components of the small business index are currently not profitable, which is the main factor mathematically inflating the index's headline P/E ratio. Such a large segment of an index having negative or near-zero earnings can make the average ratio appear absurdly high, as the earnings side becomes almost irrelevant as a denominator. Even when you exclude loss-making companies and only look at profitable ones, reaching a level of 16x indicates a real strain on the pure valuation side as well; this isn't just a statistical distortion.
This picture is the result of a dramatic transformation in the small business sector over the past year. At the start of the year, the Russell 2000 was trading at a historic valuation discount compared to the S&P 500, with forward P/E ratios around 18 times, while the S&P 500 was over 24 times. This rotation, driven by the expectation that Fed interest rate cuts would ease the variable-rate debt burden on small businesses, gained momentum over time, and the index experienced several sharp upward periods during the year. However, much of this growth came from multiple expansions rather than profit growth—meaning prices increased much faster than earnings.
The risk side of this should not be ignored. A significant portion of small business debt is variable-rate, and many of these companies will have to refinance debt taken out during low-rate periods. With the possibility of interest rate hikes back on the table and the Fed adopting a hawkish stance, these highly valued but low-earnings companies are particularly vulnerable. Historically, such widespread valuation excesses, especially in parts not supported by earnings growth, tend to experience the sharpest corrections when the interest rate environment tightens.
This means that beneath the strong performance story of the small business index lie two different realities: a reasonable recovery of genuinely profitable companies with solid balance sheets, and the simultaneous overvaluation of underperforming companies inflated by speculative interest and low interest rate expectations. For those following both the stock and crypto markets through Gate, the crucial point is that as long as this divergence continues, every new signal regarding the Fed's interest rate path will continue to produce much sharper reactions in the small business index compared to large stock indices, because this segment's debt structure and earnings quality represent a much more fragile version of the average.
#gStocksTokenizedStocksLive
#ShareYourUSStocks #IntroducingGateStocks #USStocks
$US2000
  • Reward
  • 3
  • Repost
  • Share
ThisIsTranslateContent::
Firmly HODL💎
View More
$USDTRY The Turkish lira has truly hit a new all-time low against the dollar, and this decline is actually a result of two interconnected narratives: one driven by deliberate policy choices, and the other by external shocks.
USD/TRY is currently trading above 46.70, having lost between 17% and 17.4% of its value in the last 12 months, and the lira has depreciated by approximately seven percent since the beginning of the year. This appears to be more of a gradual and managed depreciation than a panic-style collapse, as the central bank shifted to a more orthodox framework with Mehmet Şimşek's a
USDTRY0.24%
ToTheYUE
$USDTRY The Turkish lira has truly hit a new all-time low against the dollar, and this decline is actually a result of two interconnected narratives: one driven by deliberate policy choices, and the other by external shocks.
USD/TRY is currently trading above 46.70, having lost between 17% and 17.4% of its value in the last 12 months, and the lira has depreciated by approximately seven percent since the beginning of the year. This appears to be more of a gradual and managed depreciation than a panic-style collapse, as the central bank shifted to a more orthodox framework with Mehmet Şimşek's arrival at the Treasury and Finance Ministry in 2023. The underlying idea of this strategy is to create a gradual real appreciation by allowing the lira to depreciate slower than inflation, supported by foreign exchange interventions.
However, this managed decline scenario has been put to a real stress test in recent months. The energy shock triggered by the Iran war has posed a serious risk to the disinflation path, as Turkey is a heavily reliant economy on imports of oil and gas. Inflation rose for the second consecutive month in May, reaching 32.61%, prompting the central bank to keep interest rates unchanged for a third time in June. Therefore, the weakening of the lira is not only a monetary policy choice but also a direct reflection of a geopolitically driven energy cost shock.
From a technical perspective, the exchange rate has long been significantly above all moving averages, and the RSI indicator has remained in the overbought region almost continuously since mid-2022. This suggests that the market has priced in the weakening of the lira as a normalized trend, meaning that each new low is no longer a shock but a continuation of an expected process. Some analysts suggest that this outlook indicates the exchange rate could advance to 48 by 2026, although such predictions are subject to frequent changes due to political and economic uncertainties.
Structurally, it's important to emphasize that the central bank's independence in Türkiye is limited, and the president's power to change the bank's management has been used repeatedly in the past. Some analysts argue that the weak lira provides certain advantages to the economy by making exports cheaper and tourism more attractive, meaning this picture can be read not only as an indicator of weakness but also as part of a deliberate competitiveness strategy.
In conclusion, the picture here is closer to a deliberately managed devaluation process, driven by an energy shock and structural inflationary pressures, than to a pure capital flight panic scenario. For those following exchange rate and macroeconomic developments through Gate, the main point to watch is whether the central bank will continue with interest rate cuts in upcoming meetings, because a renewed rise in inflation remains the most critical factor directly testing the sustainability of this gradually managed decline strategy.
#TradFiCFDGoldMasters
  • Reward
  • 3
  • Repost
  • Share
ThisIsTranslateContent::
Firmly HODL 💎
View More
History was made, and this time it was Morocco that wrote it.
The Atlas Lions advanced to the quarterfinals of the 2026 World Cup by eliminating Canada with a resounding 3-0 victory, becoming the first African nation to reach the quarterfinals in two consecutive tournaments. This is more than just a match result; it's the continuation of a much larger story. Morocco, which hadn't even qualified for a World Cup since 1998 before 2018, experienced an unprecedented rise in football history over the last four years. In 2022 in Qatar, they topped their group and reached the semifinals, achieving so
ToTheYUE
History was made, and this time it was Morocco that wrote it.
The Atlas Lions advanced to the quarterfinals of the 2026 World Cup by eliminating Canada with a resounding 3-0 victory, becoming the first African nation to reach the quarterfinals in two consecutive tournaments. This is more than just a match result; it's the continuation of a much larger story. Morocco, which hadn't even qualified for a World Cup since 1998 before 2018, experienced an unprecedented rise in football history over the last four years. In 2022 in Qatar, they topped their group and reached the semifinals, achieving something no other African team had ever done. They didn't stop there; they set a historic 19-match unbeaten run, won the 2025 FIFA Arab Cup, and also became champions of the Africa Cup of Nations that same year.
The architect of this latest success is Mohamed Ouahbi, who took over the national team in 2026 and previously coached Morocco's U20 and U23 squads. At the heart of the team is Paris Saint-Germain's left-back Achraf Hakimi, who has increased the national team's goal tally to 12, while in midfield, Bayern Munich's Ismael Saibari has emerged as the tournament's surprise star and is Morocco's top scorer. Goalkeeper Yassine Bounou has also been a cornerstone of the defense with seven crucial saves in five matches. In a post-match statement, coach Ouahbi said this team is not afraid of history, they are here to make history.
The quarter-final race continues at full speed. A real giant match is next: five-time champions Brazil face Norway in New Jersey on Sunday. Brazil narrowly advanced to the round of 16 with a 2-1 victory over Japan, thanks to a late goal – their first comeback win in a knockout match since 2002. Norway, meanwhile, secured their first round of 16 victory in 28 years with a 2-1 win against Ivory Coast, also thanks to a late goal from Erling Haaland.
The story of this match is actually hidden in the encounter between Haaland and Vinicius Junior. The Norwegian star is in the middle of the Golden Boot race with five goals in the tournament, while the Brazilian star is the driving force of the attack with four goals and one assist. Interestingly, Norway has never lost to Brazil in their four previous encounters, with two wins and two draws, including the unforgettable 2-1 victory in the 1998 World Cup group stage. But Brazil is struggling with injuries, with Raphinha and Lucas Paqueta unavailable, severely limiting Ancelotti's midfield options.
The odds give Brazil a 53.6% chance of winning and Norway a 22.4% chance, with the remainder going to extra time. Will the experience of the five-time champions prevail, or will Haaland once again be a last-minute hero? The answer will be revealed on the pitch shortly.
The winner will face the winner of the Mexico-England match in Miami in the quarter-finals. Make your prediction now via Gate Polymarket.
https://www.gate.com/competition/road-to-champion
#PredictWorldCup🇧🇷vs🇳🇴
#WorldCup2026
#PredictWorldCupWin40000U
#PredictWorldCupShare20000U
  • Reward
  • 4
  • Repost
  • Share
ThisIsTranslateContent::
DYOR 🤓
View More
🎁 Community Growth Lucky Draw #20 entry has upgraded—check it out!
Bigger prize pool. 100% win rate!
Win up to $10,000 CFD Position Vouchers, fee rebate vouchers and more!
How to join:
1️⃣ Gate Square → Tap 【+】 → Activity Center
2️⃣ Earn Growth Points by posting, liking, and commenting
3️⃣ Every 300 Growth Points = 1 draw
Draw now 👉 https://www.gate.com/activities/pointprize?now_period=20
#BTC #ETH #SPCX
BTC-1.57%
ETH-2.62%
SPCX-6.45%
Gate_Square
🎁 Community Growth Lucky Draw #20 entry has upgraded—check it out!
Bigger prize pool. 100% win rate!
Win up to $10,000 CFD Position Vouchers, fee rebate vouchers and more!
How to join:
1️⃣ Gate Square → Tap 【+】 → Activity Center
2️⃣ Earn Growth Points by posting, liking, and commenting
3️⃣ Every 300 Growth Points = 1 draw
Draw now 👉 https://www.gate.com/activities/pointprize?now_period=20
#BTC #ETH #SPCX
repost-content-media
  • Reward
  • 4
  • Repost
  • Share
ThisIsTranslateContent::
Hurry up and get on board! 🚗
View More
Stocks on-chain. Every token backed 1:1 by real shares.
Gate gStocks is now live. Tokenized securities with real stock reserves, 24/7 trading, dividends auto-settled, fractional access from just 1 USDT, and more - all within your existing Gate account.
Tokenized or direct stock access. Two ways in. One platform. Your call.
Traditional stocks. Crypto flexibility.
Learn more:https://www.gate.com/announcements/article/100483
Gate_Square
Stocks on-chain. Every token backed 1:1 by real shares.
Gate gStocks is now live. Tokenized securities with real stock reserves, 24/7 trading, dividends auto-settled, fractional access from just 1 USDT, and more - all within your existing Gate account.
Tokenized or direct stock access. Two ways in. One platform. Your call.
Traditional stocks. Crypto flexibility.
Learn more:https://www.gate.com/announcements/article/100483
repost-content-media
  • Reward
  • 5
  • Repost
  • Share
ThisIsTranslateContent::
Get in quick! 🚗
View More
⚽ Enjoying World Cup? Try Gate Prediction Markets!
Join Gate Square Growth Lucky Draw 20 to win Prediction Market Vouchers and more!
No trading required—just post, comment, and interact on Gate Square to enter.
100% win rate 👉 https://www.gate.com/activities/pointprize?now_period=20
💰 Prizes include:
CFD Position Vouchers, Fee Rebate Vouchers, Earn Trial Funds, VIP Cards, and more!
Details: https://www.gate.com/announcements/article/100364
#BTC #ETH #SPCX
BTC-1.57%
ETH-2.62%
SPCX-6.45%
Gate_Square
⚽ Enjoying World Cup? Try Gate Prediction Markets!
Join Gate Square Growth Lucky Draw 20 to win Prediction Market Vouchers and more!
No trading required—just post, comment, and interact on Gate Square to enter.
100% win rate 👉 https://www.gate.com/activities/pointprize?now_period=20
💰 Prizes include:
CFD Position Vouchers, Fee Rebate Vouchers, Earn Trial Funds, VIP Cards, and more!
Details: https://www.gate.com/announcements/article/100364
#BTC #ETH #SPCX
repost-content-media
  • Reward
  • 6
  • 1
  • Share
ThisIsTranslateContent::
Firmly HODL💎
View More
  • Pinned