ASongJin'an

vip
On-chain Analyst
Market Analyst
Crypto Market Researcher
Focus on contract trading waves, long-term, risk control first!
7.10 Gold Analysis
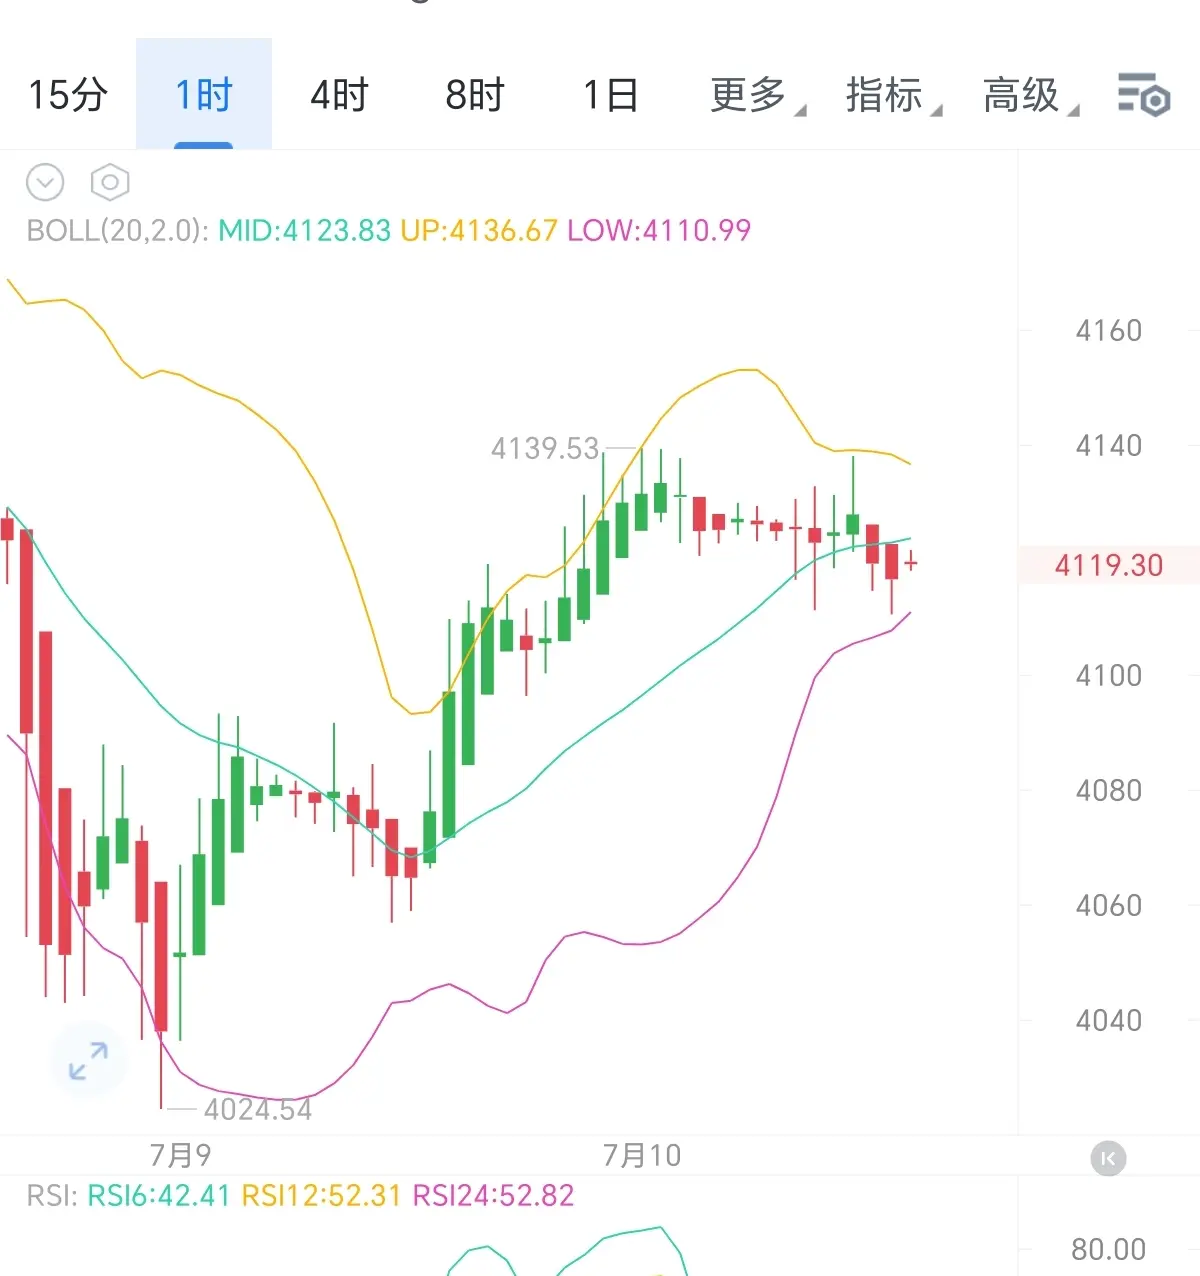
After rebounding from the 4024 low, gold prices surged to a phase high of 4139 before entering a convergent oscillation in a high-level consolidation range. Currently, prices are under pressure below the middle Bollinger Band at 4123, with the upper Bollinger Band at 4136 forming short-term strong resistance and the lower band at 4110 serving as initial support. The narrowing of the Bollinger Bands indicates an approaching breakout window.
The multi-period RSI indicators show a stepwise decline, with RSI6 falling to 42.41. Bullish momentum continues to wane, and the indicato
BTC1.74%
GT-0.14%
SOL0.62%
View Original
post-image
  • Reward
  • Comment
  • Repost
  • Share
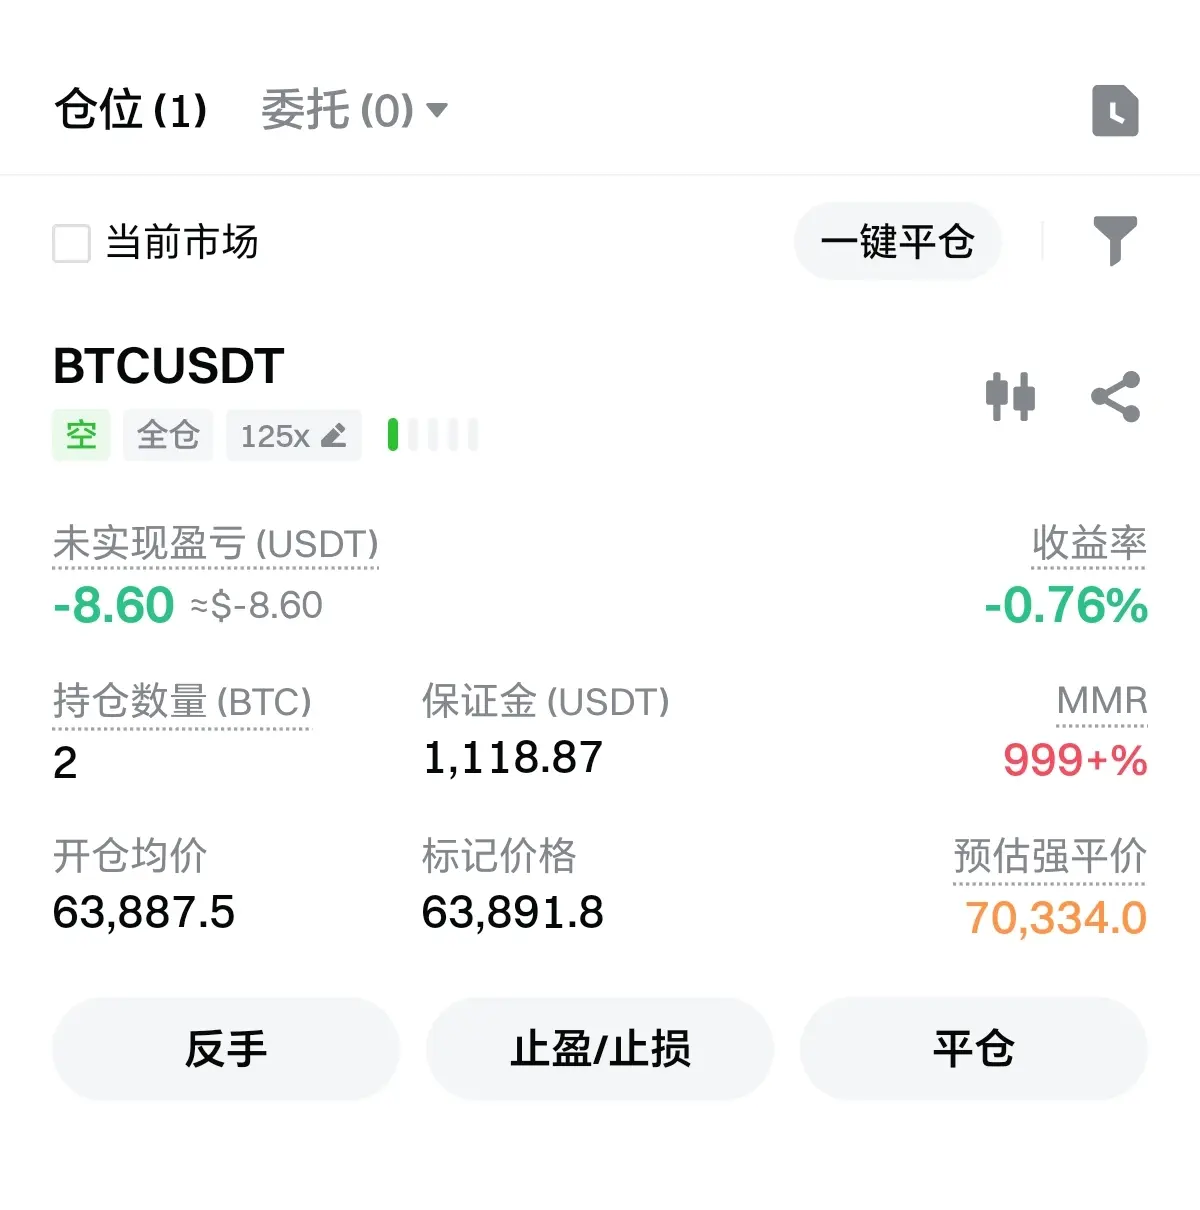
Buy/sell the “big pie” around 63900 at the current price—keep your position well-managed!$BTC $GT $SOL
BTC1.74%
GT-0.14%
SOL0.62%
View Original
post-image
  • Reward
  • 2
  • Repost
  • Share
ImpressiveEnoughToRivalThe:
Incomplete screenshots will all be treated as simulations, scamming retail investors.
View More
7.10 ETH Analysis
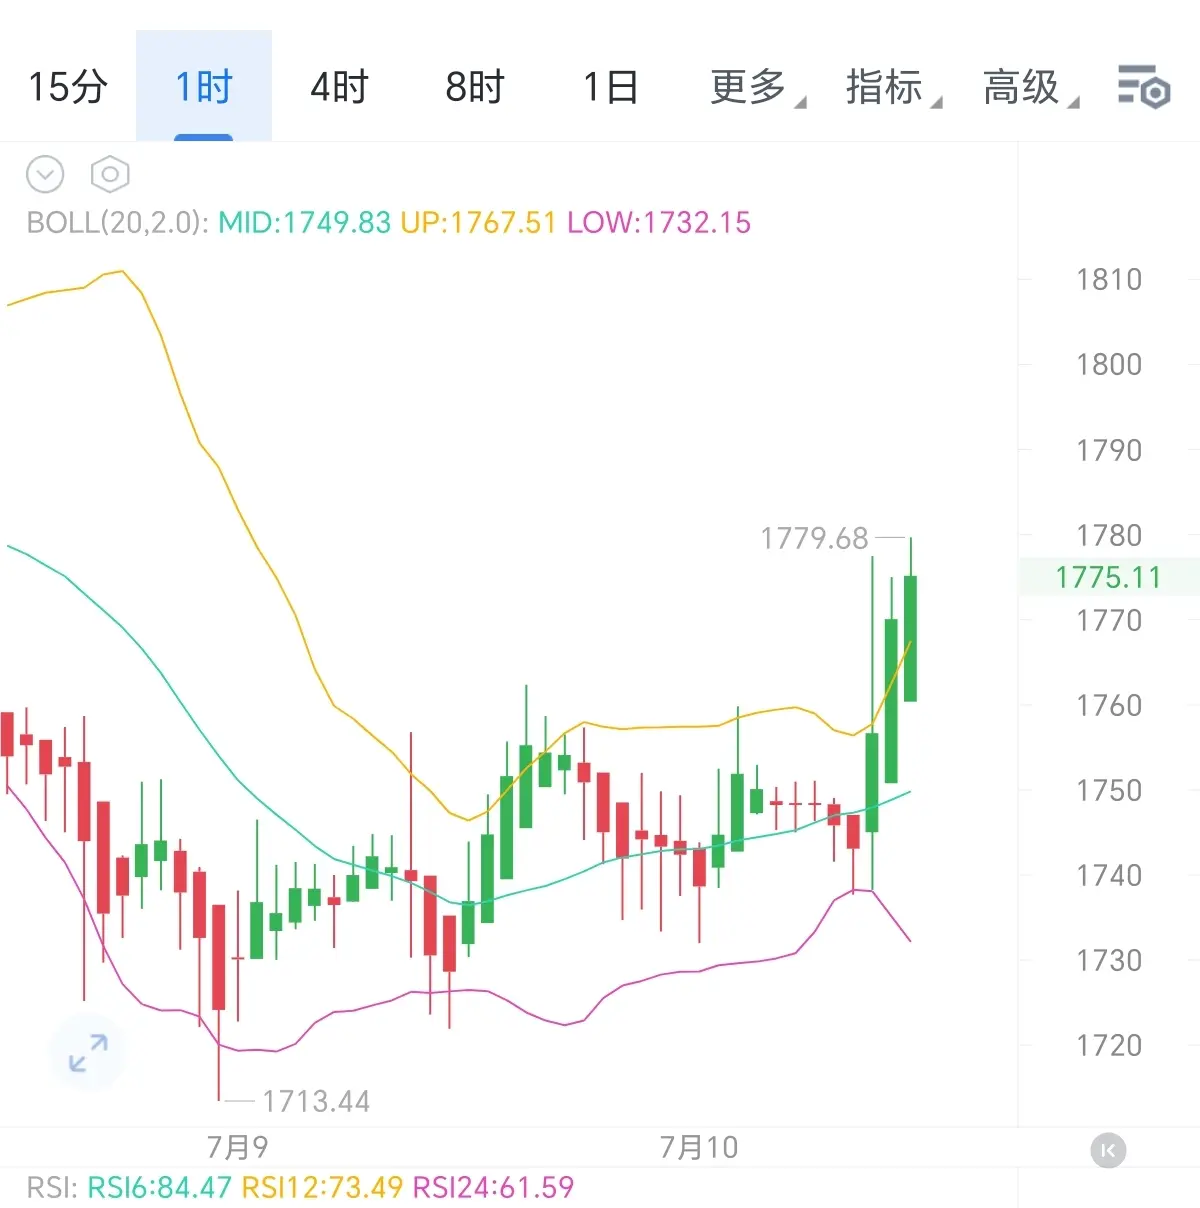
In the one-hour cycle structure, after the price formed a first buy low at 1713, it launched a rapid surge out of the secondary-level departure segment. It broke upward through the Bollinger upper band, forming an early divergence pattern. After pushing to 1779, the bullish force clearly began to fade. This is a secondary rebound following a downward consolidation center, not a high-level reversal trend. The previously broken Bollinger upper band has already been converted into a resistance anchor. The Bollinger middle band at 1749 is the long-short lifeline of the current le
BTC1.74%
GT-0.14%
SOL0.62%
View Original
post-image
  • Reward
  • Comment
  • Repost
  • Share
7.9 BTC Evening Analysis
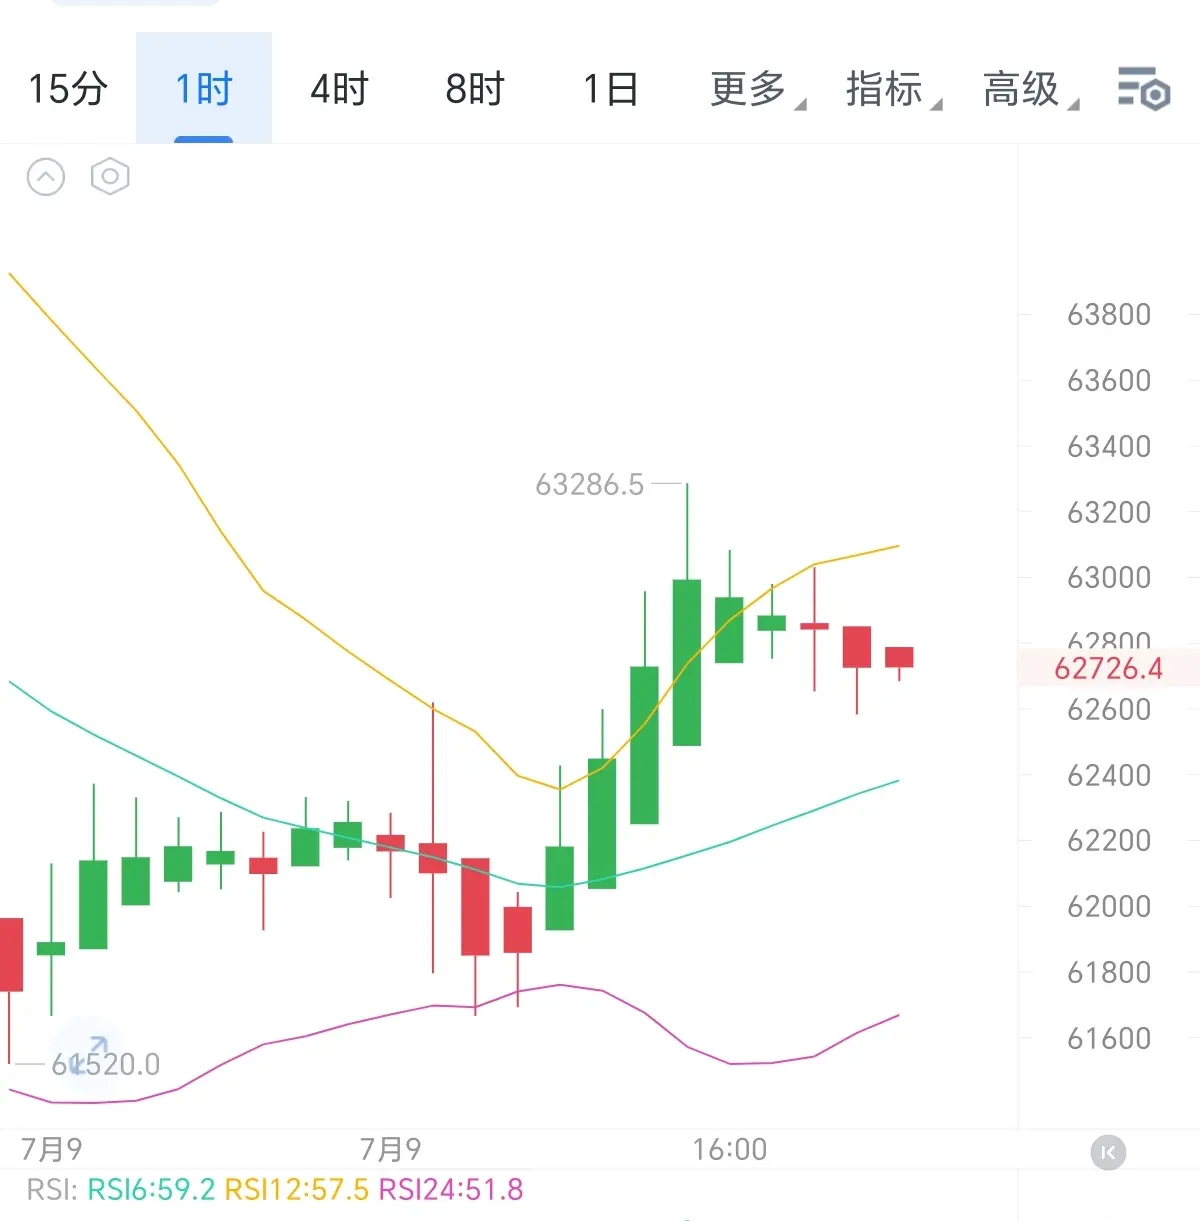
After a phased bottoming in the one-hour cycle structure of BTC, bullish funds concentrated their efforts to push the price upward. After surging to a high of 63286, momentum was exhausted, triggering a profit-taking adjustment from the highs. The current price is running in the sandwiched zone between two moving averages, with the medium- and long-term moving averages maintaining an upward trajectory. The overall upward pivot has not been broken, and the yellow trend line above has shifted from support to short-term resistance.
The RSI multi-cycle indicator has fallen
BTC1.74%
GT-0.14%
SOL0.62%
View Original
post-image
  • Reward
  • Comment
  • Repost
  • Share
Swing 2300 points out!$GT $SOL
GT-0.14%
SOL0.62%
View Original
post-image
post-image
  • Reward
  • Comment
  • Repost
  • Share
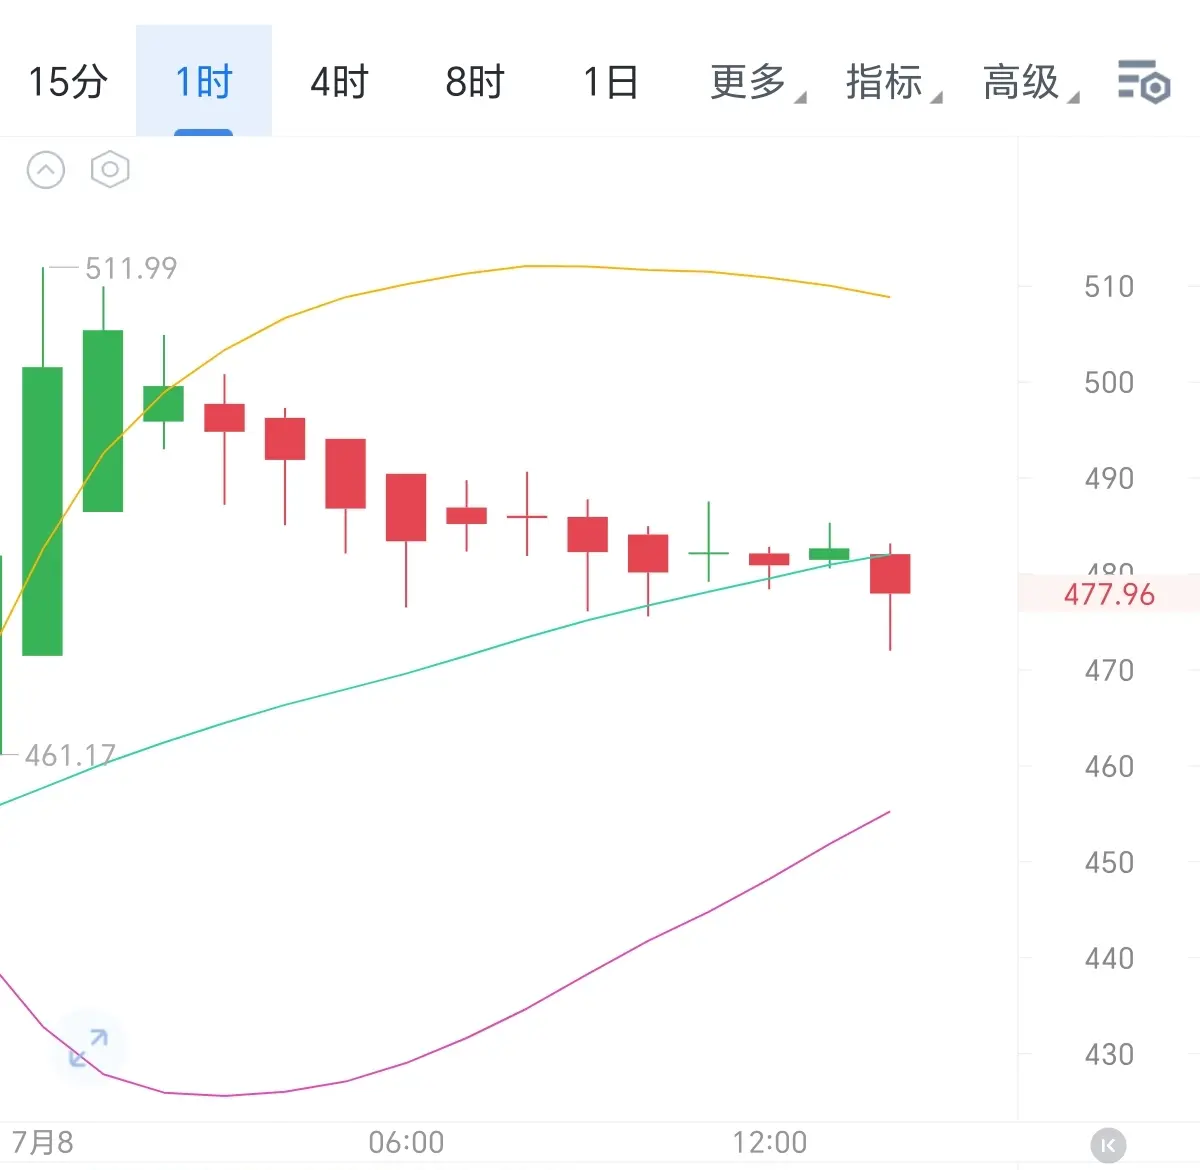
7.8 ZEC Analysis
ZEC plunged sharply from 511 to 461, a drop of over 50 points, then rebounded only to 47, with a retracement of just 33% of the prior decline, far below the Fibonacci 38.2% strength-weakness line (approximately 480.6), and did not even touch the 480 round number.
The rebound candle has a short body and a prominent upper wick, with the price quickly falling back to around 470, nearly erasing all the gains from the bounce, while volume failed to show effective expansion—a classic dead cat bounce. Bulls are weak, overhead supply is heavy, and the market is likely to test 460 or e
BTC1.74%
GT-0.14%
SOL0.62%
View Original
post-image
THANTHOIGIAN
THANTHOIGIANTHANTHOIGIAN
MC:$2.35KHolders:1
0.08%
  • Reward
  • 6
  • Repost
  • Share
ILoveWaterSpinach.:
🥺🥺🥺🥺🥺🥺🥺🥺🥺🥺🥺🥺🥺🥺🥺🥺🥺🥺🥺🥺🥺🥺
View More
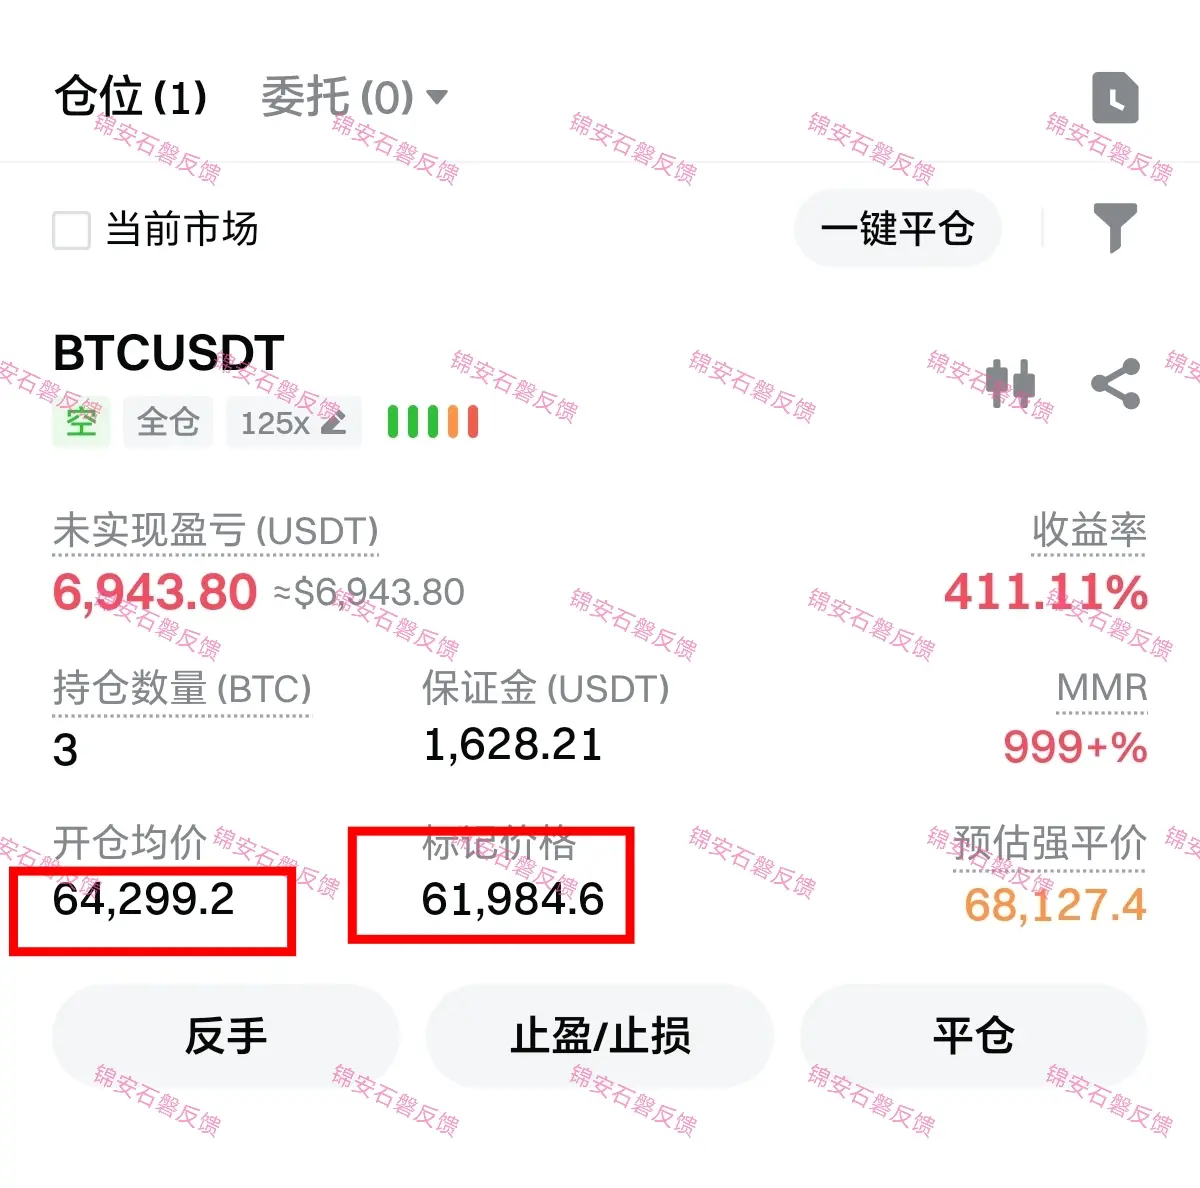
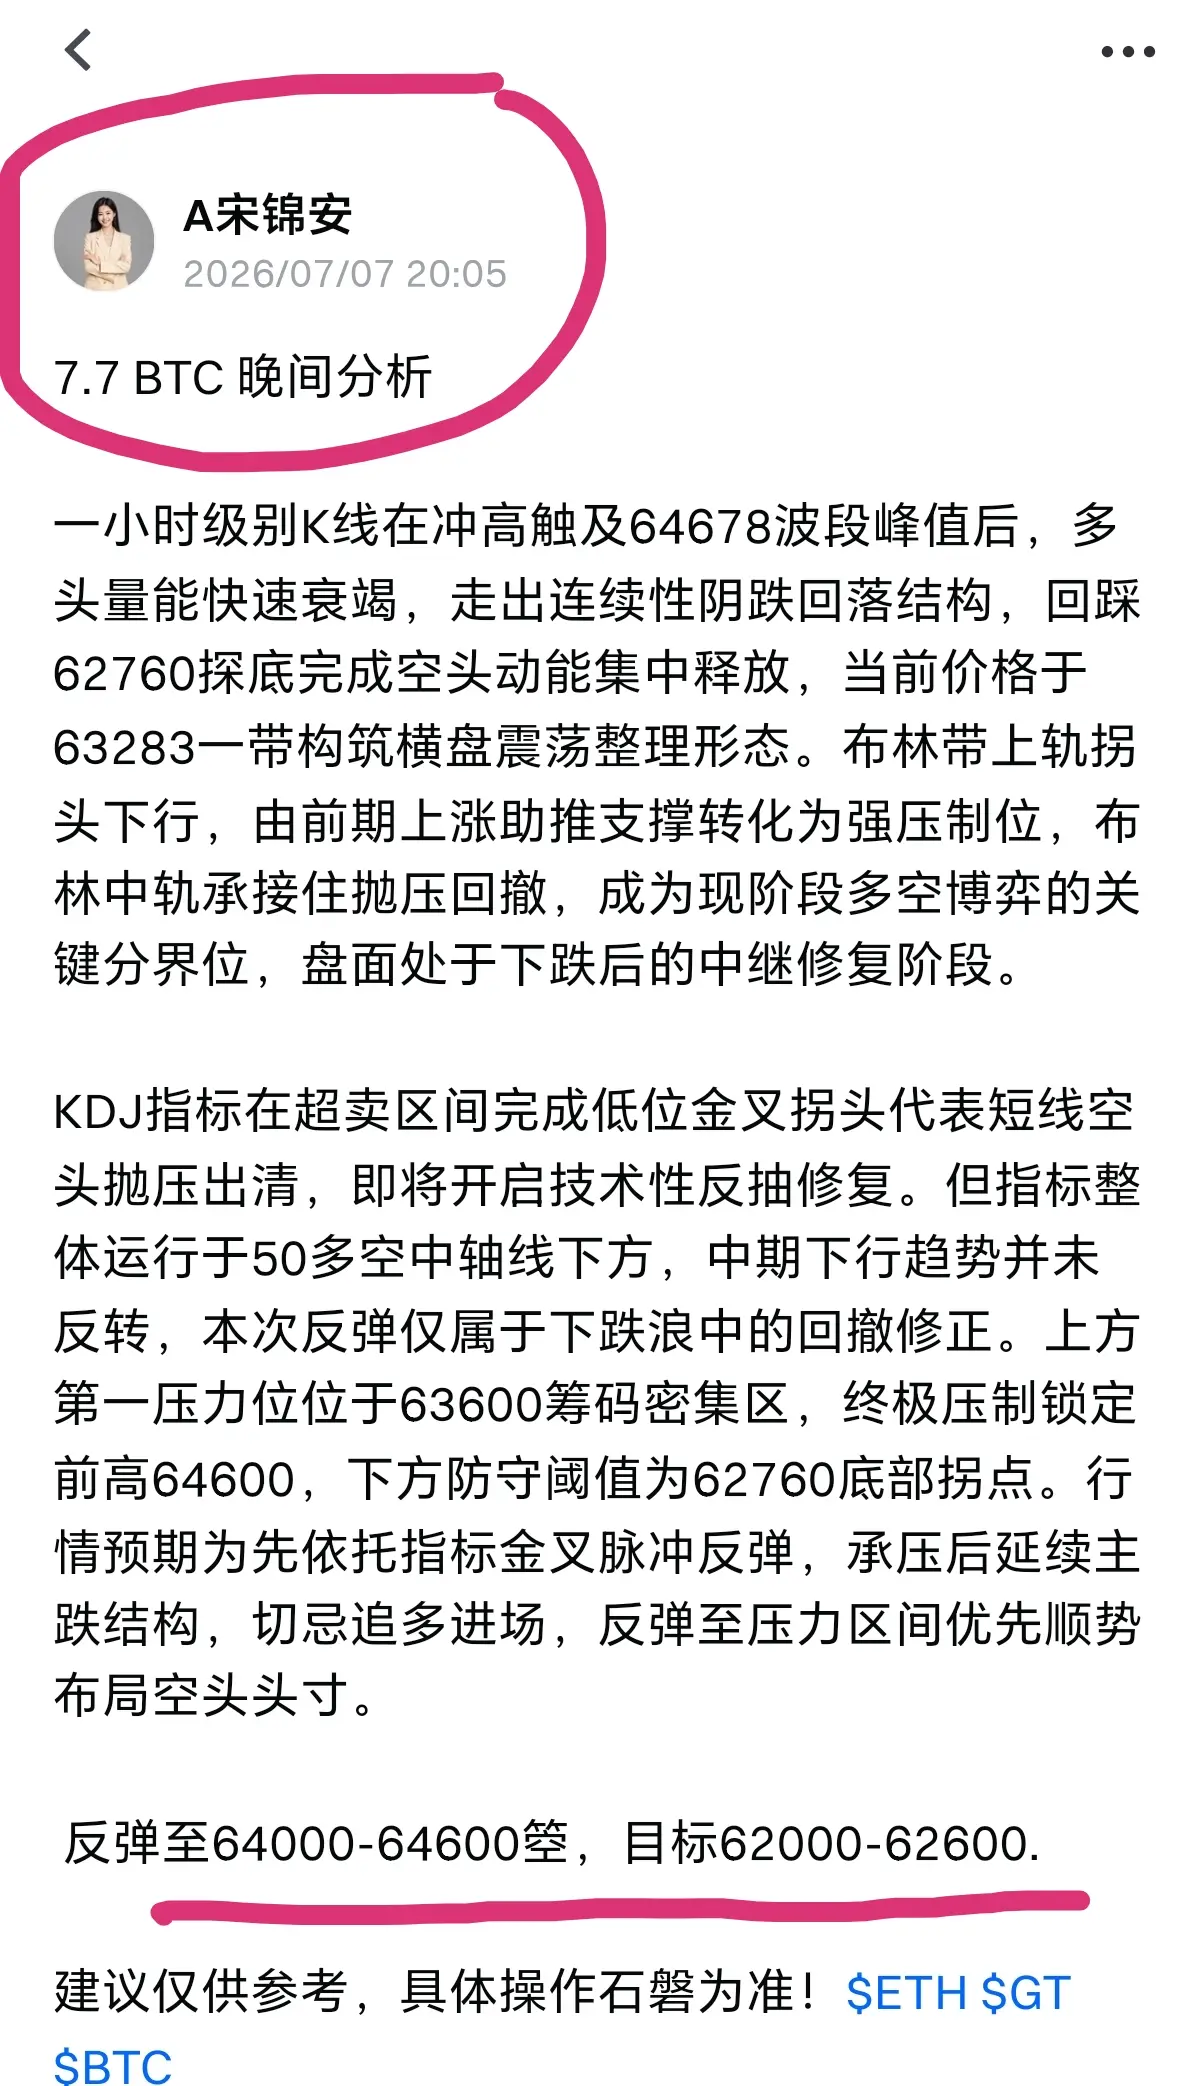
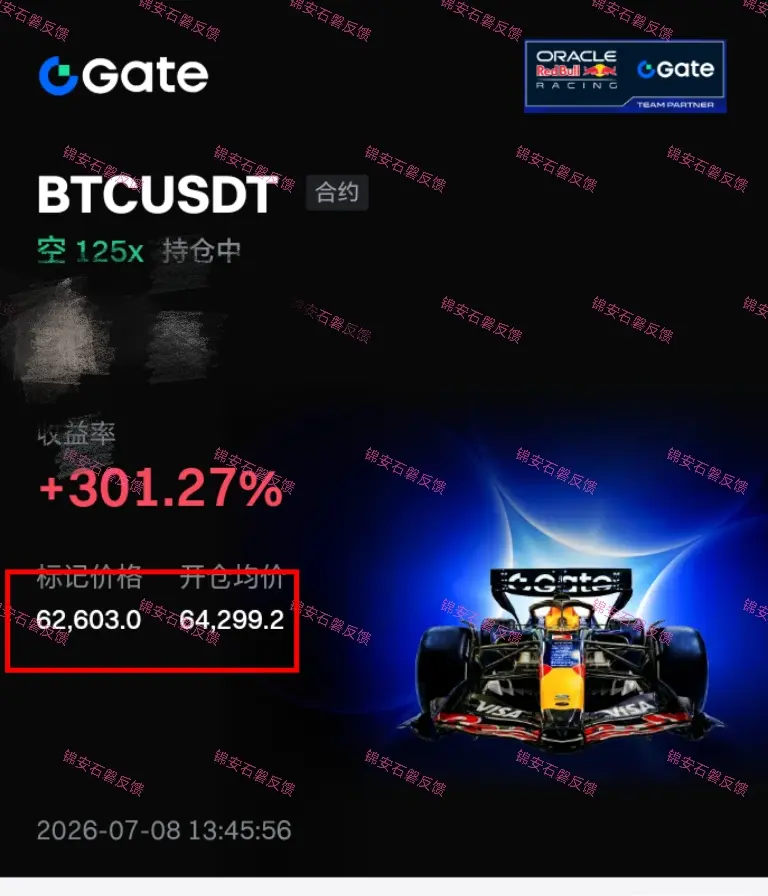
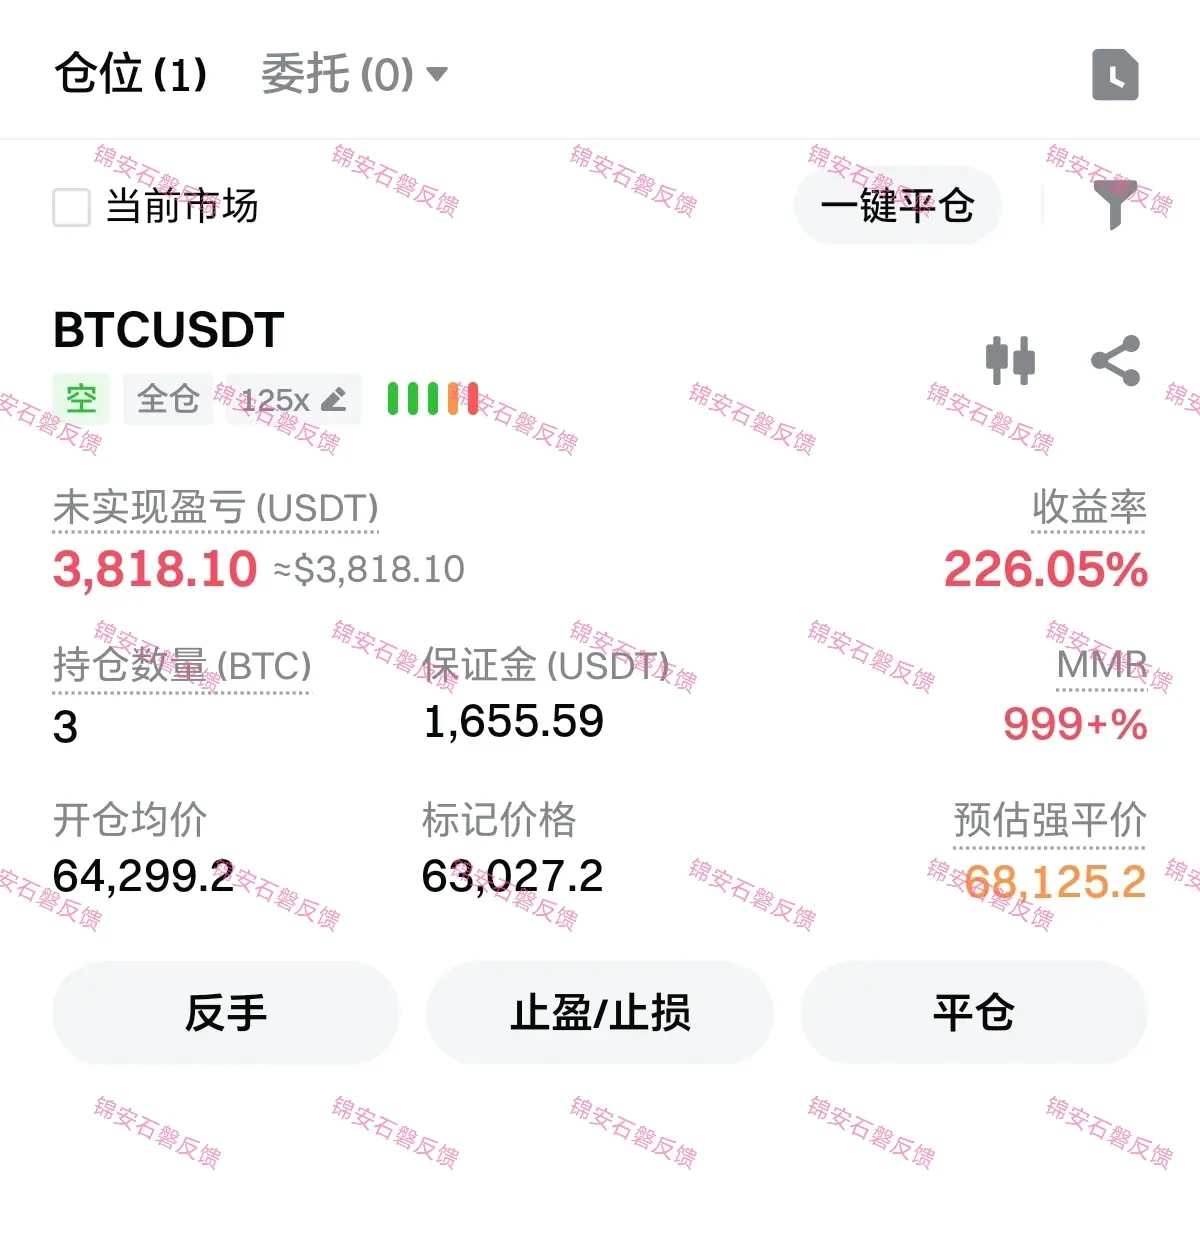
Holding a swing position! Currently all have room above thousand points!! Shorting above 64000 with eyes closed is free money!!
$ETH $GT $BTC #ANSEM持币地址突破12.2万
ETH1.06%
GT-0.14%
BTC1.74%
View Original
post-image
post-image
post-image
  • Reward
  • Comment
  • Repost
  • Share
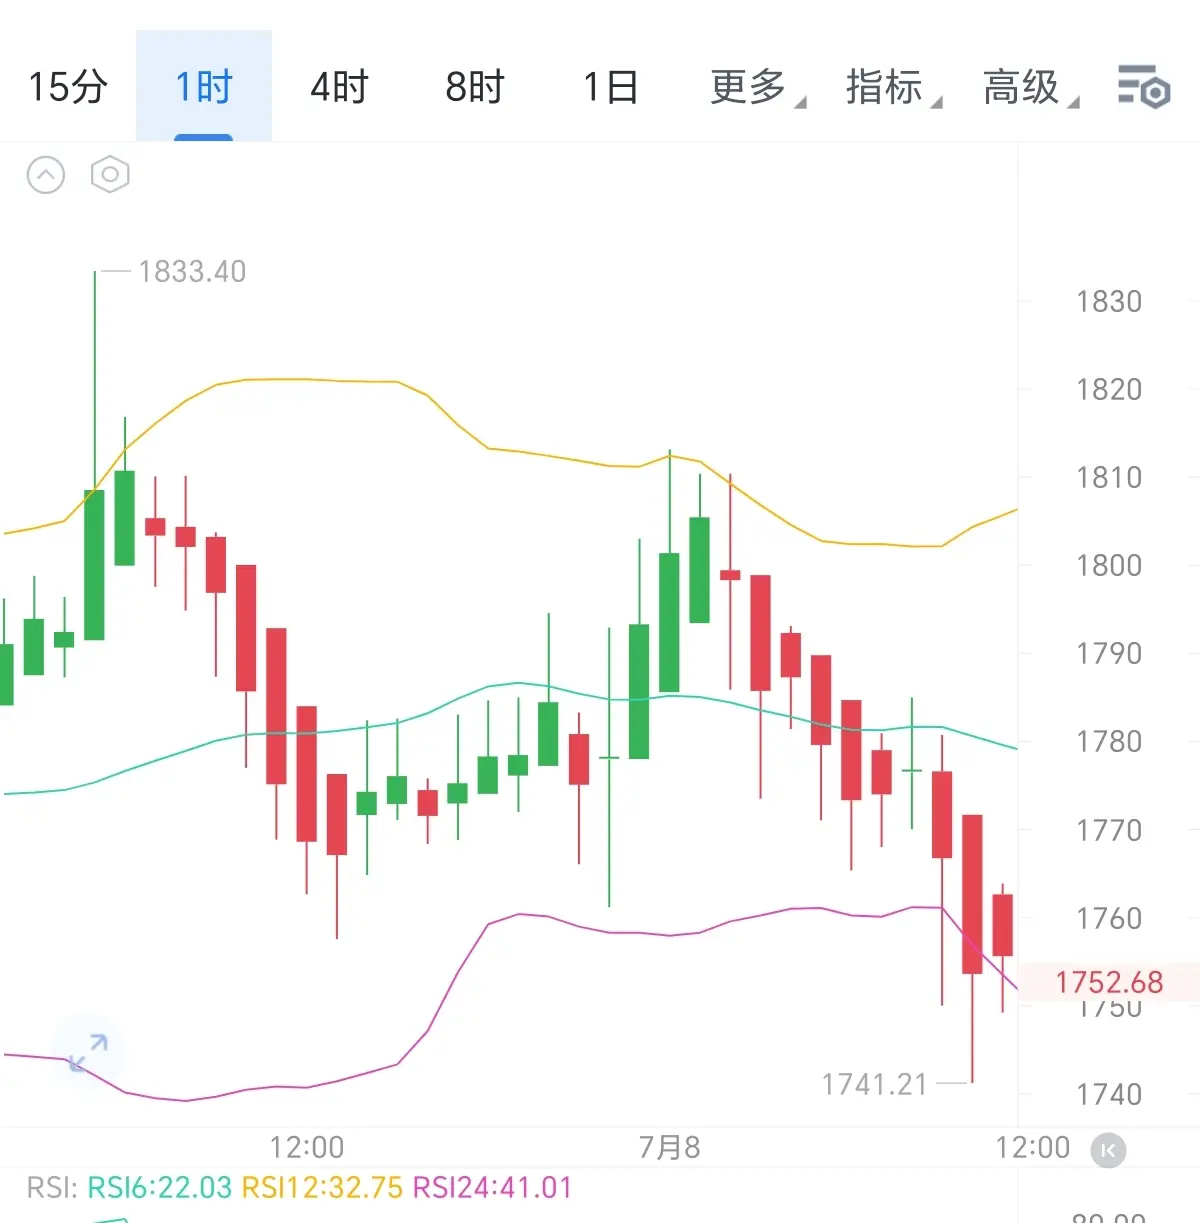
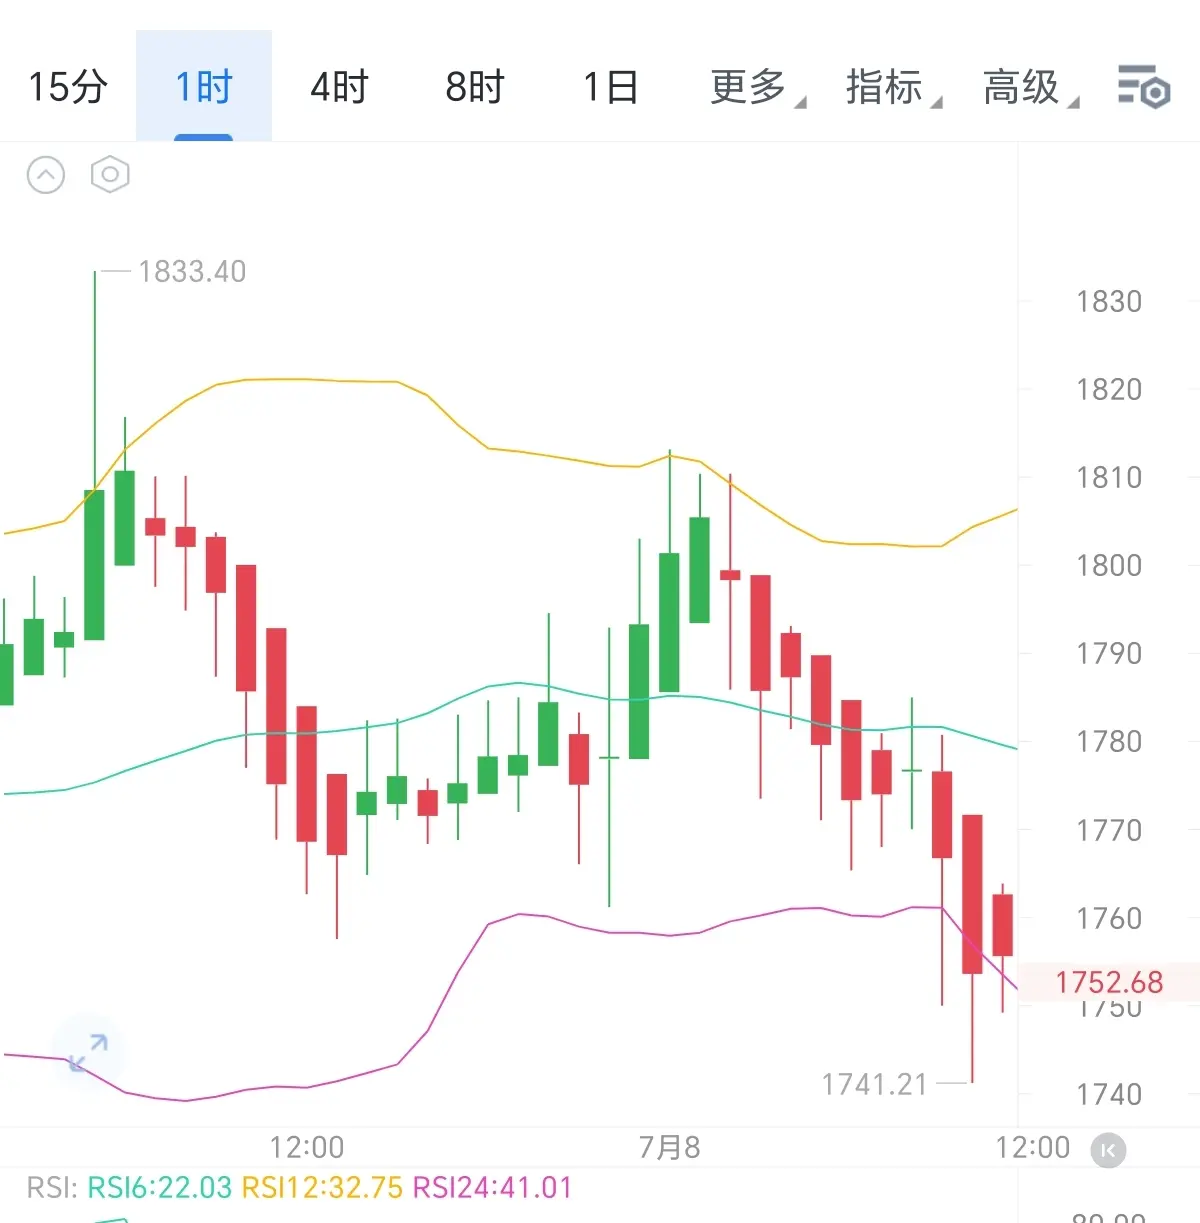
7.8ETH Midday Analysis
On the 15-minute timeframe, a structure of accelerated downward movement has emerged. The price fell continuously from a high of 1833 to 1741 in bearish candles, effectively capturing long stop-losses near the previous low, forming a liquidity pool sweep.
The current market is undergoing horizontal consolidation around 1752, which is close to the lower edge of the value area of recent volume distribution, with signs of phased exhaustion of selling pressure.
From the perspective of order flow, the order book in the 1740-1741 area shows an accumulation of passive buy o
View Original
post-image
  • Reward
  • Comment
  • Repost
  • Share
7.8 ETH Midday Analysis
On the 15-minute level, an accelerated pullback structure has unfolded. Price fell from the 1833 high with consecutive bearish candles down to 1741, effectively hunting long stop-loss orders near the previous low to form a liquidity pool cleanup. The current market is consolidating sideways around 1752. This area is near the lower boundary of the value area from the recent volume distribution, and there are signs of phased exhaustion in sell pressure. From the perspective of order flow, the order book in the 1740-1741 range shows passive bid stacking, forming a short-te
View Original
post-image
  • Reward
  • Comment
  • Repost
  • Share
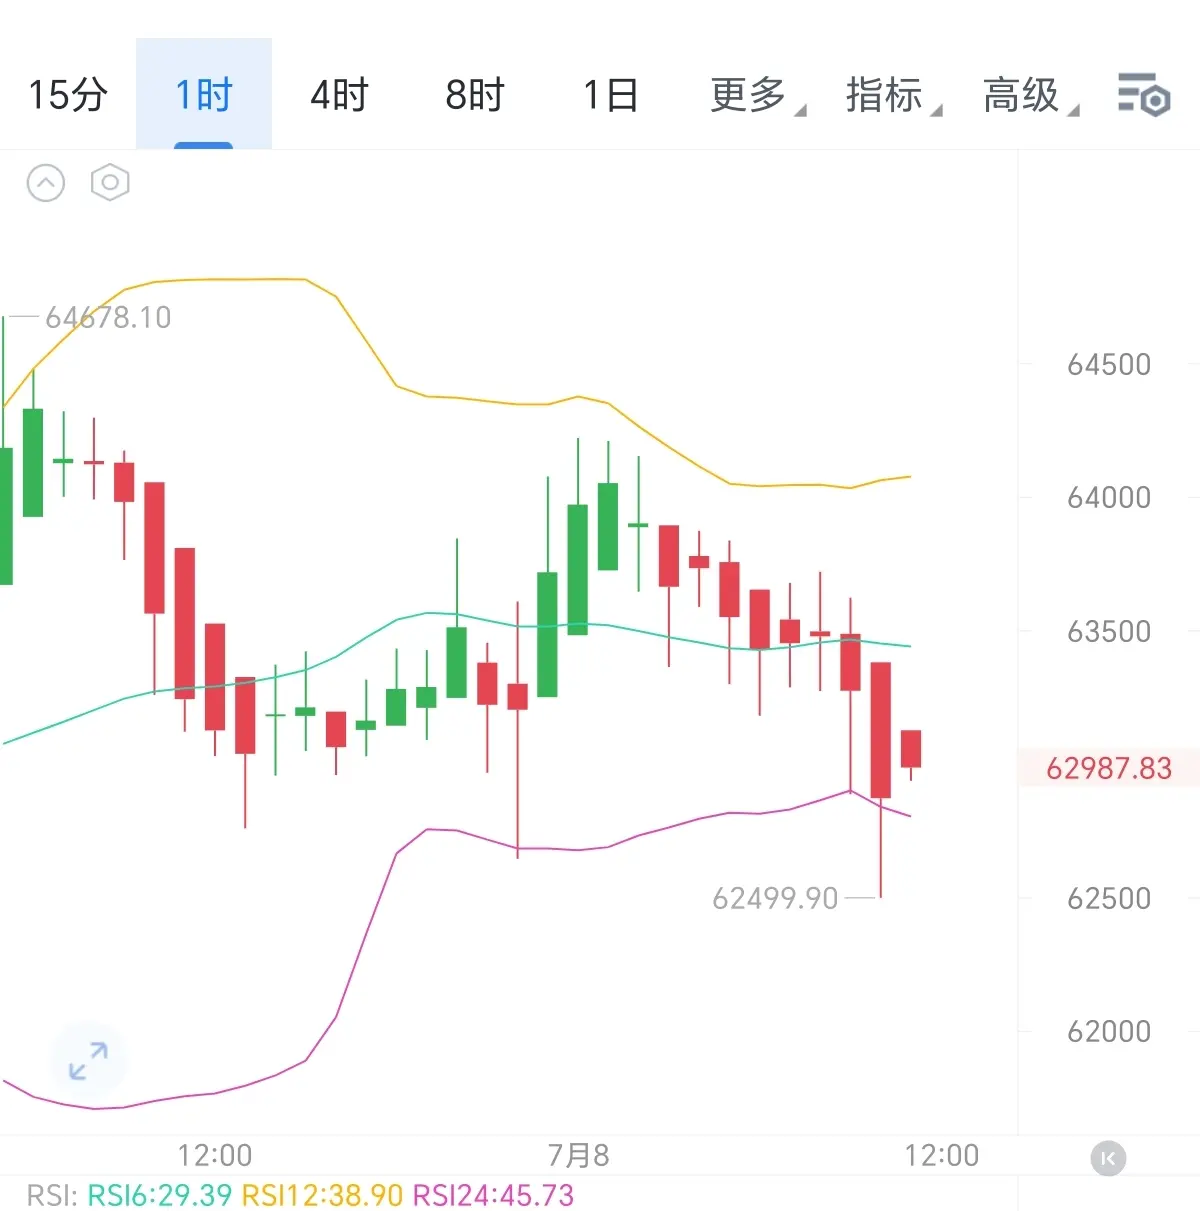
7.8 BTC Midday Analysis
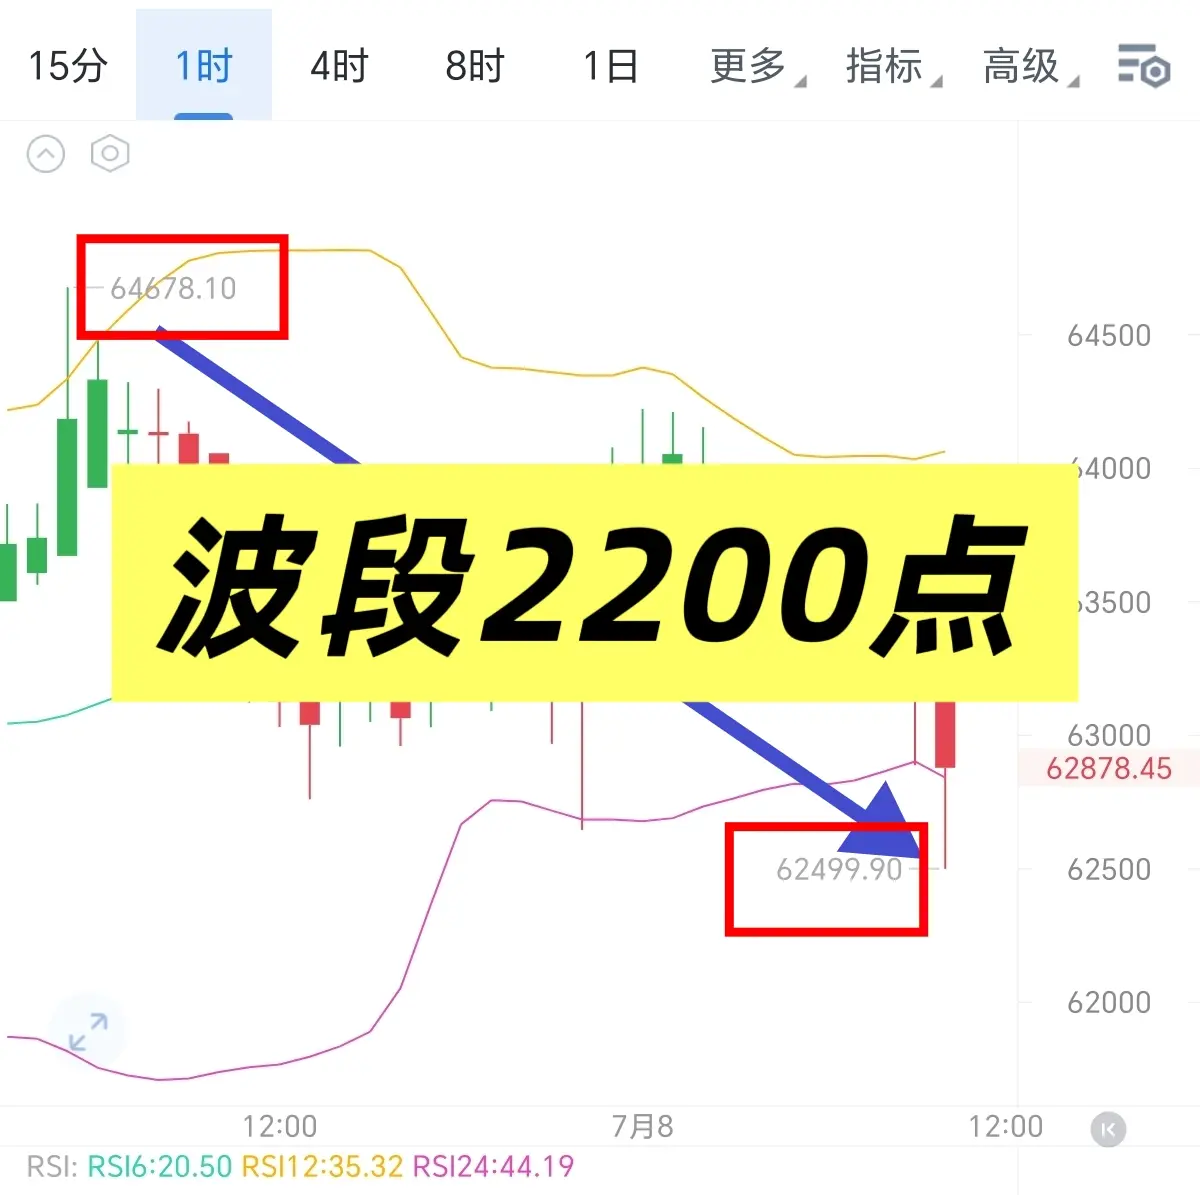
Currently, the BTC market shows a bearish continuation structure. During the Asian session, the price continuously slipped from the high of 64678 and touched a low of 62499 in the early morning. This level precisely hunted stop orders in the daily-level liquidity zone below. From a microstructure perspective, a clear market structure shift has occurred at the 4-hour level, with the previous low support turning into current resistance. The 63000-63200 range forms overlapping resistance from a supply zone and a fair value gap.
In terms of RSI divergence, RSI6 recorded 29.
BTC1.74%
GT-0.14%
View Original
post-image
NXS
NXSNexus Protocol
MC:$2.36KHolders:0
0.19%
  • Reward
  • Comment
  • Repost
  • Share
Band traders are holding positions!!
Without accumulating small steps, one cannot reach a thousand miles; without enduring long nights, how can one see the dawn!
Yesterday, the swing trade again “cleared out” more than 2,000 lots—how many did you take?
$ETH #GUSD年化升至3.8%
ETH1.06%
View Original
post-image
post-image
  • Reward
  • 2
  • Repost
  • Share
Lotte'sLittleSidekick:
66
View More
7.7 BTC Evening Analysis
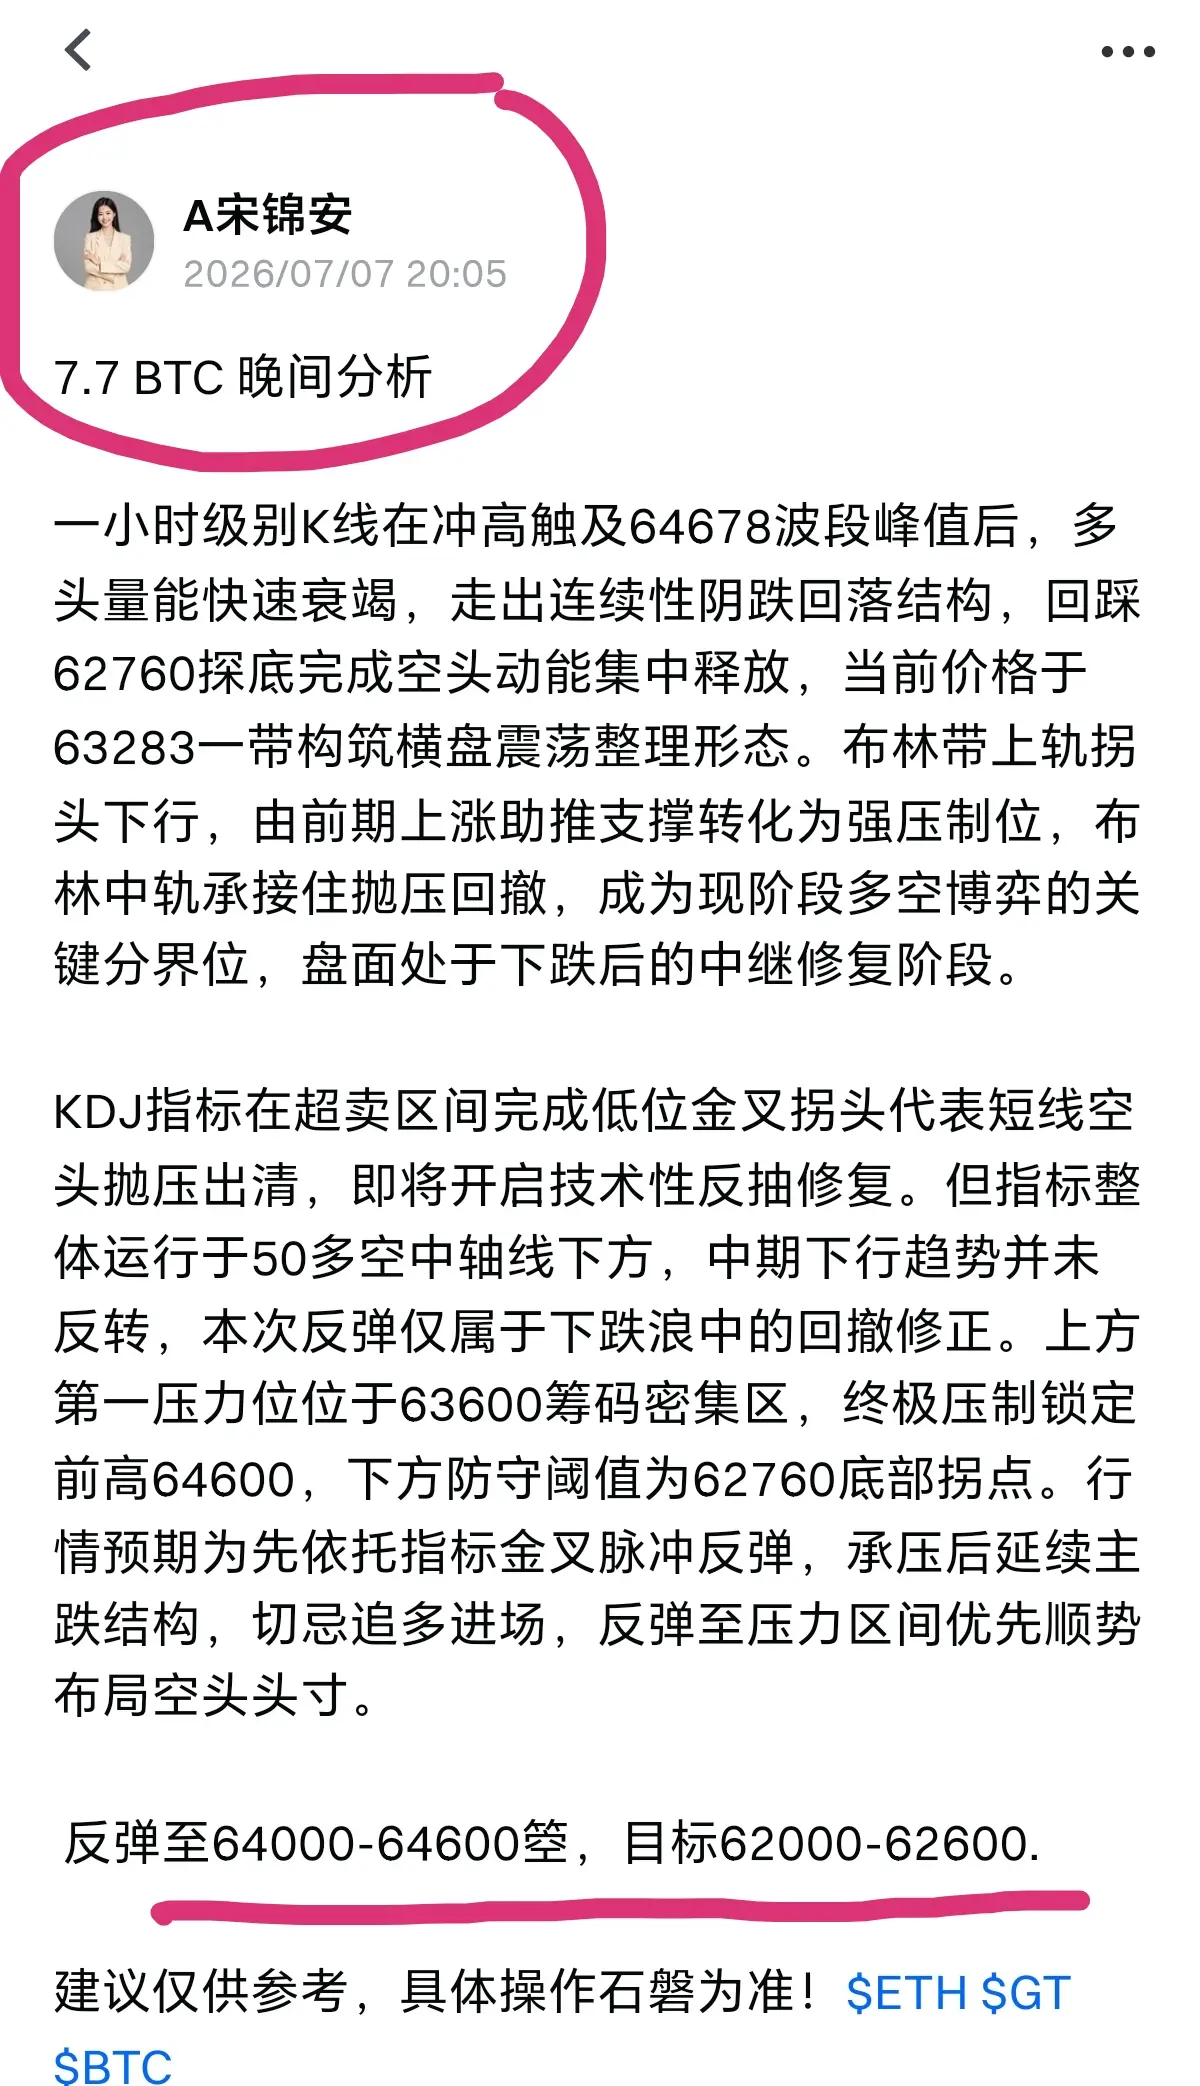
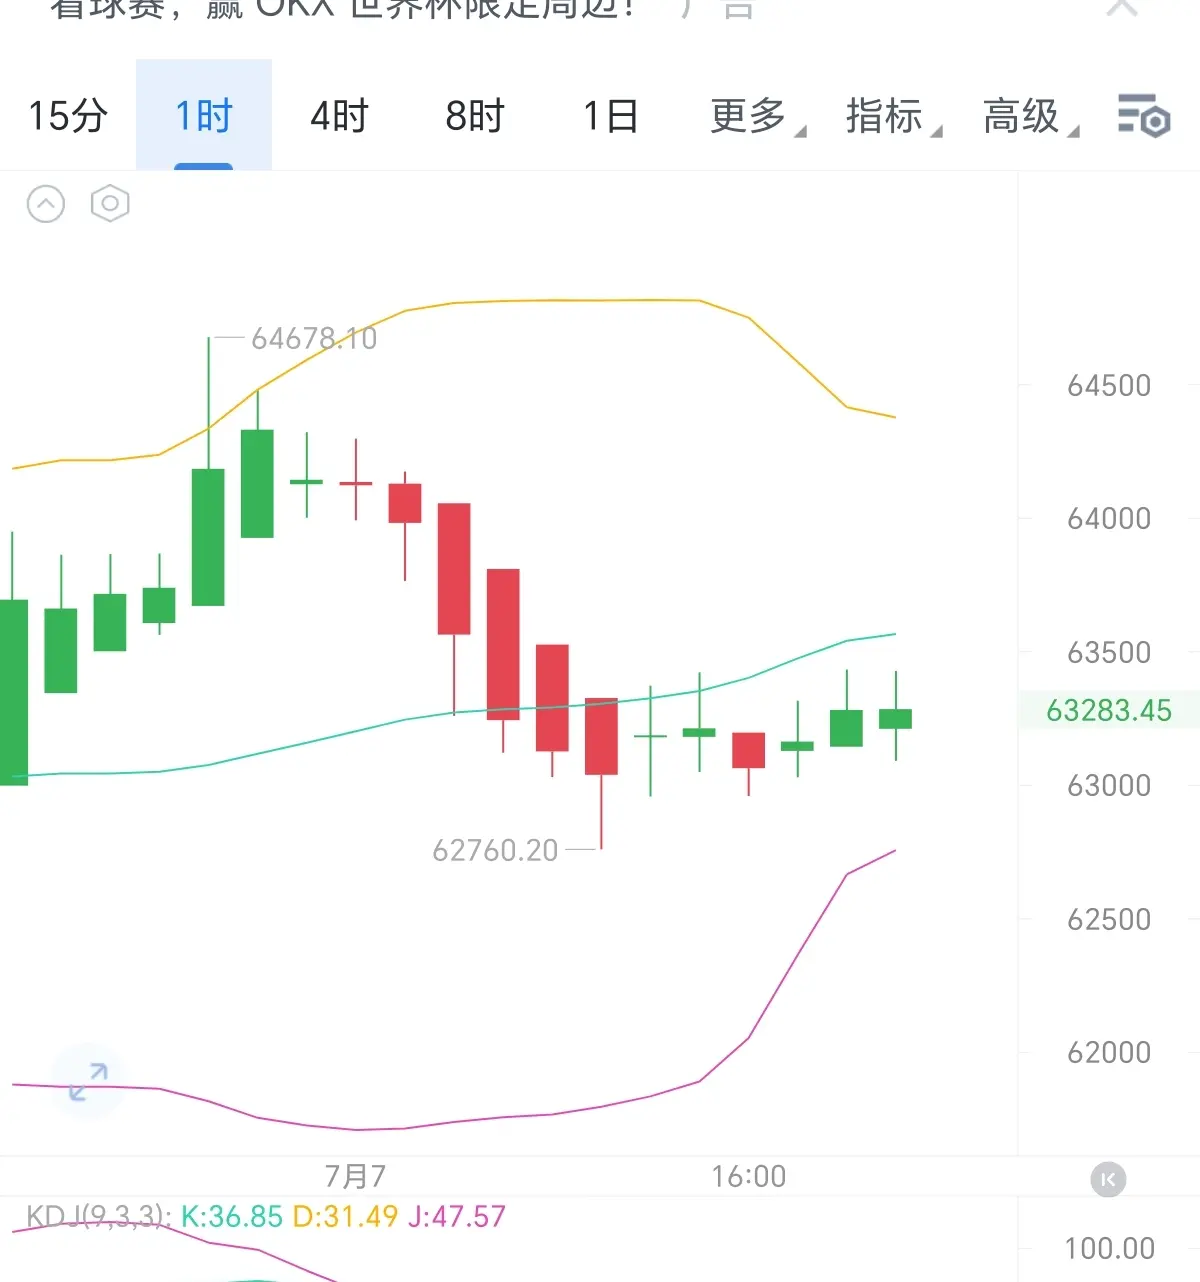
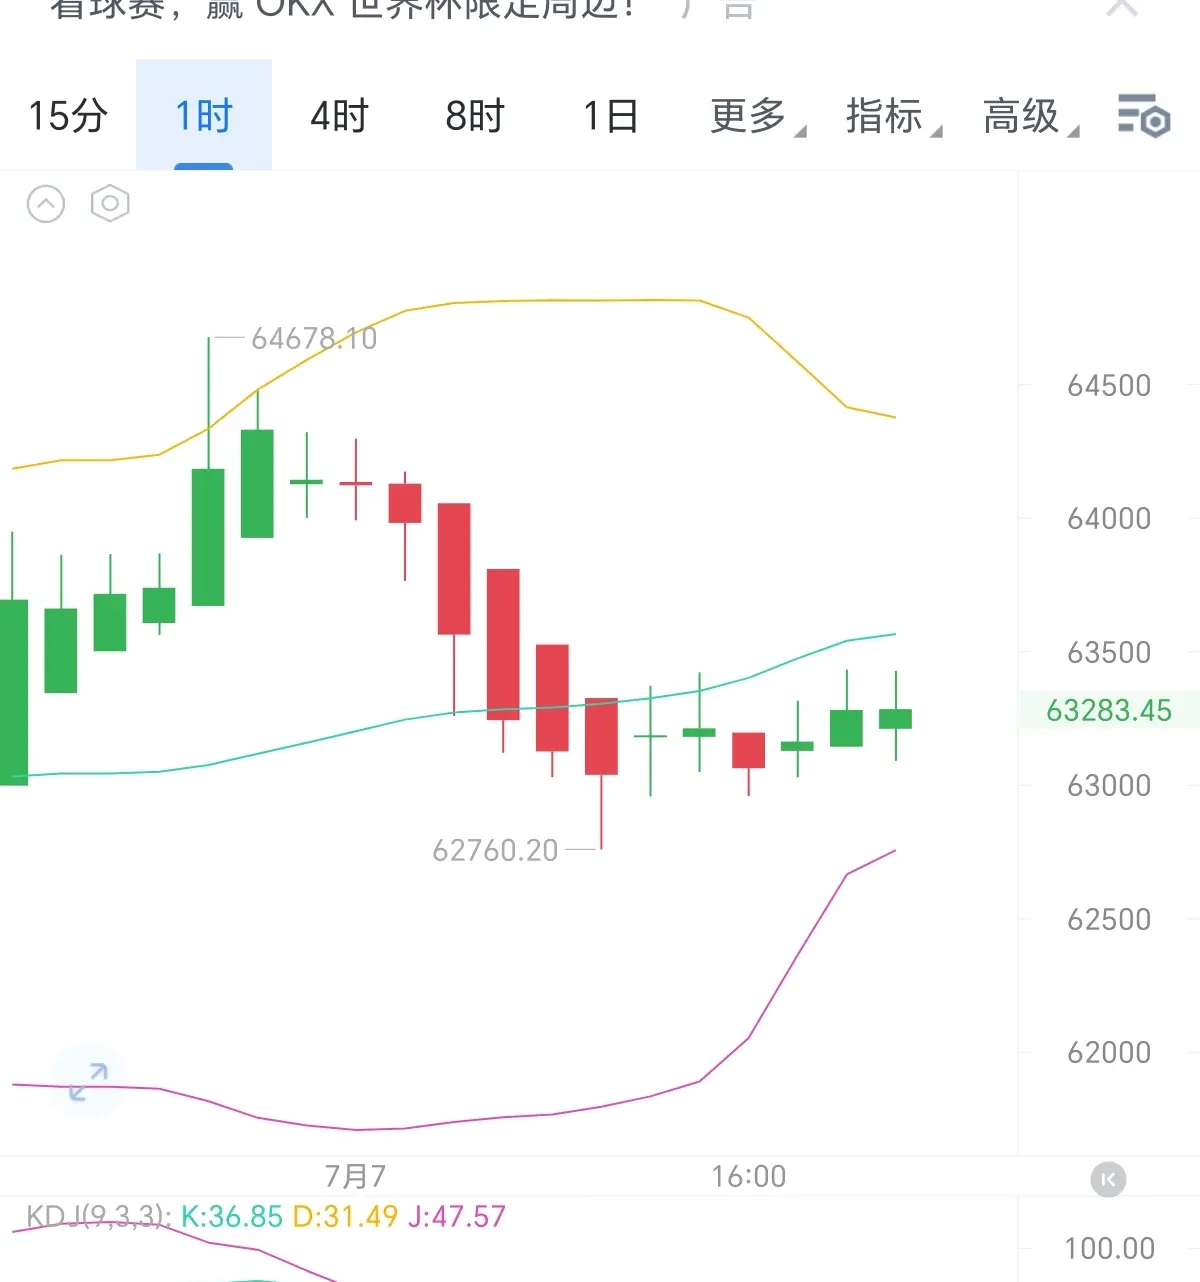
The hourly K-line, after surging to touch the band peak of 64678, saw a rapid decline in bullish momentum, forming a continuous bearish pullback structure. It retraced to 62760 to complete a concentrated release of bearish momentum. The current price is building a sideways consolidation pattern around 63283. The upper Bollinger Band has turned downward, transforming from a previous support that boosted the uptrend into a strong resistance level. The middle Bollinger Band has absorbed the selling pressure and pullback, becoming the key demarcation line for the current l
ETH1.06%
GT-0.14%
BTC1.74%
View Original
post-image
  • Reward
  • Comment
  • Repost
  • Share
7.7 BTC Evening Analysis
On the one-hour K-line, after surging to the band high of 64678, the bullish momentum quickly faded, forming a continuous bearish decline structure. The retracement to 62760 completed the concentrated release of bearish momentum, and the current price is building a horizontal consolidation pattern around 63283. The upper Bollinger Band has turned downward, shifting from a previous upward support to a strong resistance level, while the middle Bollinger Band has absorbed the selling pressure and become a key demarcation line for the current long-short battle. The market
ETH1.06%
GT-0.14%
SOL0.62%
View Original
post-image
  • Reward
  • Comment
  • Repost
  • Share
7.7 BTC Morning Analysis
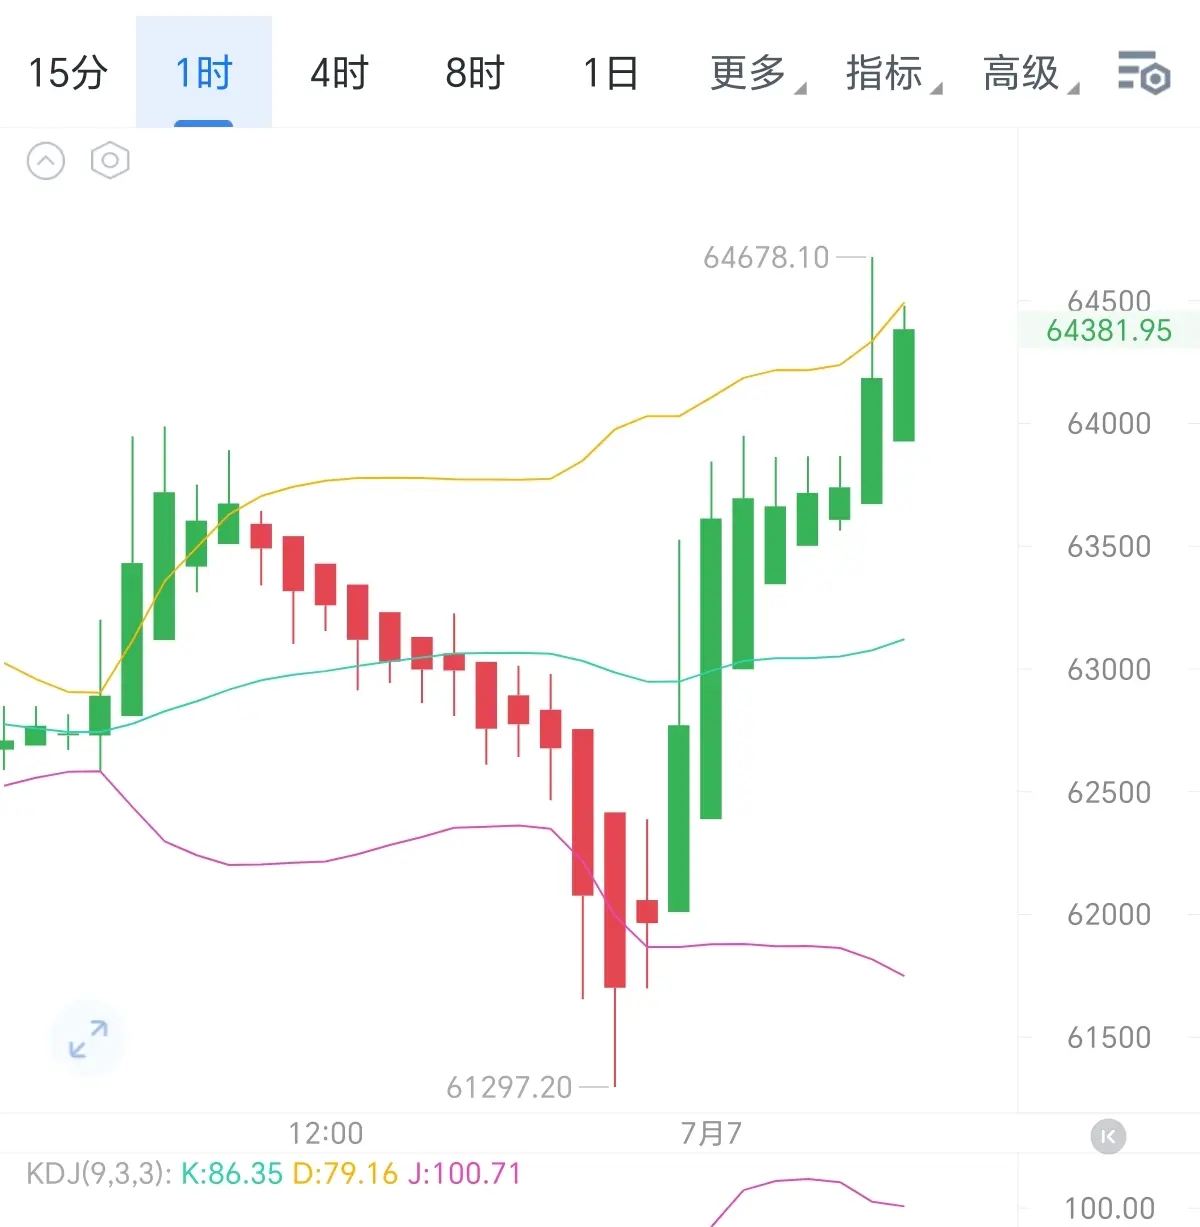
This week, BTC has formed a bottom-finding and rebound V-shaped reversal wave. The early drop to 61297 constructed the bear-trap-bottom divergence inflection point. Incremental buy-side orders entered the market, pushing the price higher step by step. It then unfolded in an impulsive upward move along the outer extension of the upper Bollinger Band, reaching a peak of 64678. After that, the upper band encountered pressure-induced passivation. The current candlestick has closed as a shooting-star-type pullback candle, indicating that the bullish push’s energy has entere
SOL0.62%
ETH1.06%
BTC1.74%
View Original
post-image
  • Reward
  • Comment
  • Repost
  • Share
7.6 ETH Analysis
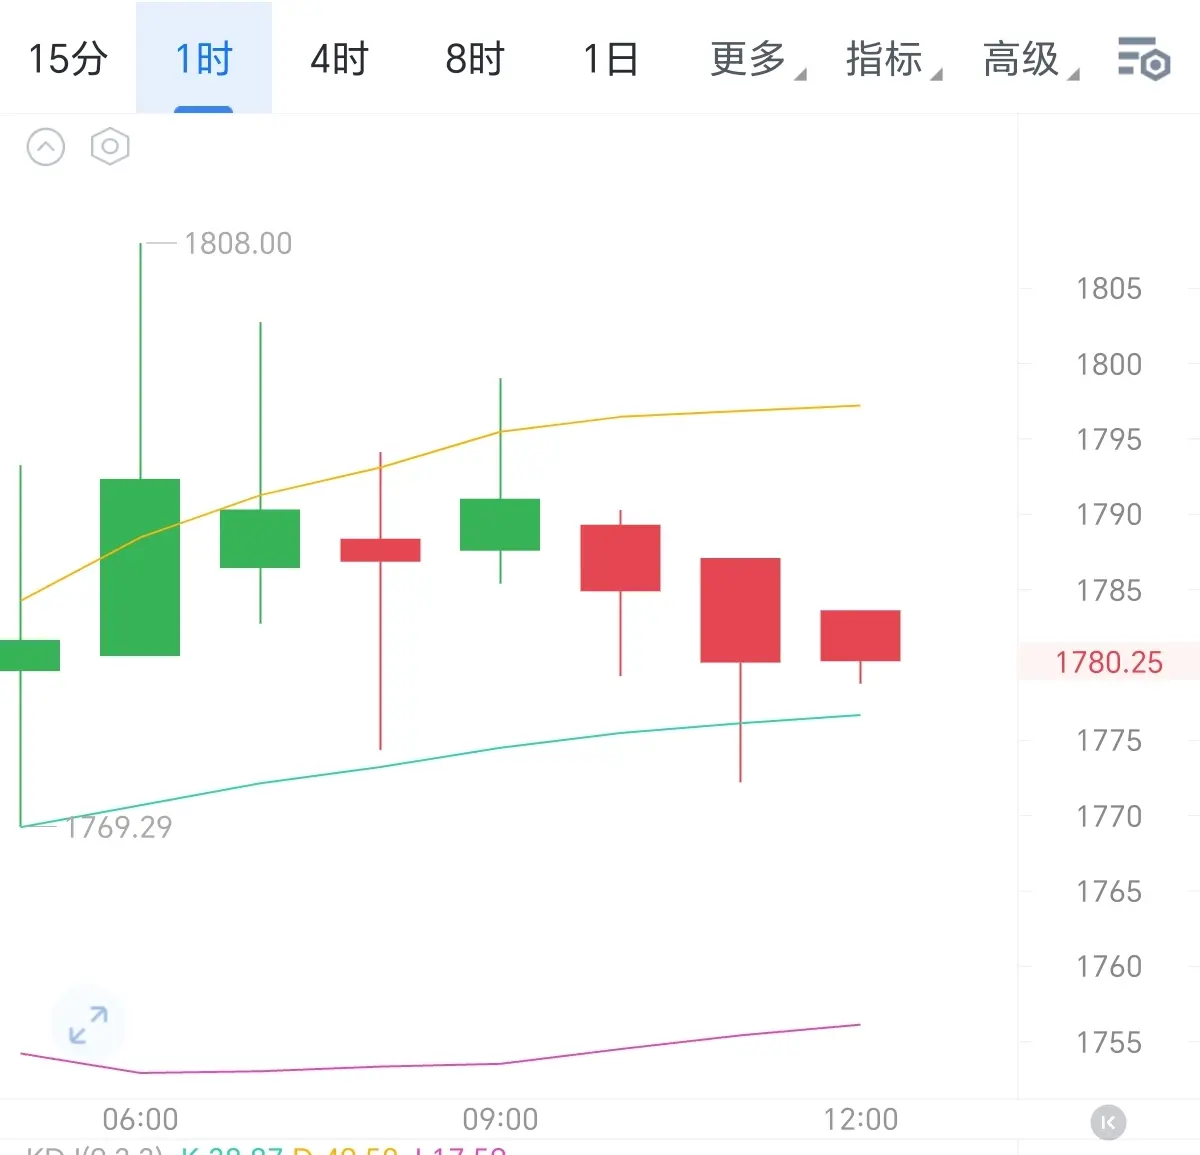
After the ETH hourly chart surged to a high of 1808, bullish momentum completely faded. Highs continued to move lower, forming a step-down decline pattern with consecutive bearish candles. Currently at 1780, the price is under pressure from the short-term yellow moving average, which has shifted from support to resistance. Only the mid-term moving average at 1775 provides short-term support. Multiple wicks probing lower indicate weak buying interest at the bottom, with extremely weak rebound strength. Structurally, the morning rally was a impulse move, lacking follow-up increm
BTC1.74%
GT-0.14%
SOL0.62%
View Original
post-image
  • Reward
  • 2
  • Repost
  • Share
CloudShadow666:
Can it reach 1650 next week?
View More
7.6 BTC Analysis
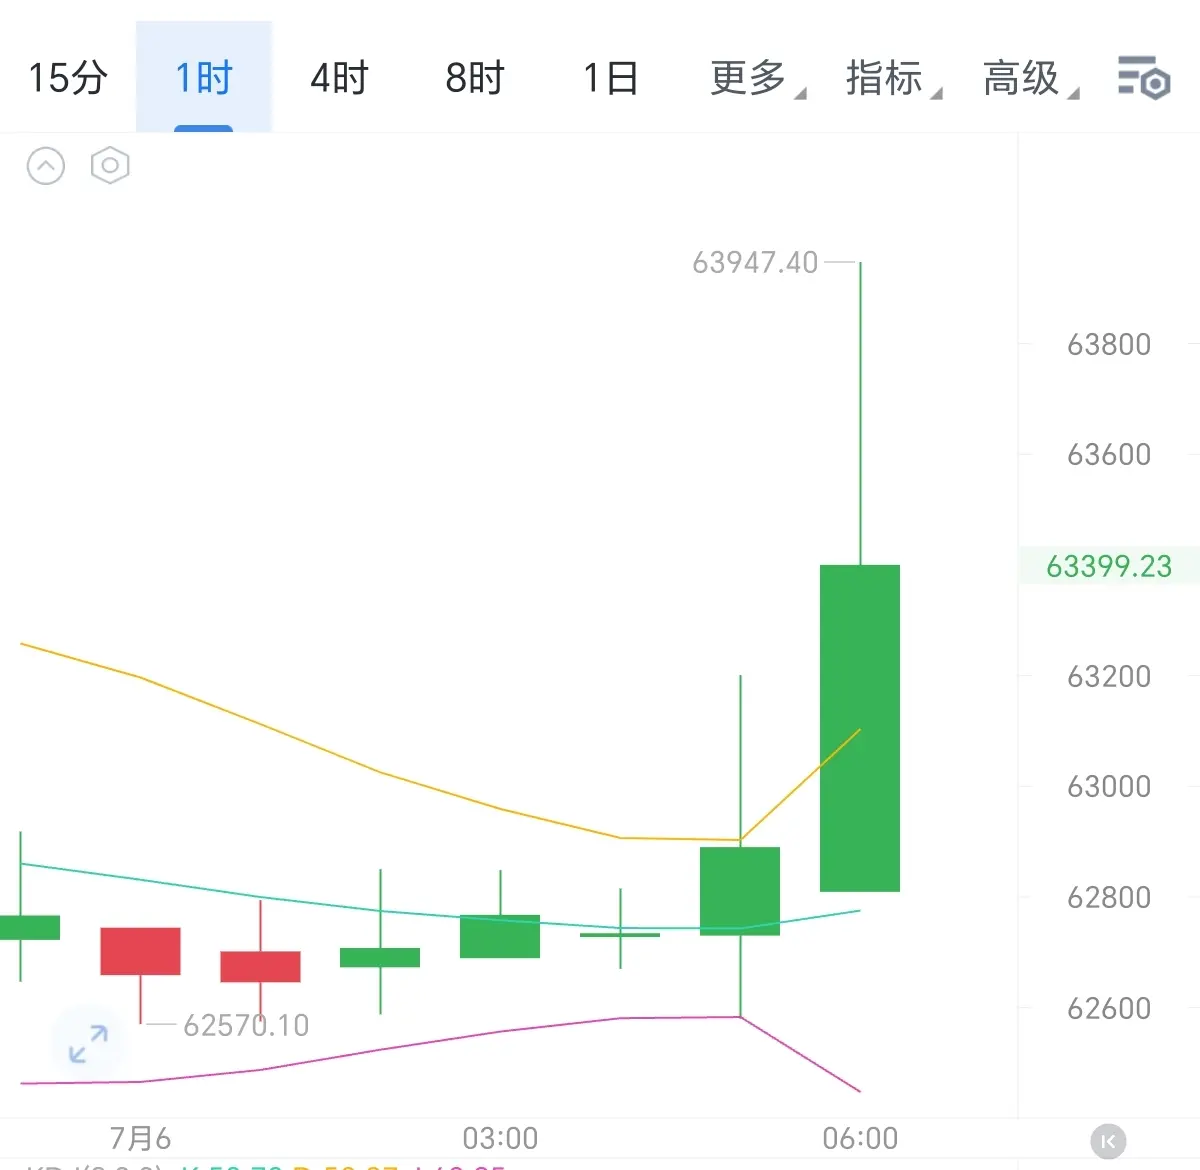
Hourly chart saw a large bullish candle with volume directly breaking through the prolonged consolidation range at 62800. The bullish impulse touched 63988, forming an upper shadow resistance structure. The core driving force of this upward move is the concentrated short-covering squeeze of leveraged shorts in the preceding range, combined with trend quantitative triggers activating long signals, and speculative off-market funds following in, creating triple buying resonance. Indicators have fully entered the heavily overbought zone, with RSI6 reaching 91.76, significantly bre
BTC1.74%
GT-0.14%
ETH1.06%
View Original
post-image
RON JON
RON JONRON JON
MC:$2.35KHolders:2
0.00%
  • Reward
  • Comment
  • Repost
  • Share
### 7.4 BTC Analysis
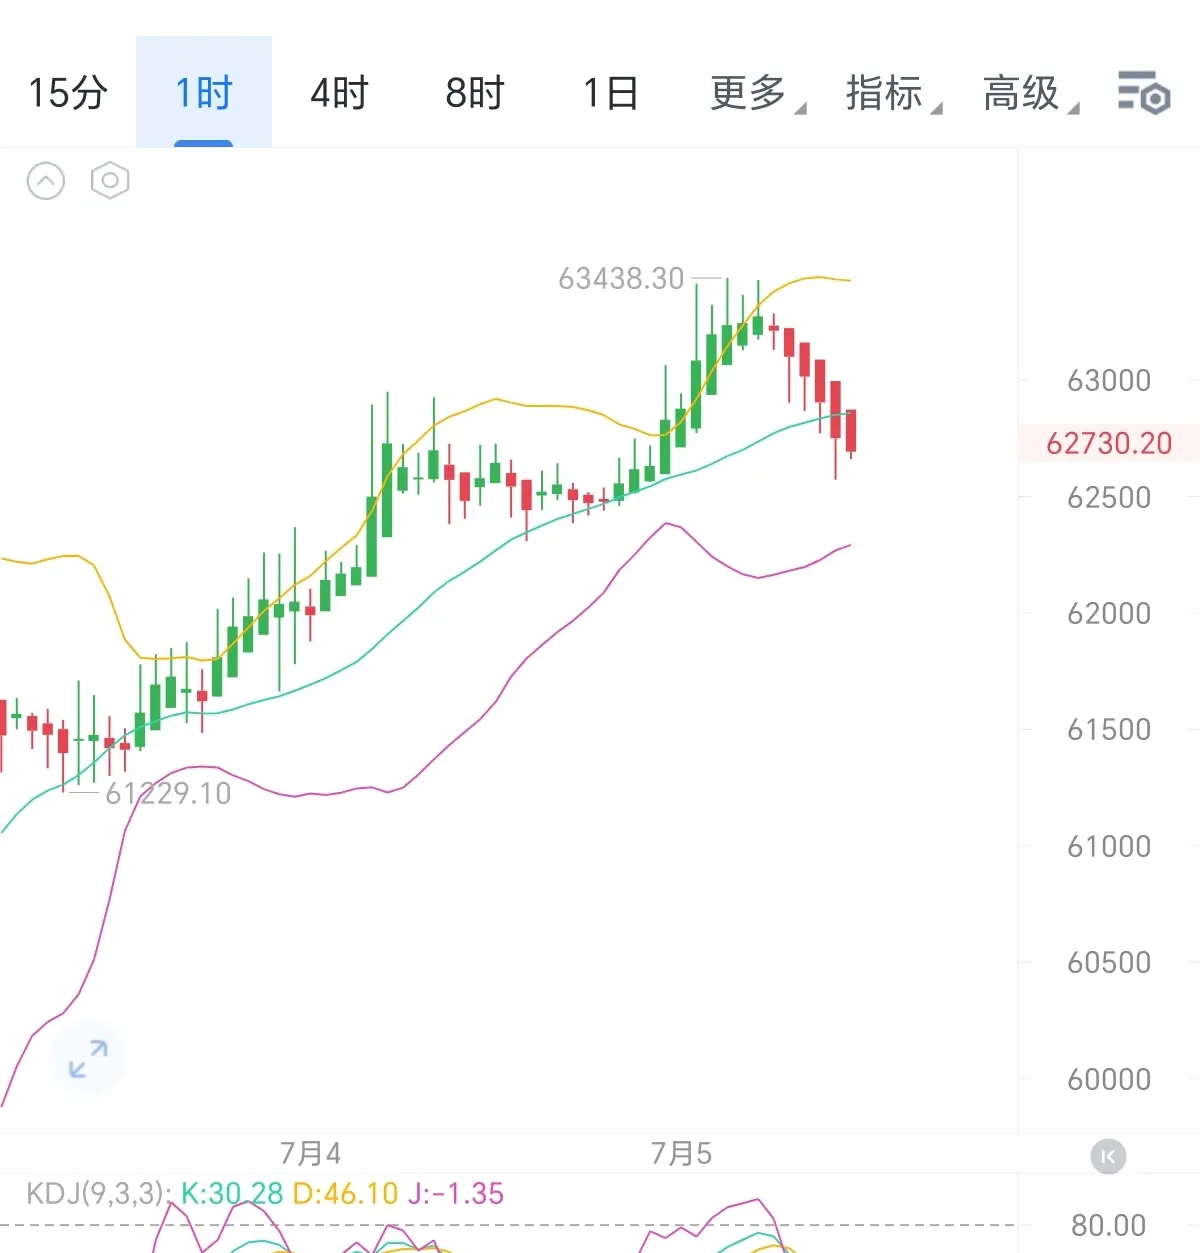
On the one-hour timeframe, BTC’s long-side bullish impulse is topping out and exhausting. After the 63438 peak forms an early-stage double-top pattern, price continues to drift lower under persistent downward pressure. The current price of 62730 has broken through the Bollinger Band midline center. The prior bullish defense threshold has flipped and turned into a selling-pressure holding zone. The upper Bollinger Band slope has turned downward, with convergence underway. The expansion cycle of the upward channel is completely over, and the unilateral bullish trend has ente
SOL0.62%
View Original
post-image
  • Reward
  • Comment
  • Repost
  • Share
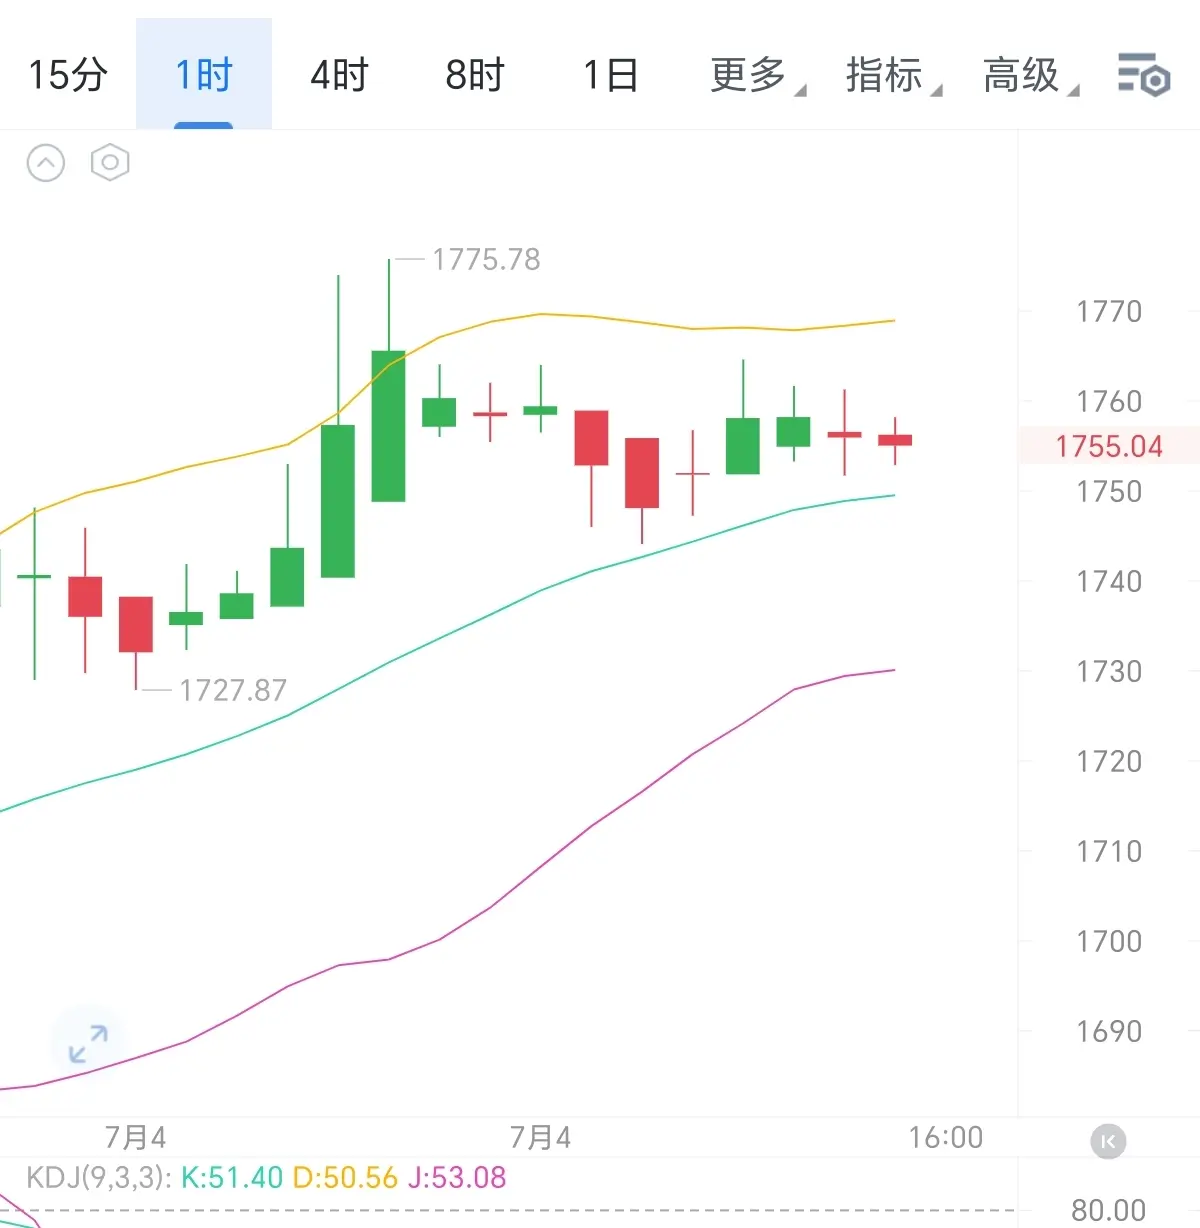
7.2 ETH Analysis
On the hourly chart, the Bollinger Bands overall maintain a bullish upward channel: the lower band continues to rise steadily. After a prior spike to 1775, the price pulled back and moved sideways above the middle band. The upper band flattens, forming a short-term pressure band. The underlying basis of the bullish trend is still present, but upside momentum has clearly weakened. The accompanying KDJ three lines are sticking together and winding around each other; the values are all in the mid-range, with no clear bullish or bearish divergence signal. This is a phase of post-r
ETH1.06%
View Original
post-image
GPC
GPCGPC TOKEN
MC:$2.31KHolders:1
0.00%
  • Reward
  • Comment
  • Repost
  • Share
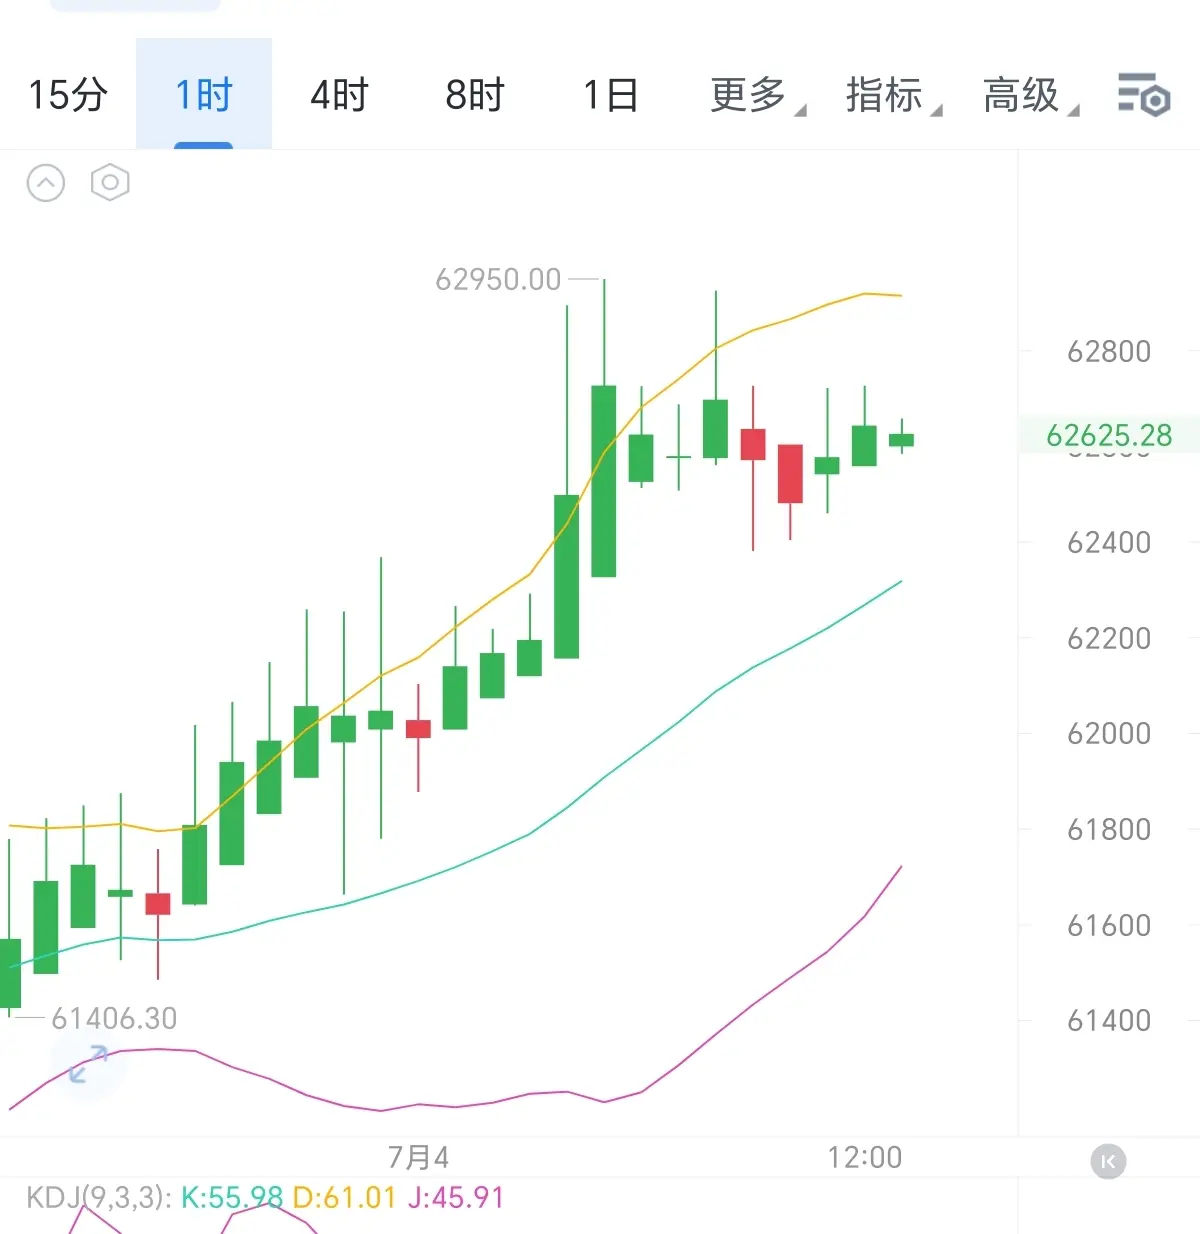
7.4 BTC Analysis
On the hourly cycle, the moving averages show a healthy bullish divergence and the short- and long-cost tracks are rising in sync. Since the market started its rally from 61406, it has pushed to 62950 and met resistance; bullish momentum has weakened in stages. Repair-and-pullback candlesticks have emerged. The current price is holding above the short-term cost track, and the main upward trend has not been broken.
At the high, resistance was marked by a “shooting” pressure-type candlestick. Then, the next two bearish candles completed digesting the rise. The current candlestic
BTC1.74%
GT-0.14%
ETH1.06%
View Original
post-image
  • Reward
  • Comment
  • Repost
  • Share
  • Pinned