CcChenYifan

vip
Diamond Hands
Market Analyst
Futures Trading Strategist
Official partner analyst, long-term returns, just passing by, feel free to follow. Focused for 11 years, mainstream coin precise strategies updated daily in real-time.
Pin
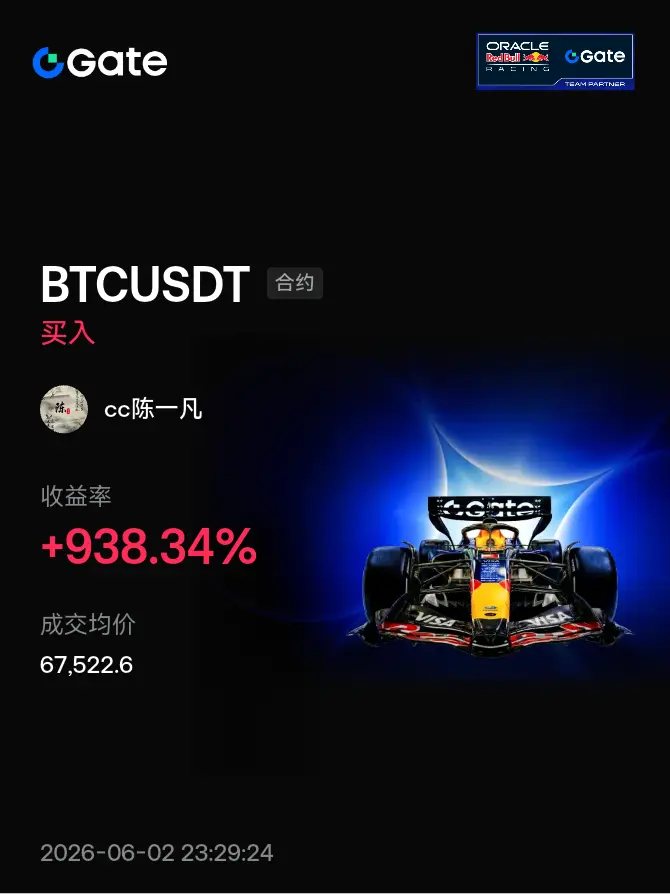
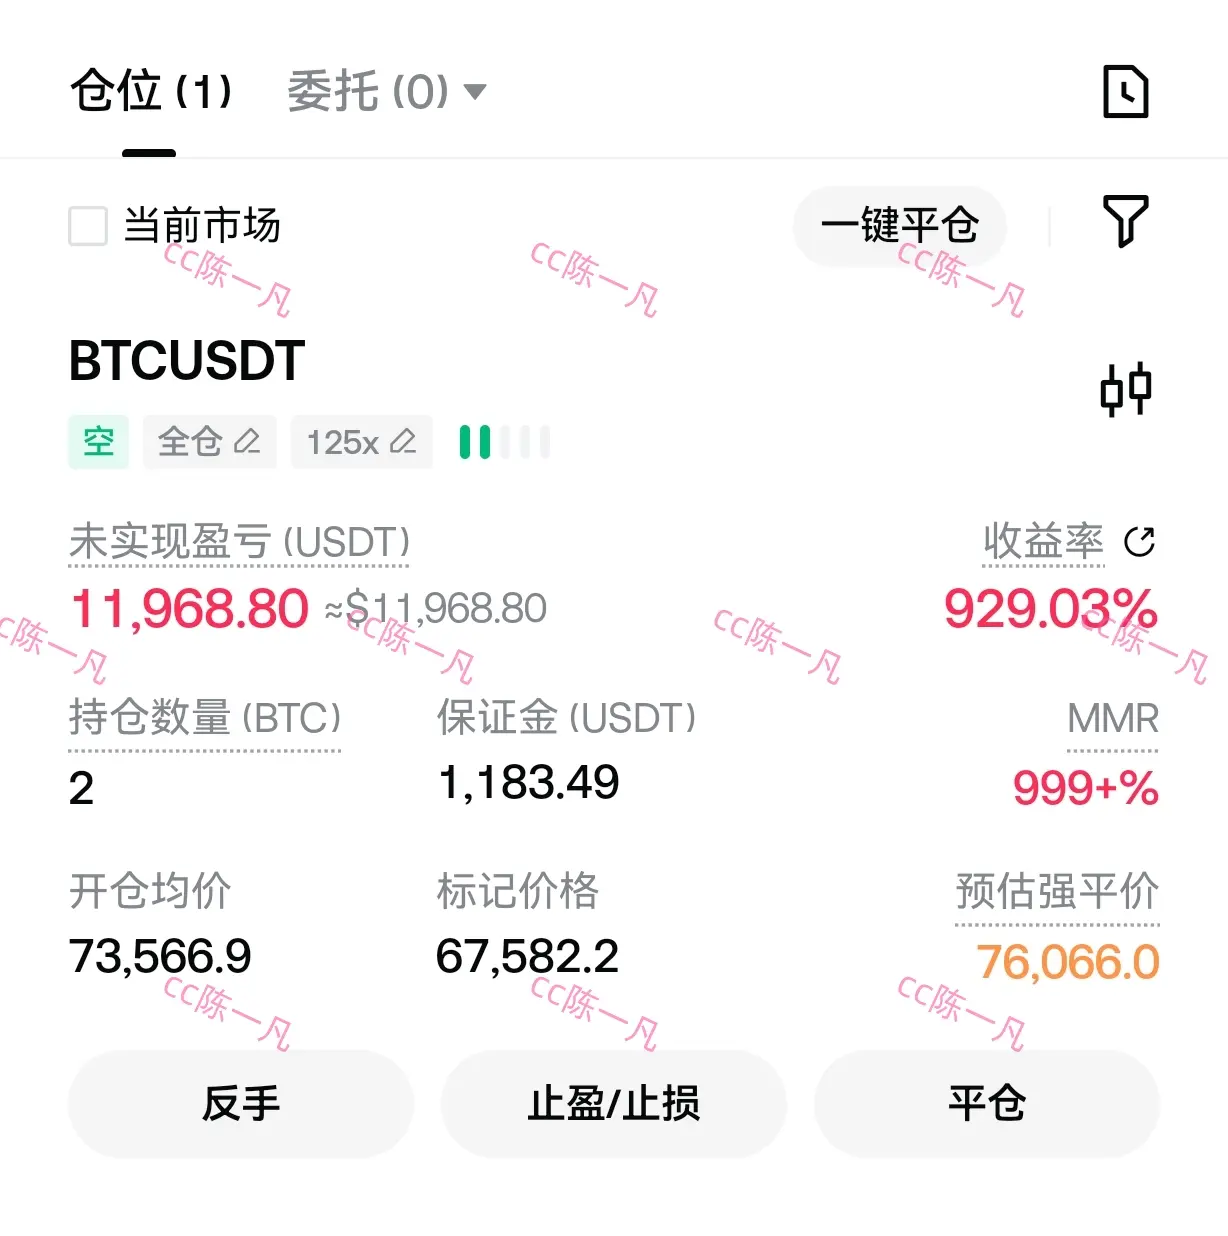
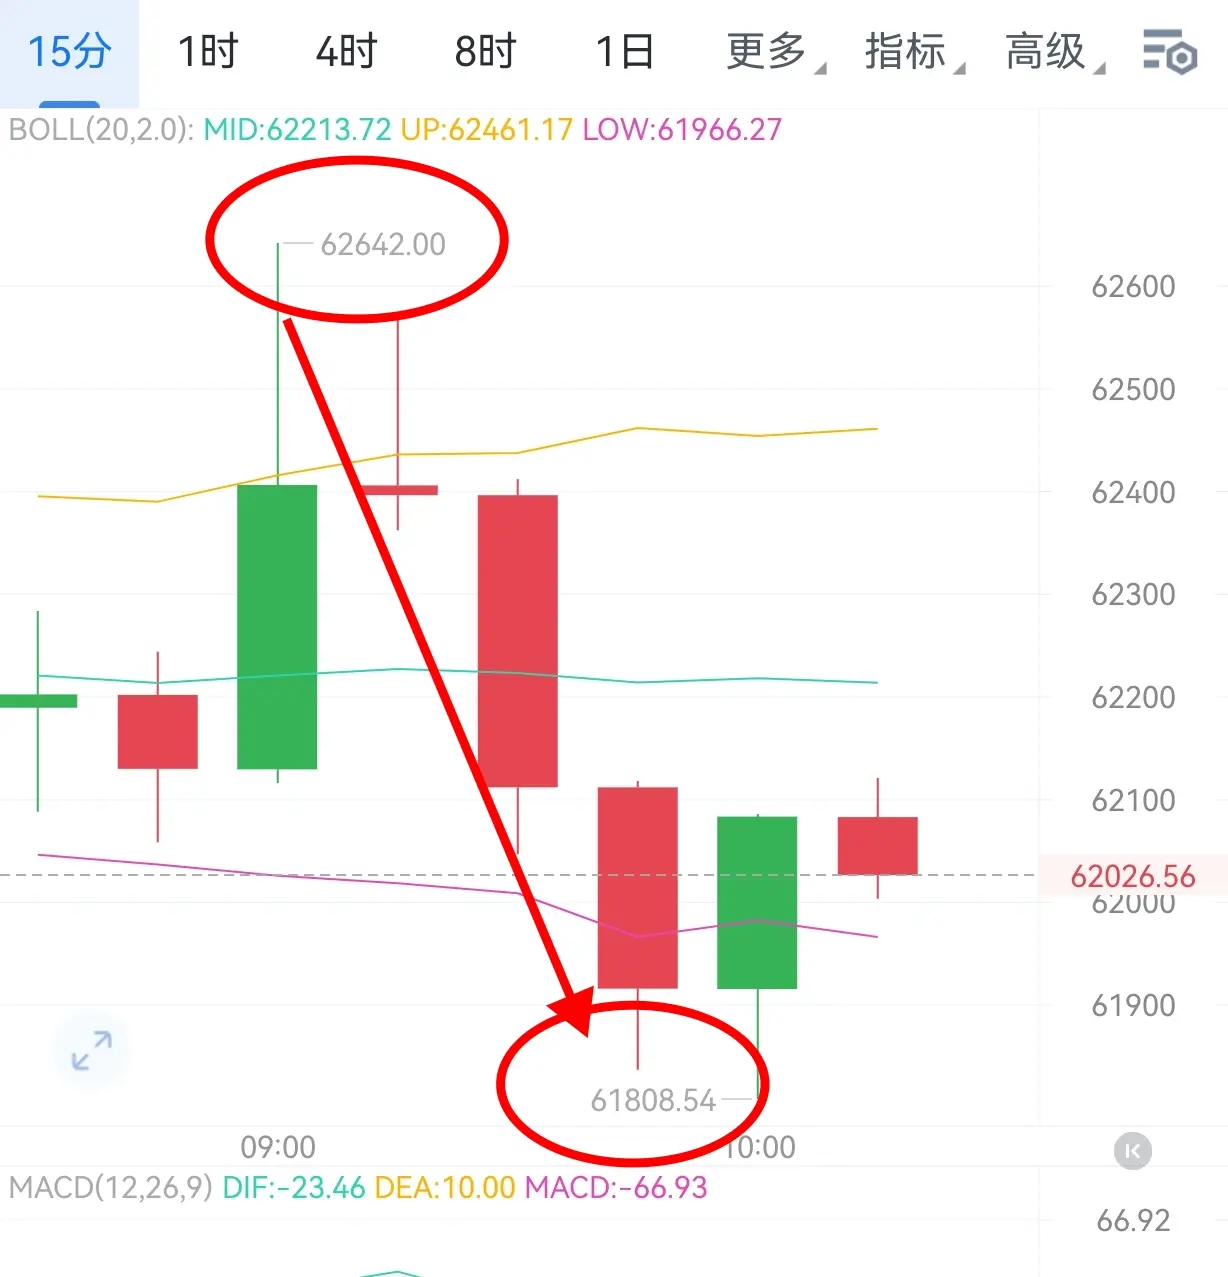
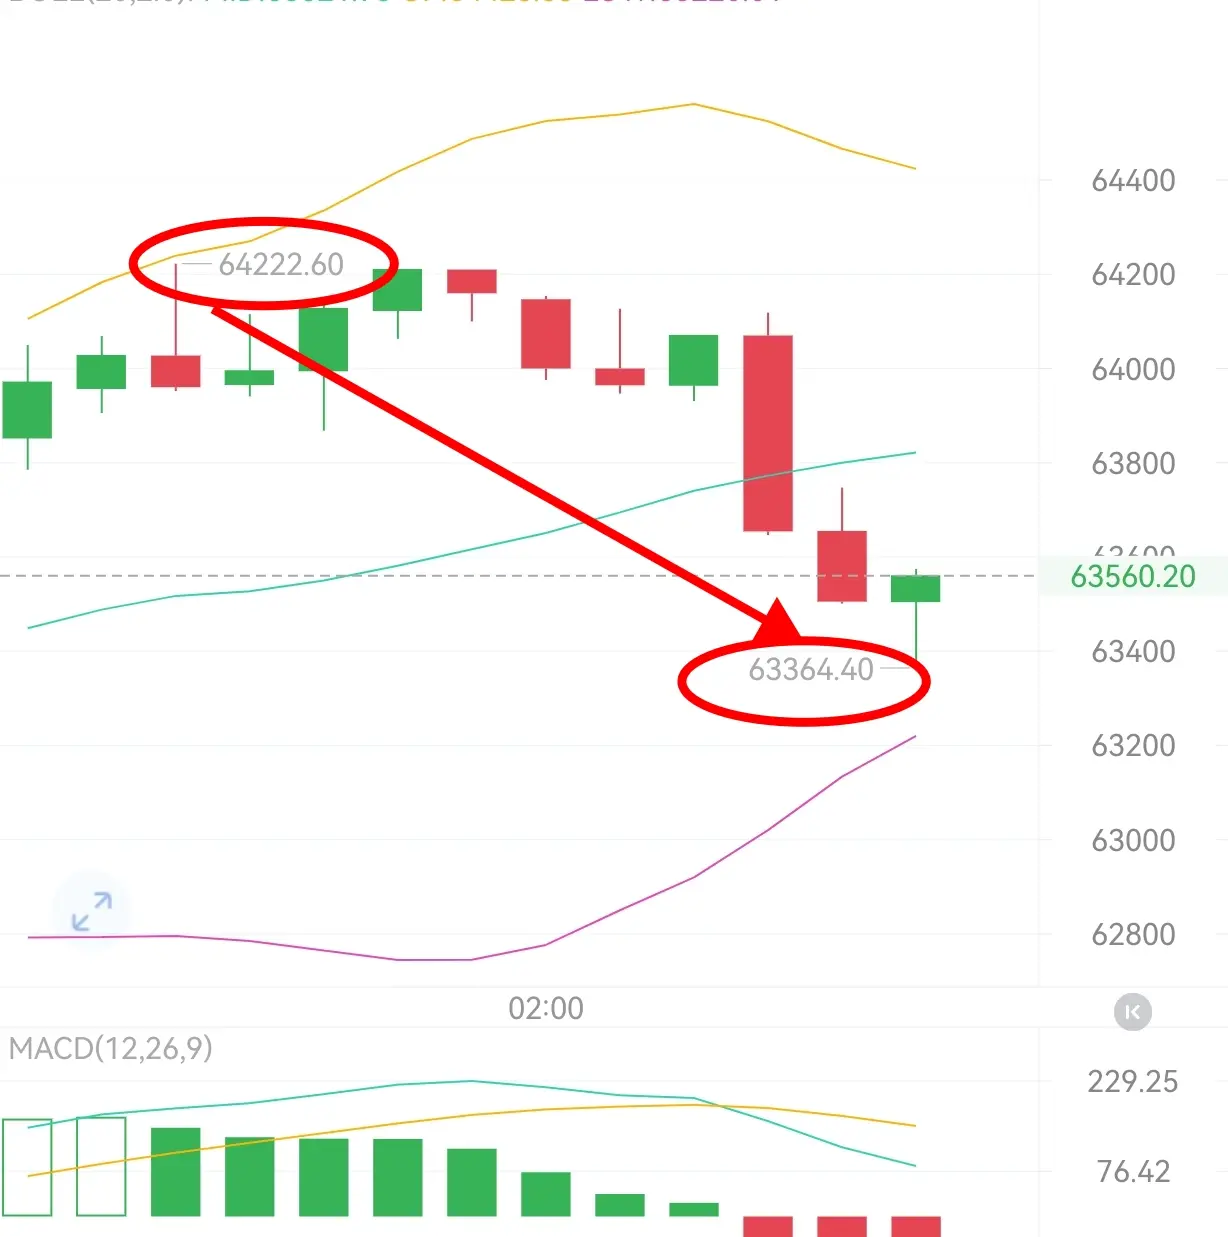
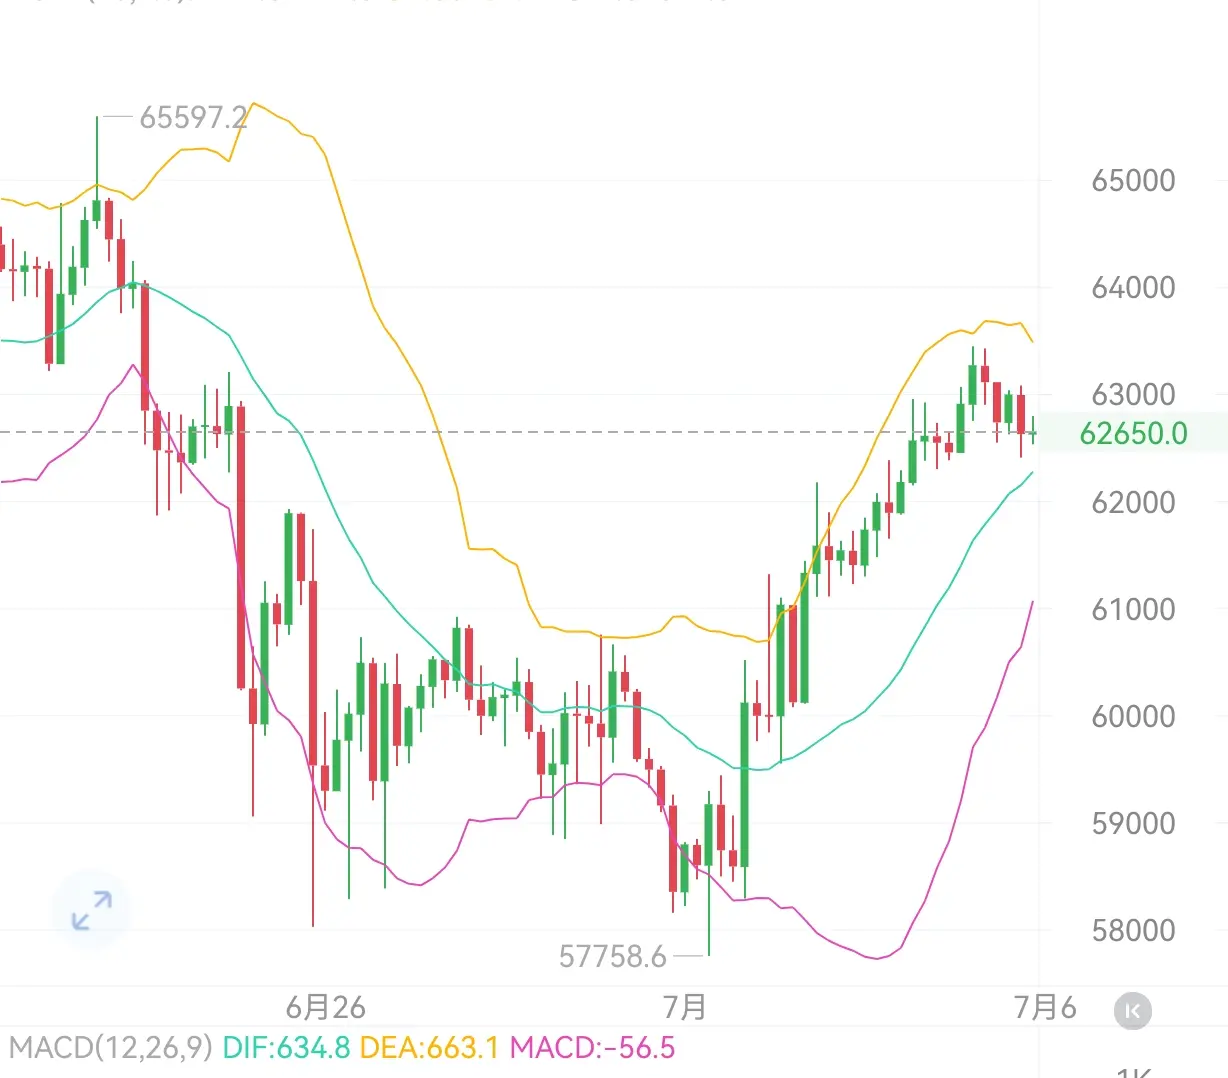
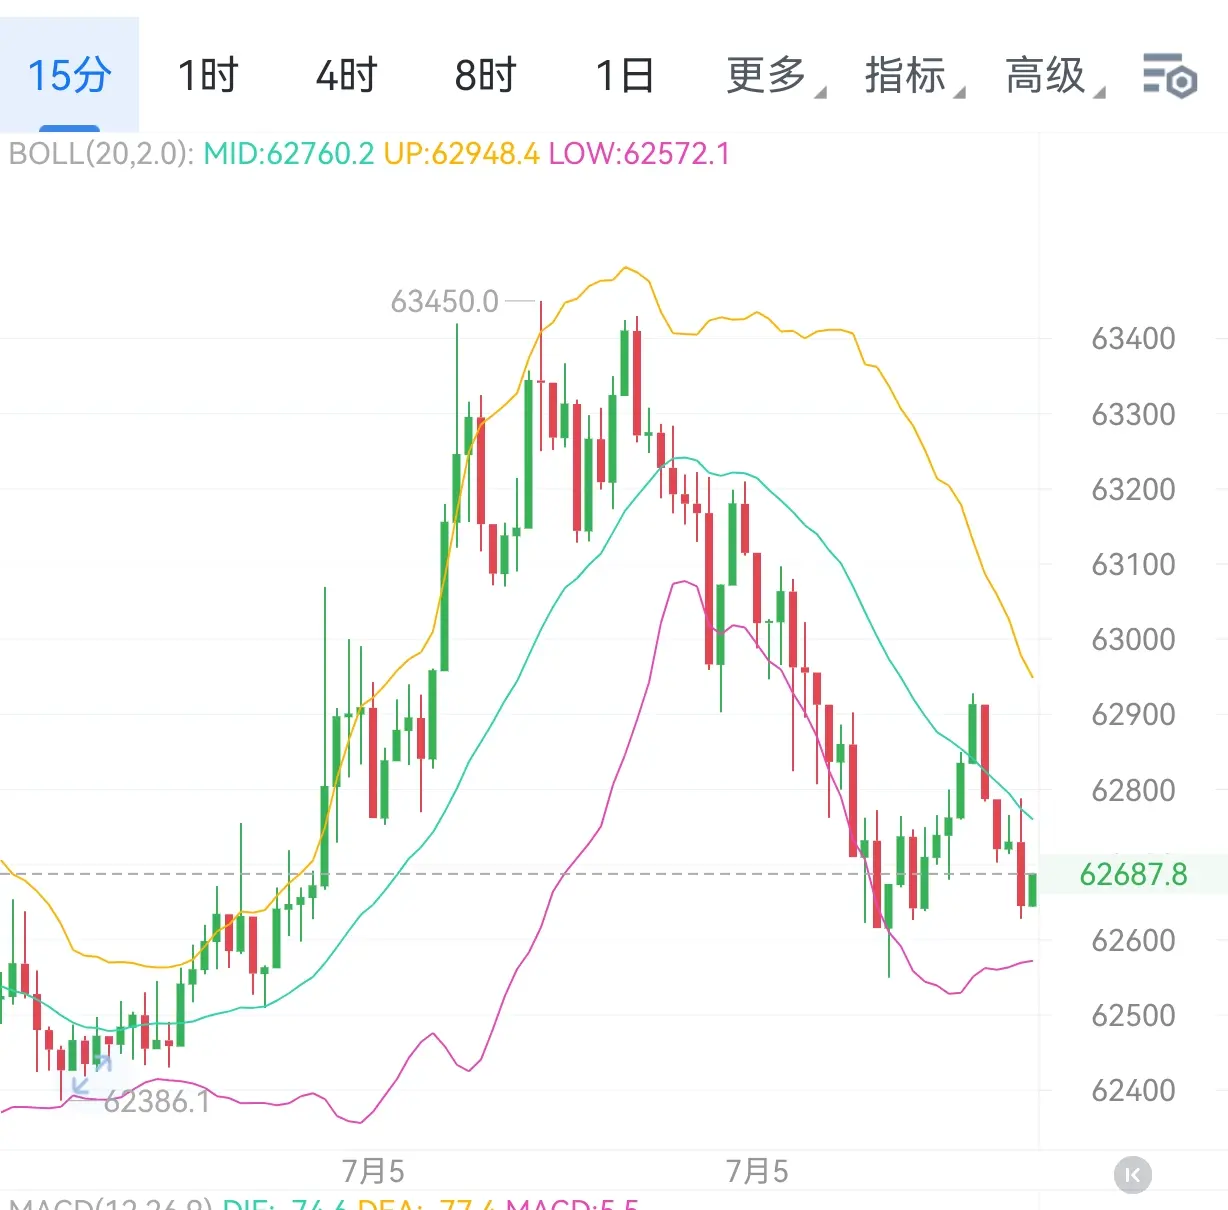
#晒出我的合约收益#Go all-in directly, take profits and secure your gains, remind everyone every day that a rebound is just a fake, is it really a fake #BTC #ETH
BTC2.24%
ETH1.52%
View Original
post-image
post-image
  • Reward
  • 2
  • Repost
  • Share
Lotte'sLittleSidekick:
Thank you, teacher.
View More
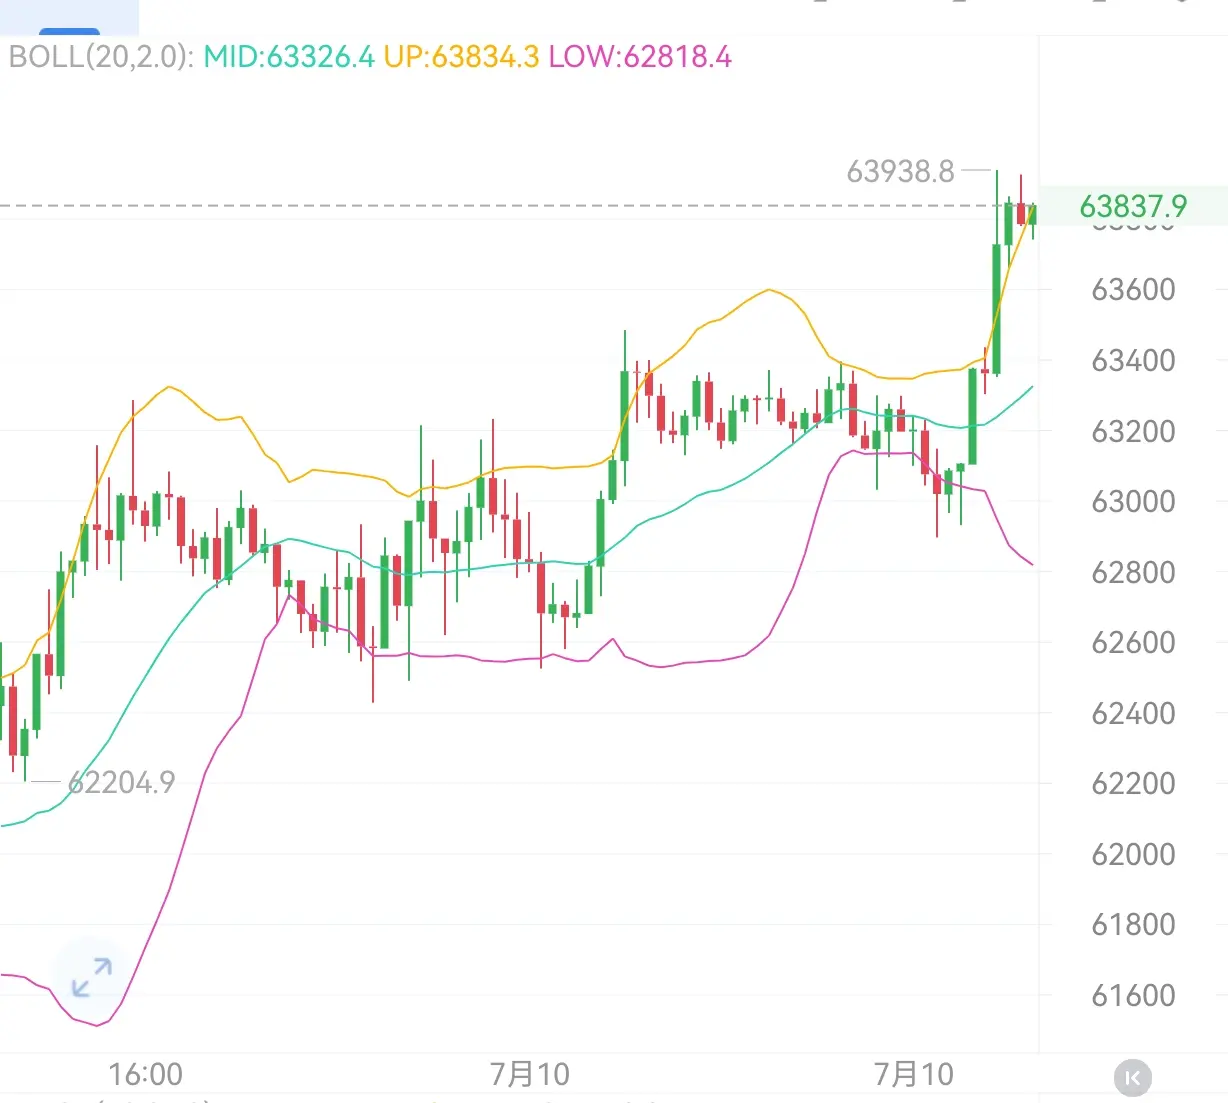
7.10 Morning Analysis
Track three-line values: Middle track 62973.0, Upper track 64255.9, Lower track 61690.0
The price quickly surged in the short term and is running tightly along the upper Bollinger Band. The upper Bollinger Band is a strong resistance zone. The channel’s track/rail rules determine this: after the price stays close to the upper band for a long time, there is an extremely high probability of a technical pullback and a price retracement correction back toward the middle track. Once the price comes under pressure and breaks below the upper band support, the target for the
BTC2.23%
ETH1.52%
View Original
post-image
  • Reward
  • Comment
  • Repost
  • Share
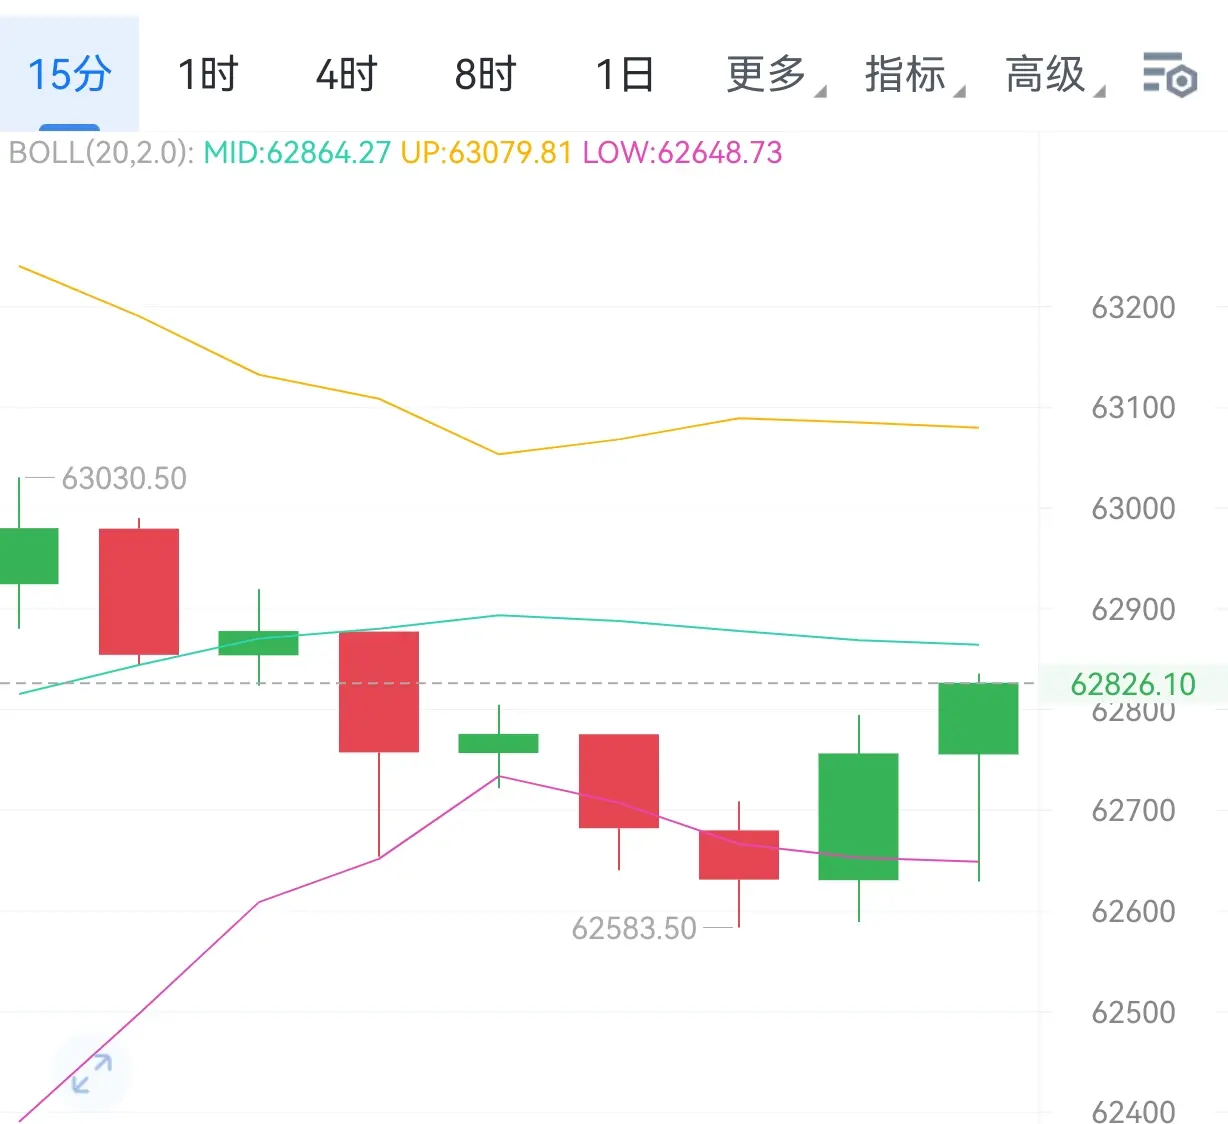
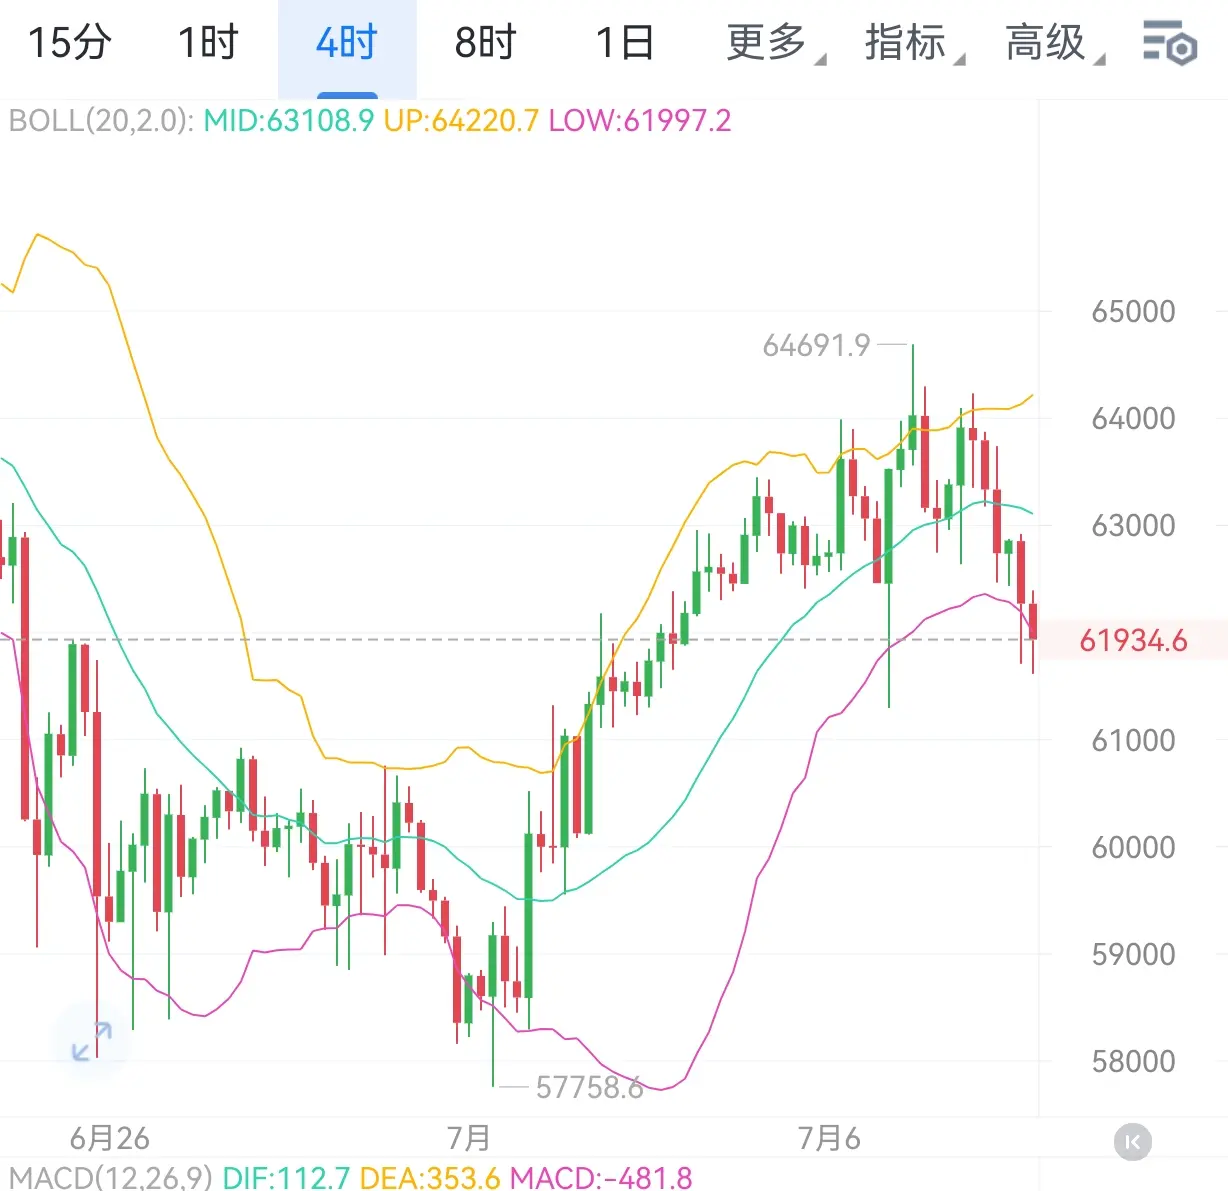
Evening analysis on July 9
The bearish trend framework on the 4-hour level has not yet been reversed; the shrinking bearish bars indicate that selling pressure at lows has somewhat eased, giving rise to the current rebound recovery. However, the difference between the two moving averages remains large, and the overall bearish momentum still holds an advantage. This rebound is more of a technical retracement within the downtrend, and no signal for a reversal to strength has been established yet. After the previous rally to a stage high of 63,259.50, the price began to decline. Today, it dipped
BTC2.23%
ETH1.52%
View Original
post-image
  • Reward
  • Comment
  • Repost
  • Share
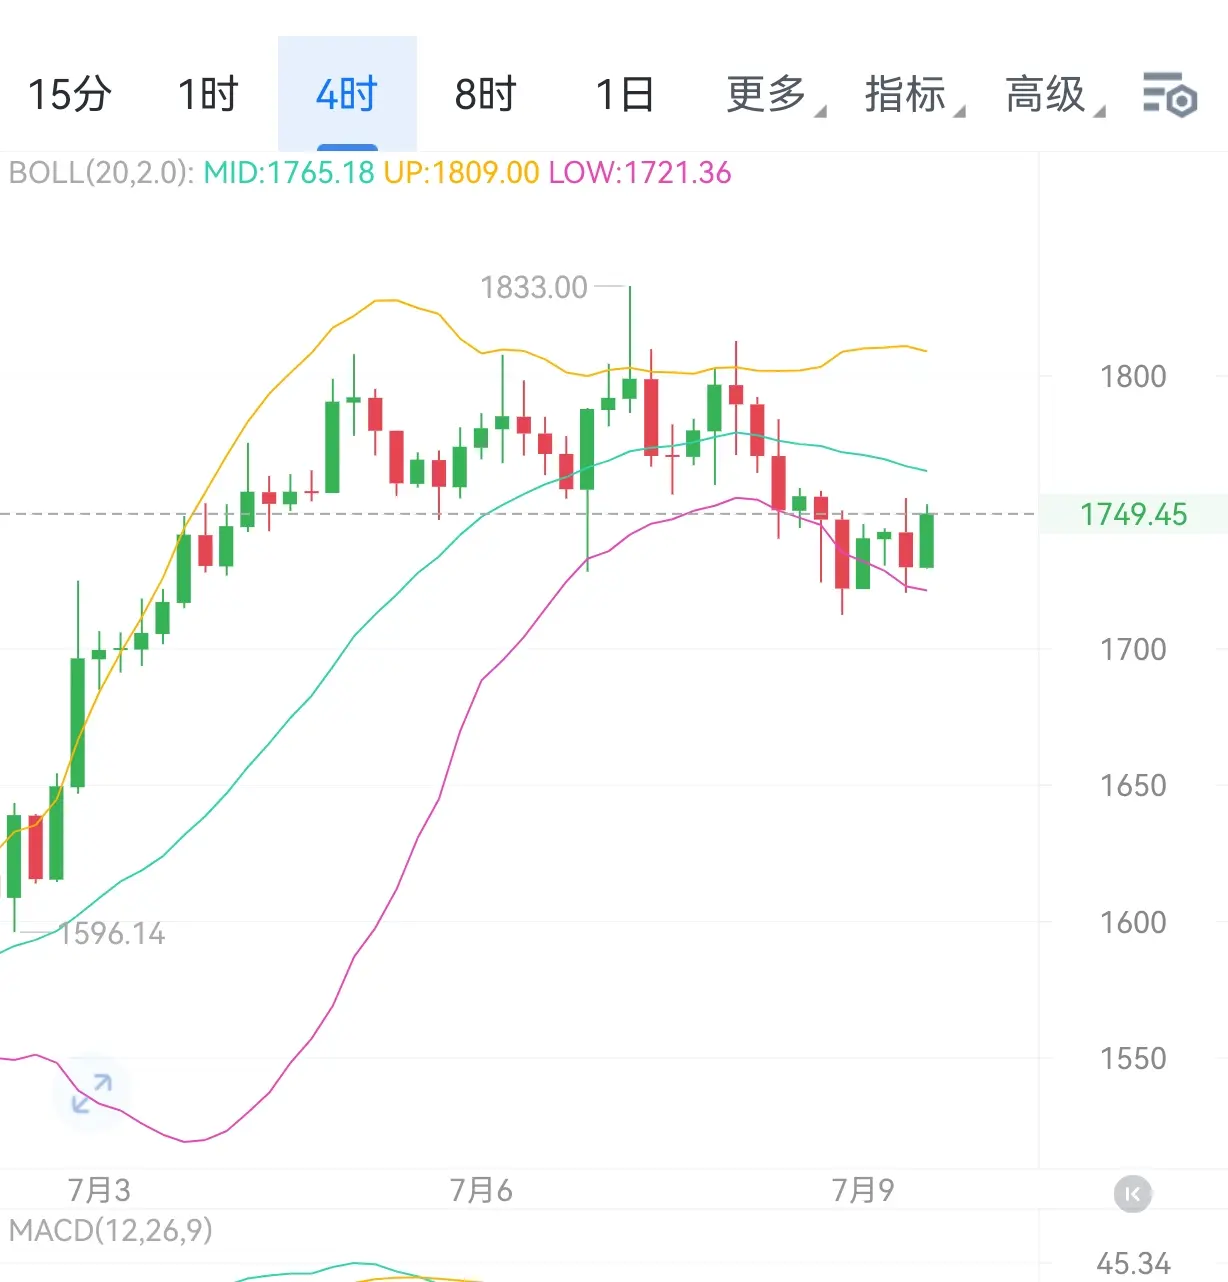
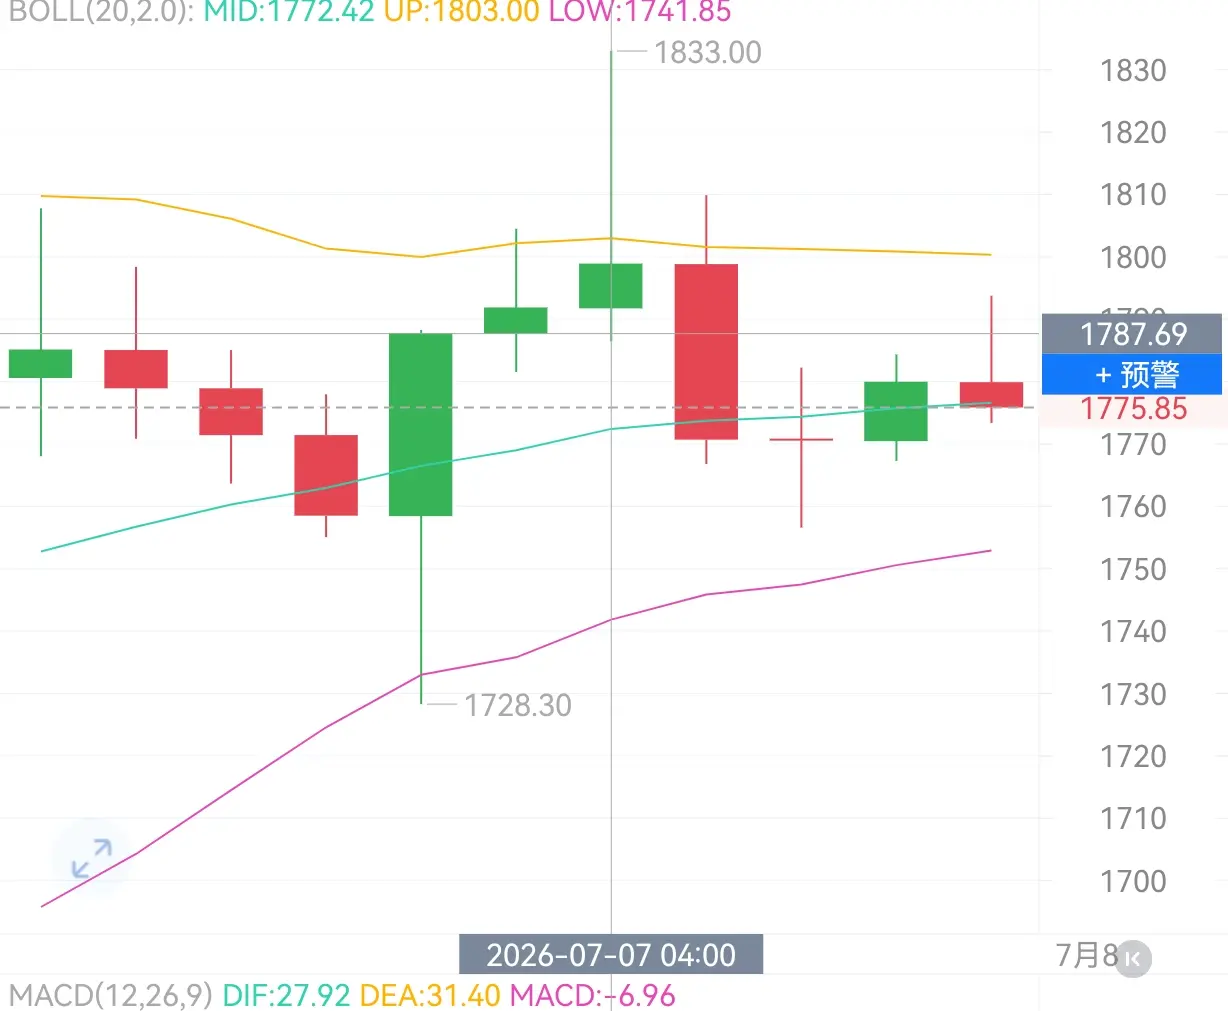
July 9 $ETH afternoon analysis
Bollinger Band three rails values: mid rail 1765.01, upper rail 1809.10, lower rail 1720.91
The current price is located below the Bollinger mid rail. The mid rail has completed its attribute switch—from a support level in prior market conditions to the primary short-term pressure at the current stage. There is still downside buffer space before the Bollinger lower rail; 1720.91 is the key nearby support for this cycle. Only if the price body stands above the Bollinger mid rail will the bulls have the conditions to initiate a rebound to test the upper high;
ETH1.52%
View Original
post-image
post-image
  • Reward
  • 1
  • Repost
  • Share
LikeMaple:
Can it reach 1700?
**Thursday Morning Analysis, July 9**
Yesterday I reminded everyone not to rush into short positions. Today, the short entry level has been reached, above 62,500. Not sure how many of you caught this wave. After surging to the stage high of 64,700, this round of the market faced resistance and pulled back, forming multiple consecutive bearish candlesticks. The highs have been gradually lowering, producing a standard phased pullback structure.
**Indicator readings:** DIF = -55.85, DEA = 172.54, MACD bearish bar reading = -456.78, with the green bar volume continuing to expand.
DIF has crossed b
BTC2.24%
View Original
post-image
  • Reward
  • Comment
  • Repost
  • Share
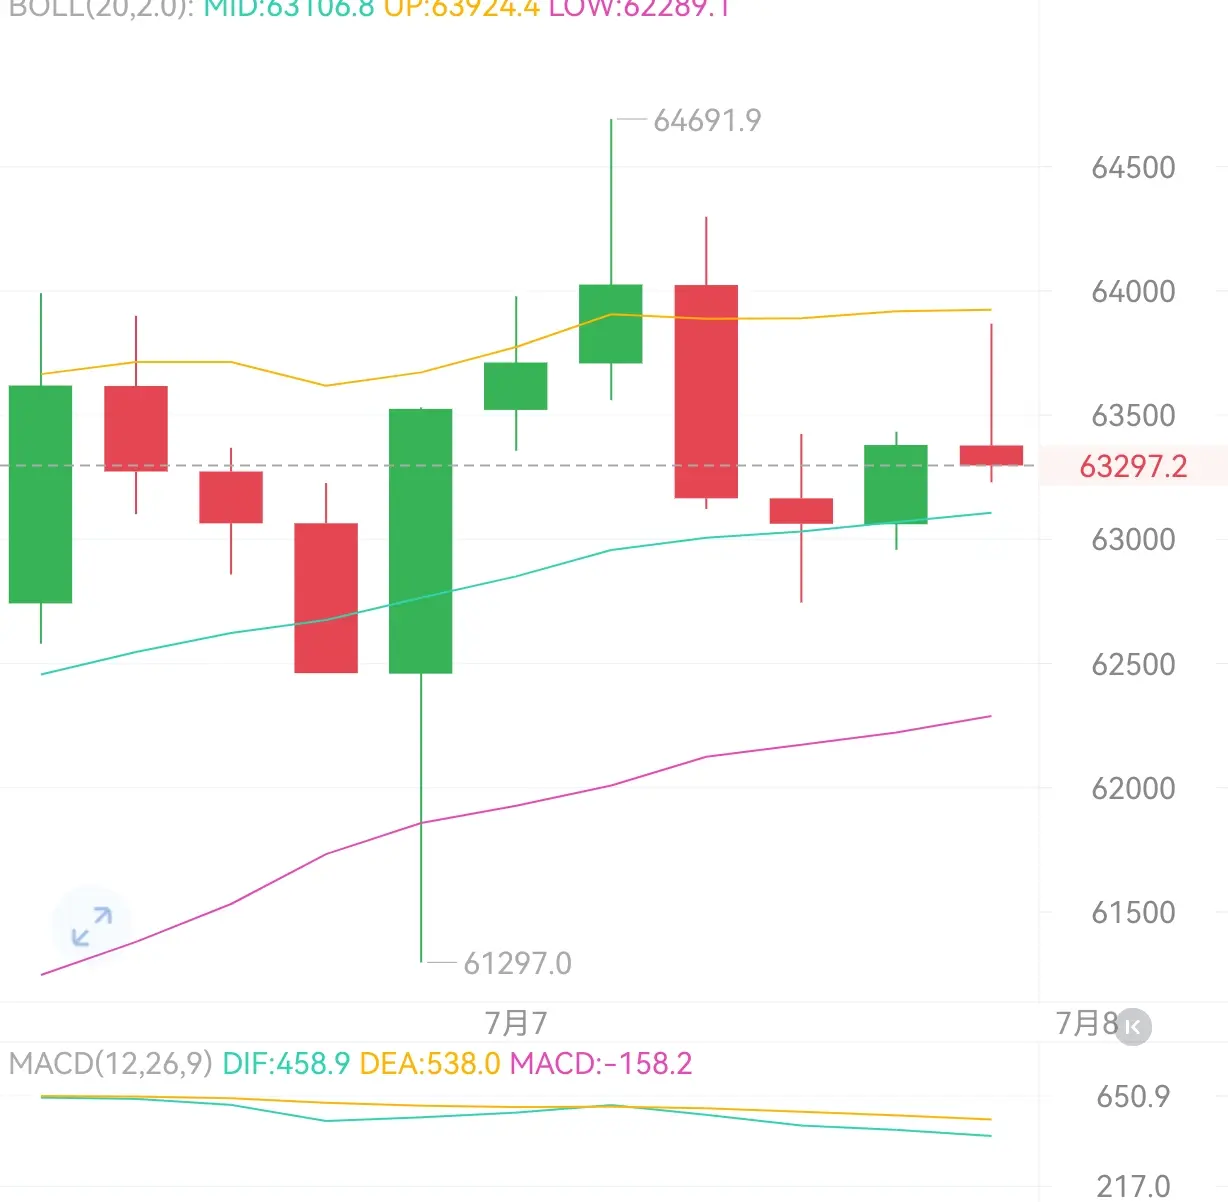
Evening analysis on the 8th
Bearish news is everywhere, and everyone is looking to short. But remember one thing: when everyone is looking to short, don't blindly go short—at least choose an appropriate entry level. Otherwise, a reversal could easily trap you. The short-term is approaching oversold territory, with demand for a minor rebound correction, but the medium-term trend has weakened. If the rebound cannot hold above the middle Bollinger band at 63,102, the pullback may continue. When uncertain, trade with a light position. After all, with Trump's intervention, technicals often don't
BTC2.23%
ETH1.52%
View Original
post-image
post-image
  • Reward
  • Comment
  • Repost
  • Share
Congratulations to all of us in Snowfield for synchronously taking down $BTC 1600 Dian Kong Jian—didn’t it come down already? Don’t worry too much. I told you, it’s definitely going to drop today. Everyone’s taking off—stick with it and it’s victory. No explanation, just look at the results #BTC #ETH #BTC走势分析
BTC2.23%
ETH1.52%
View Original
post-image
post-image
  • Reward
  • Comment
  • Repost
  • Share
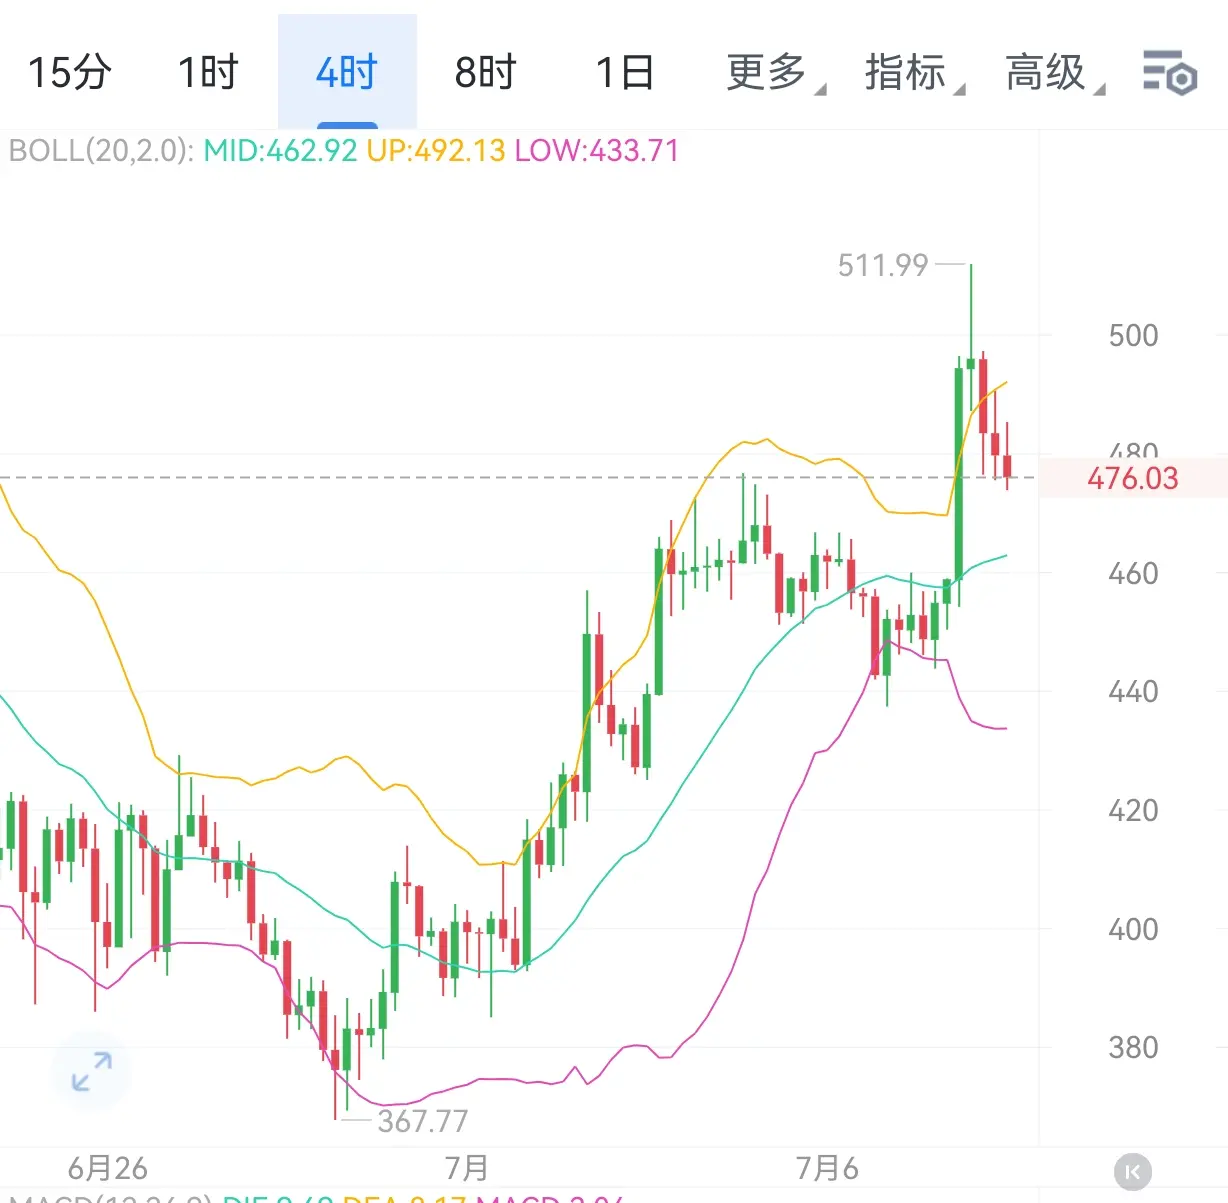
$ZEC Current price is 477. After hitting 512 high during the day, it faced pressure and pulled back. Capital flows have continued to show sustained net inflows, and the medium-term bullish channel remains intact.
The Bollinger Bands middle band at 463 is strong support, while the upper band at 492 forms short-term resistance. The MACD bullish structure has not been broken, but upward momentum is weakening. Across multiple timeframes, RSI is neutral-to-bullish, with no severe overbought conditions.
At this stage, the market is mainly consolidating at high levels to digest profit-taking. The
ZEC7.29%
BTC2.23%
ETH1.52%
View Original
post-image
  • Reward
  • Comment
  • Repost
  • Share
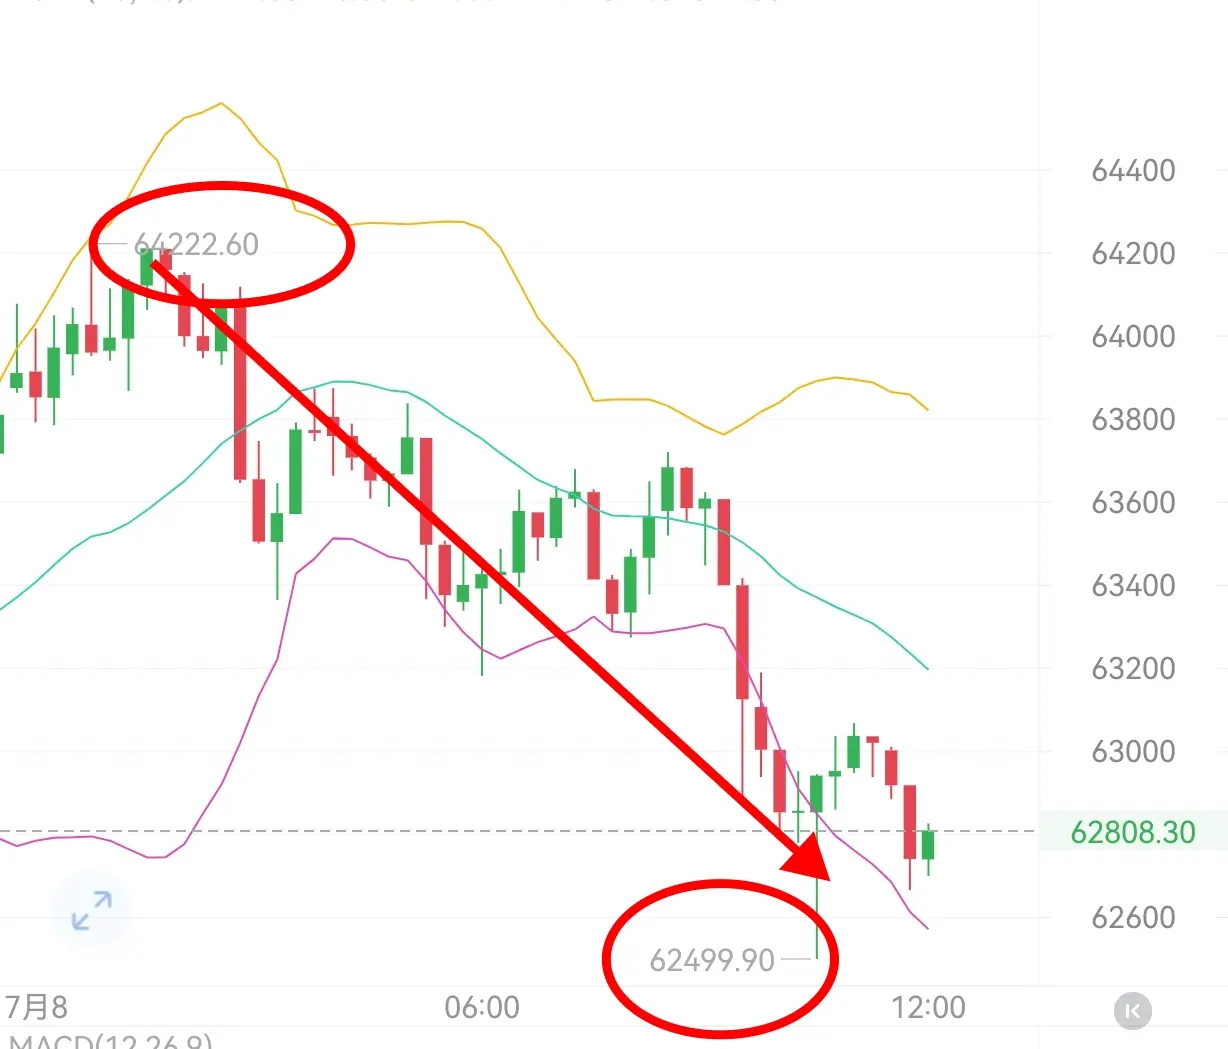
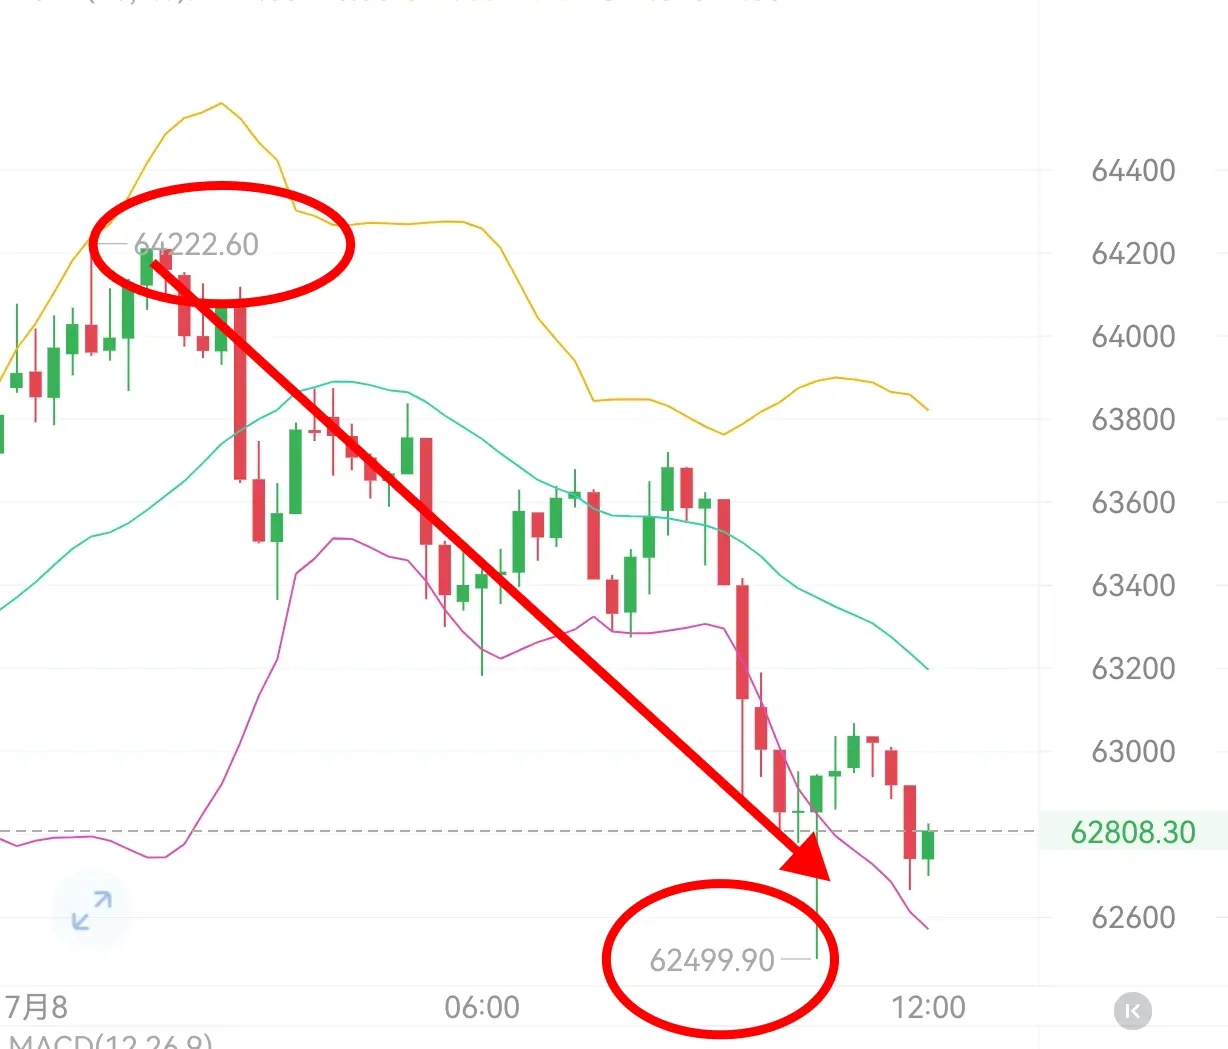
Did all the orders I gave everyone last night take off now? As long as you follow the opening prices I provided—$BTC and $ETH —you’re all full for now, and there are still many friends who were shouting yesterday that once it broke 64000, they would chase it. Everyone was told not to let any surface-level phenomena confuse you or mislead you—just take a look at Yifan’s analysis. Everyone was anxious yesterday, and I even said today would definitely come down. Now you’re all happy, right? When has Yifan ever given you a direction that was wrong? Stay with it, keep your mindset steady—the big p
BTC2.23%
ETH1.52%
View Original
post-image
post-image
  • Reward
  • Comment
  • Repost
  • Share
7.8 Midday Analysis
The short positions I gave you yesterday, big and small, have all profited, right? Let's talk about the current market situation and conditions.
Macro Perspective: Tightened Liquidity Suppresses BTC Upside
The Federal Reserve continues to shrink its balance sheet, draining hundreds of billions of dollars in liquidity from the market each month. $BTC , as the most liquidity-sensitive asset, lacks the macro foundation for a trend upward. Meanwhile, the U.S. dollar remains strong, U.S. bond yields are high, and the opportunity cost for institutions holding BTC is still el
BTC2.23%
View Original
post-image
post-image
  • Reward
  • 6
  • Repost
  • Share
EatingMeatIsReallyDifficult.:
Yes, it’s definitely correct to follow that, but I set 63950 around 10 o’clock, and the system didn’t return any ticket.
View More
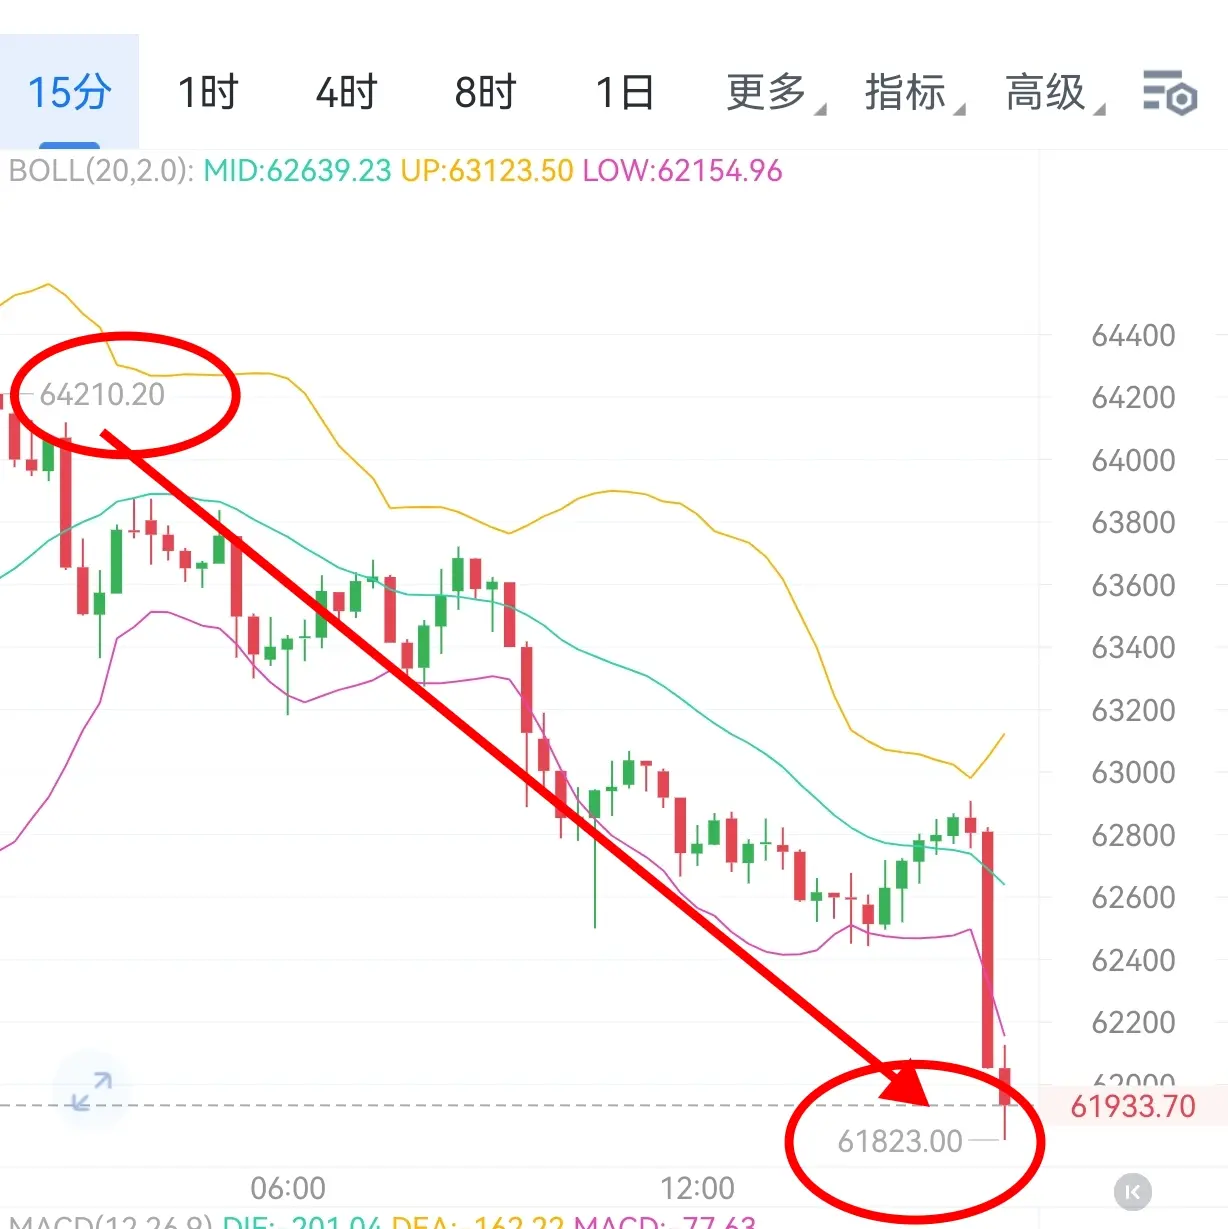
Brothers, get up and watch the waterfall again, keep smashing, however you go up, however you come down #BTC #ETH #BTC走势分析
BTC2.23%
ETH1.52%
View Original
post-image
post-image
  • Reward
  • 1
  • Repost
  • Share
CcChenYifan:
in place
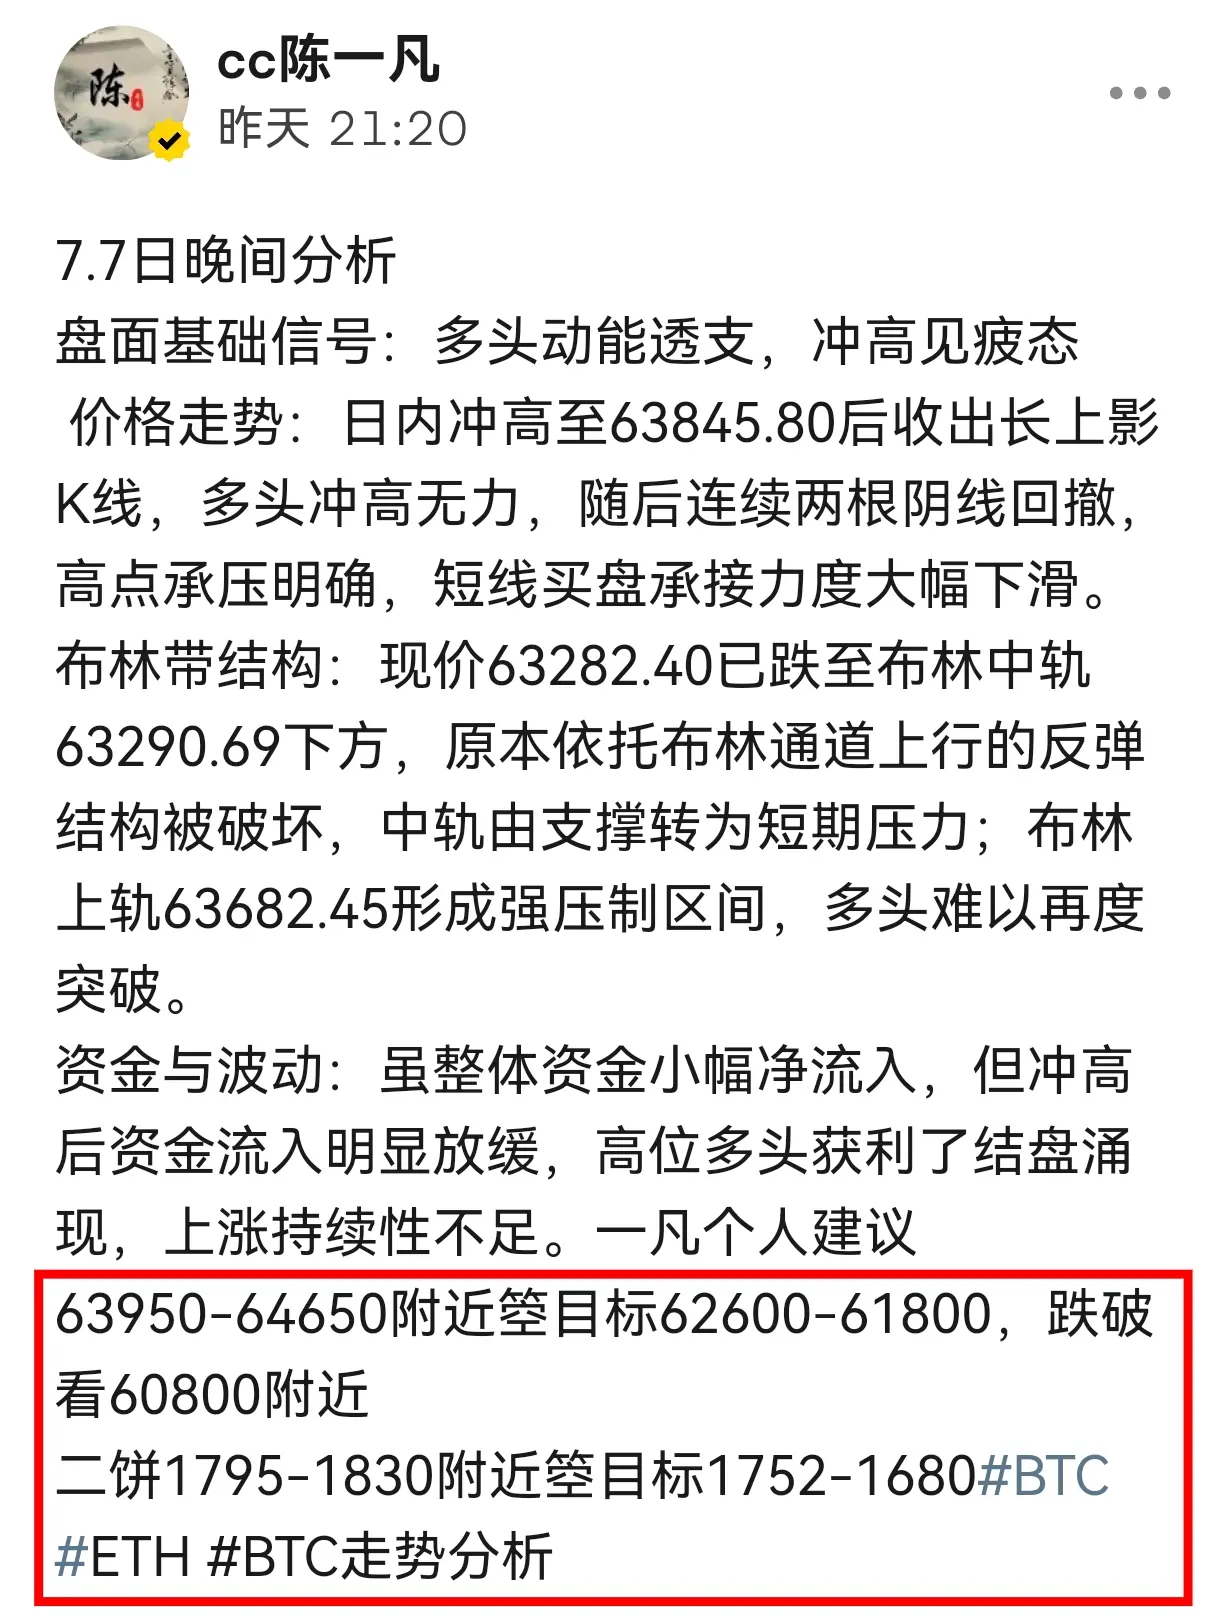
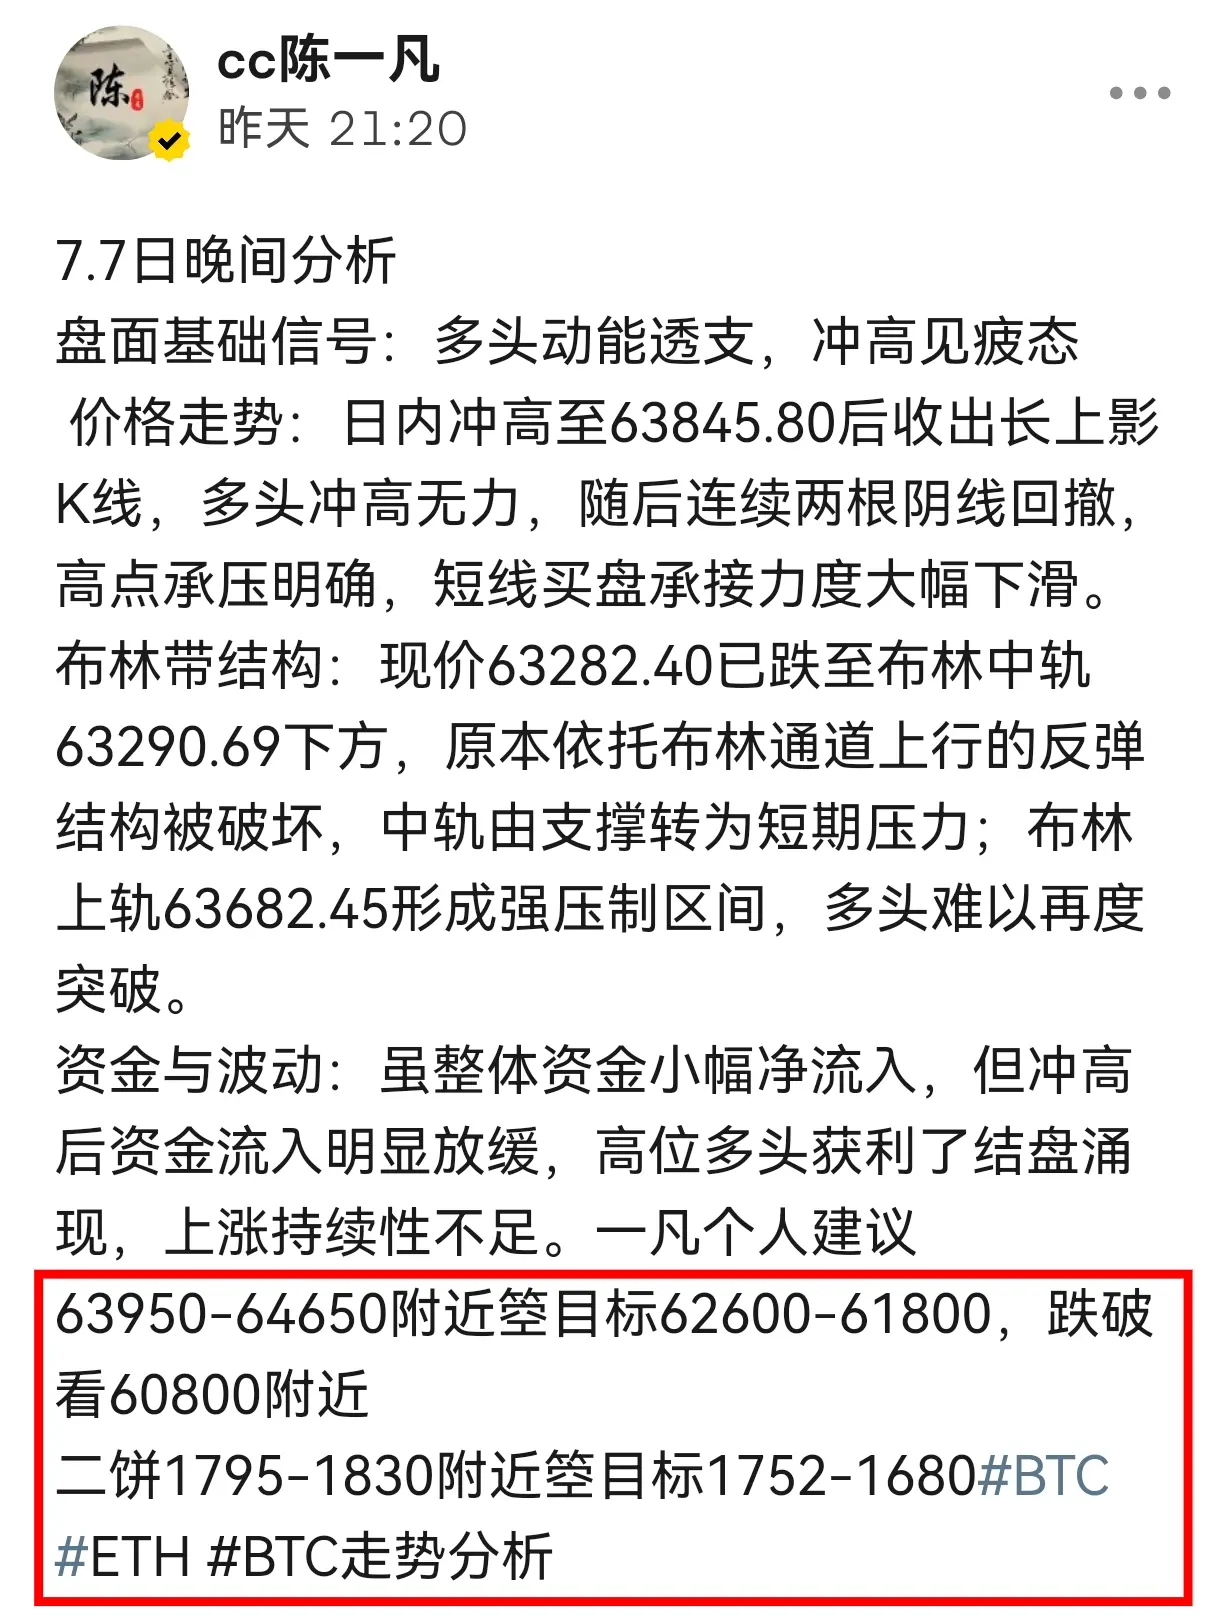
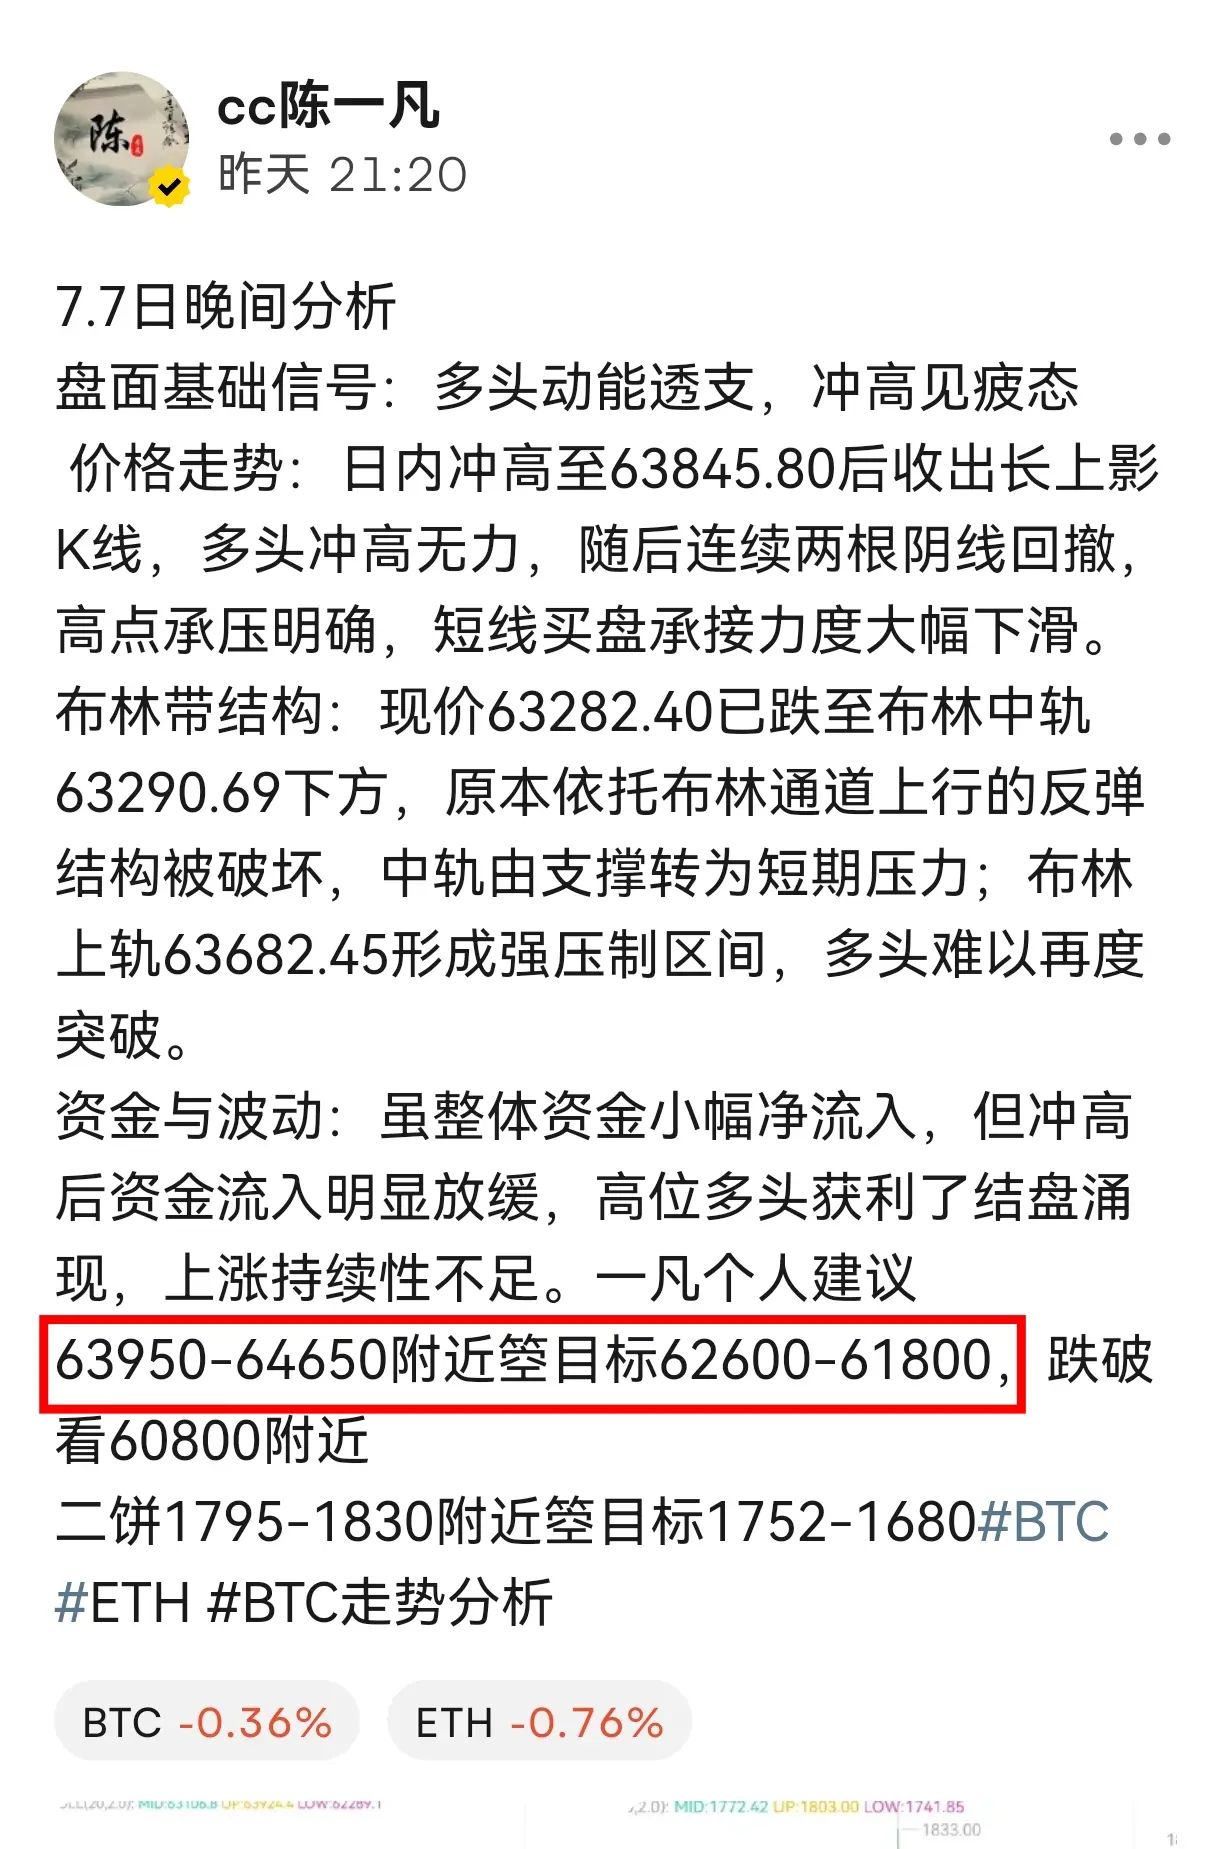
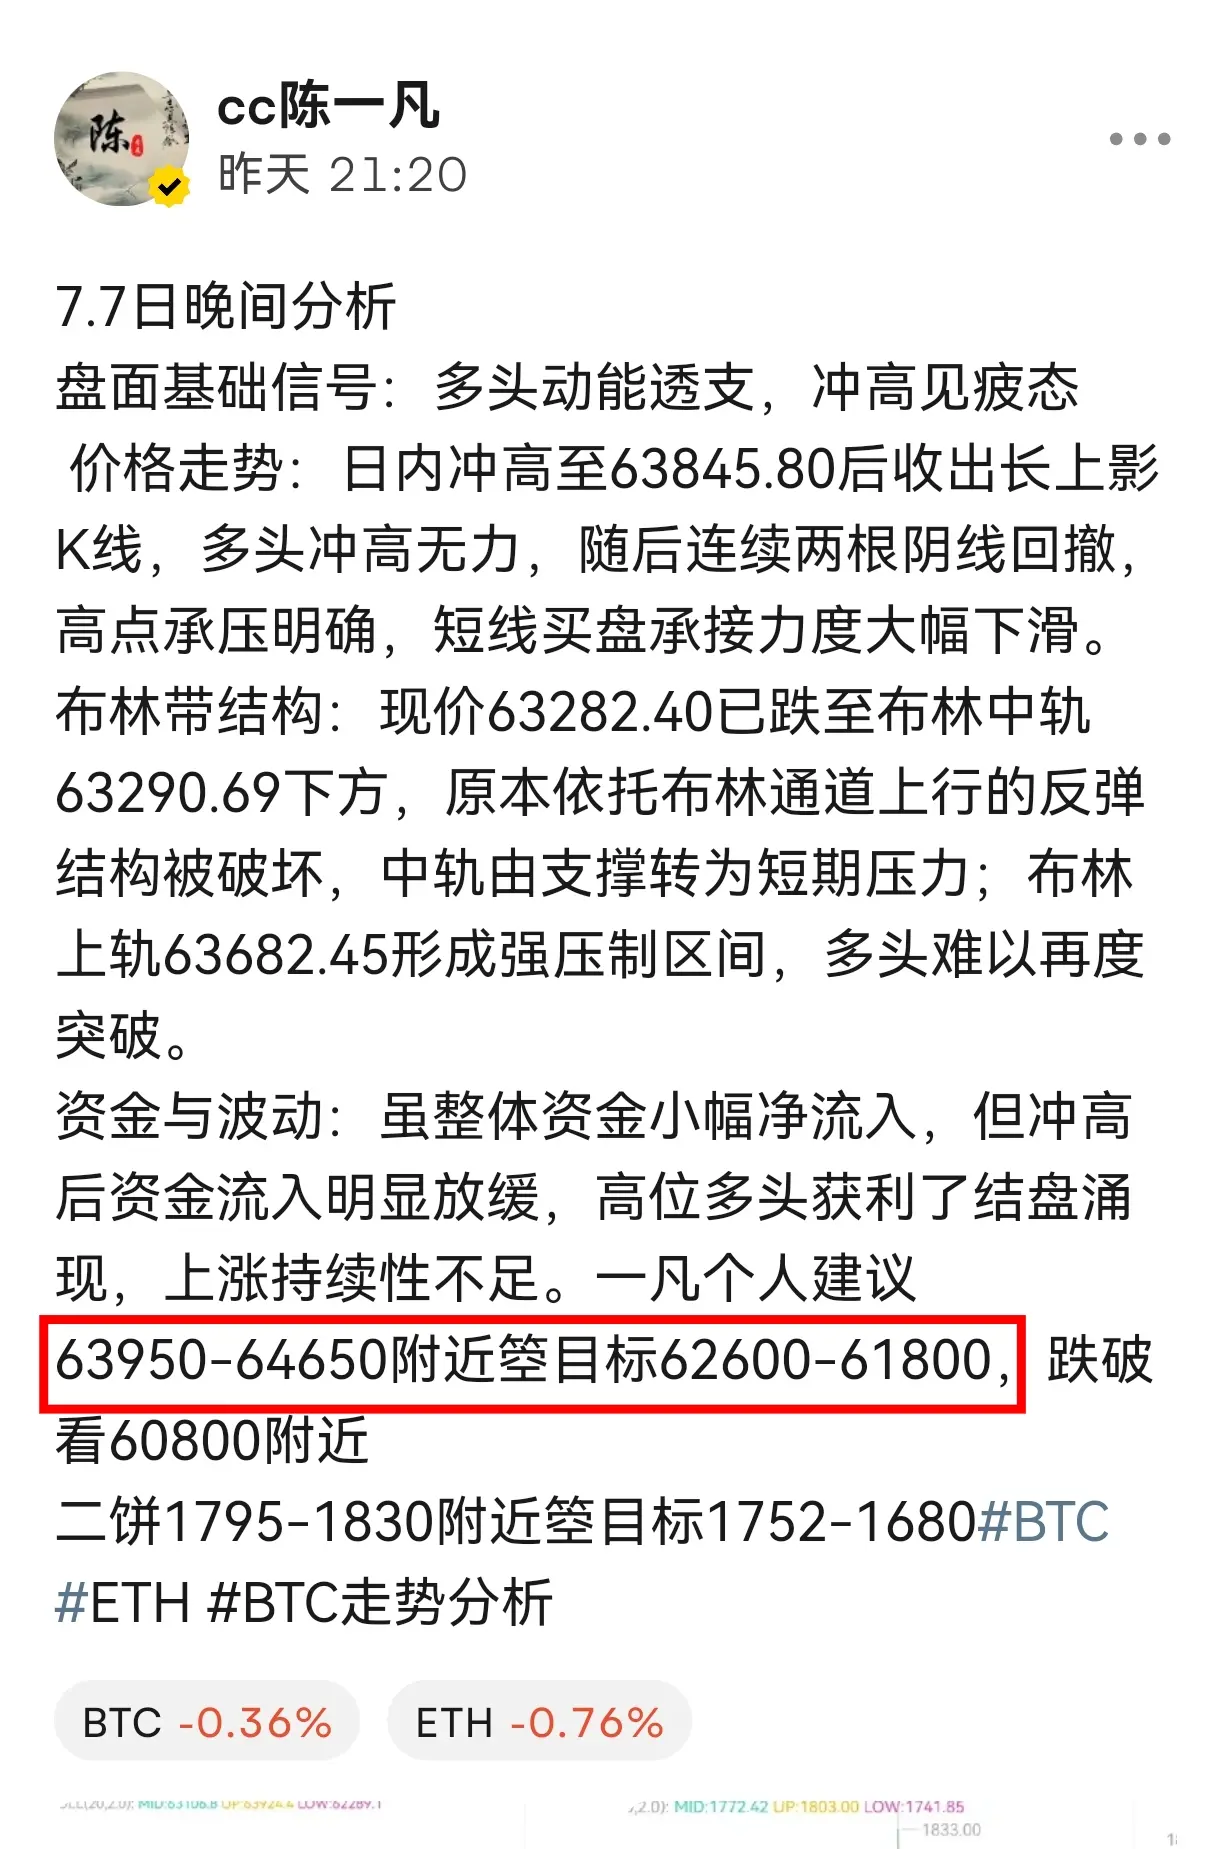
7.7 Evening Analysis
Basic Signals on the Chart: Bullish momentum exhausted, rally showing signs of fatigue
Price Action: After hitting an intraday high of 63,845.80, a long upper wick candle formed, indicating faltering bullish momentum, followed by two consecutive bearish candles pulling back, with clear resistance at the high and a sharp decline in short-term buying support.
Bollinger Bands Structure: The current price of 63,282.40 has fallen below the middle Bollinger Band at 63,290.69, breaking the previous rebound structure that relied on the upper channel. The middle band has shif
BTC2.23%
ETH1.52%
View Original
post-image
post-image
  • Reward
  • 1
  • Repost
  • Share
IAmBoboAn.:
Awesome
7.7 Morning Analysis
Yesterday evening, the market was already supposed to rise, but after being disrupted by the news, it was directly smashed lower. Later, it was then pushed back up by a call from “Old Te.” This is a typical pattern: first shake out the longs/heads, then wash out the other side, and only afterward see that the current market is in the late stage of a rebound with lagging follow-through. Multiple indicators simultaneously send out exhaustion warnings. After the short-term price spikes up into the 64019 area and meets resistance, it will most likely enter a phase of pullbac
BTC2.23%
ETH1.52%
View Original
post-image
post-image
  • Reward
  • Comment
  • Repost
  • Share
Are you a child? You're manipulating the crypto market with just your words—stop causing trouble! Technical analysis is worthless in the face of news; no matter how much analysis you do now, it's useless. Just wait quietly. #BTC #ETH #BTC走势分析
BTC2.23%
ETH1.52%
View Original
post-image
post-image
  • Reward
  • 2
  • Repost
  • Share
LikeMaple:
Indeed
View More
Sudden news, sell-off, can it hold? The situation is looking ugly.
View Original
post-image
  • Reward
  • 1
  • Repost
  • Share
EatingMeatIsReallyDifficult.:
What to do then? Forcibly stop loss?
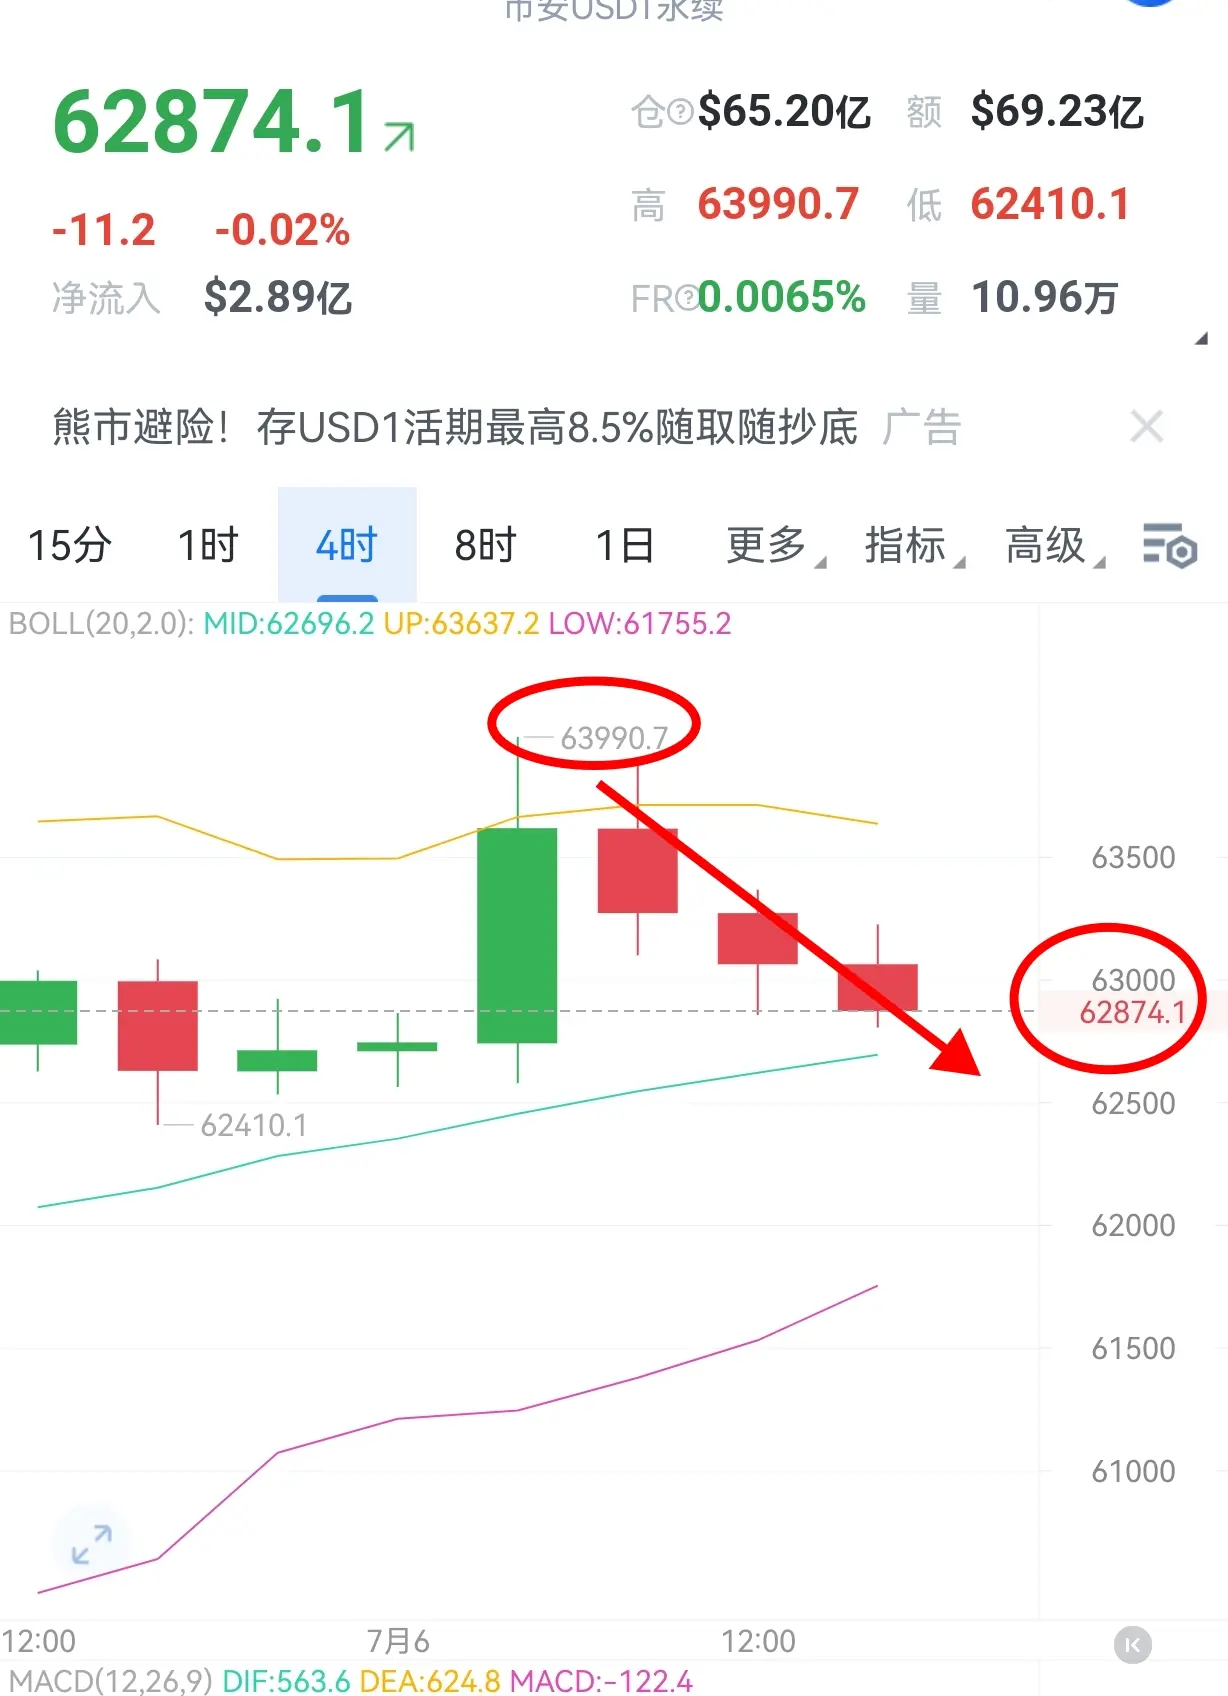
July 6 $BTC Afternoon Analysis
The short target near 63900 given in the morning has been reached. Now you can go long relying on the support level. Although the price has slightly dropped, the 24h net inflow is as high as +$289 million. This indicates that large funds (the main force) are actively buying on the order book, a typical "buying the dip" sign rather than distribution.
· The funding rate (FR) is only 0.0065%, an extremely low level. This means there is almost no cost to short, shorts are crowded, and once the price stabilizes, short covering will accelerate the price rise.
Tec
BTC2.23%
ETH1.52%
GLDX0.44%
PAXG0.59%
View Original
post-image
post-image
  • Reward
  • Comment
  • Repost
  • Share
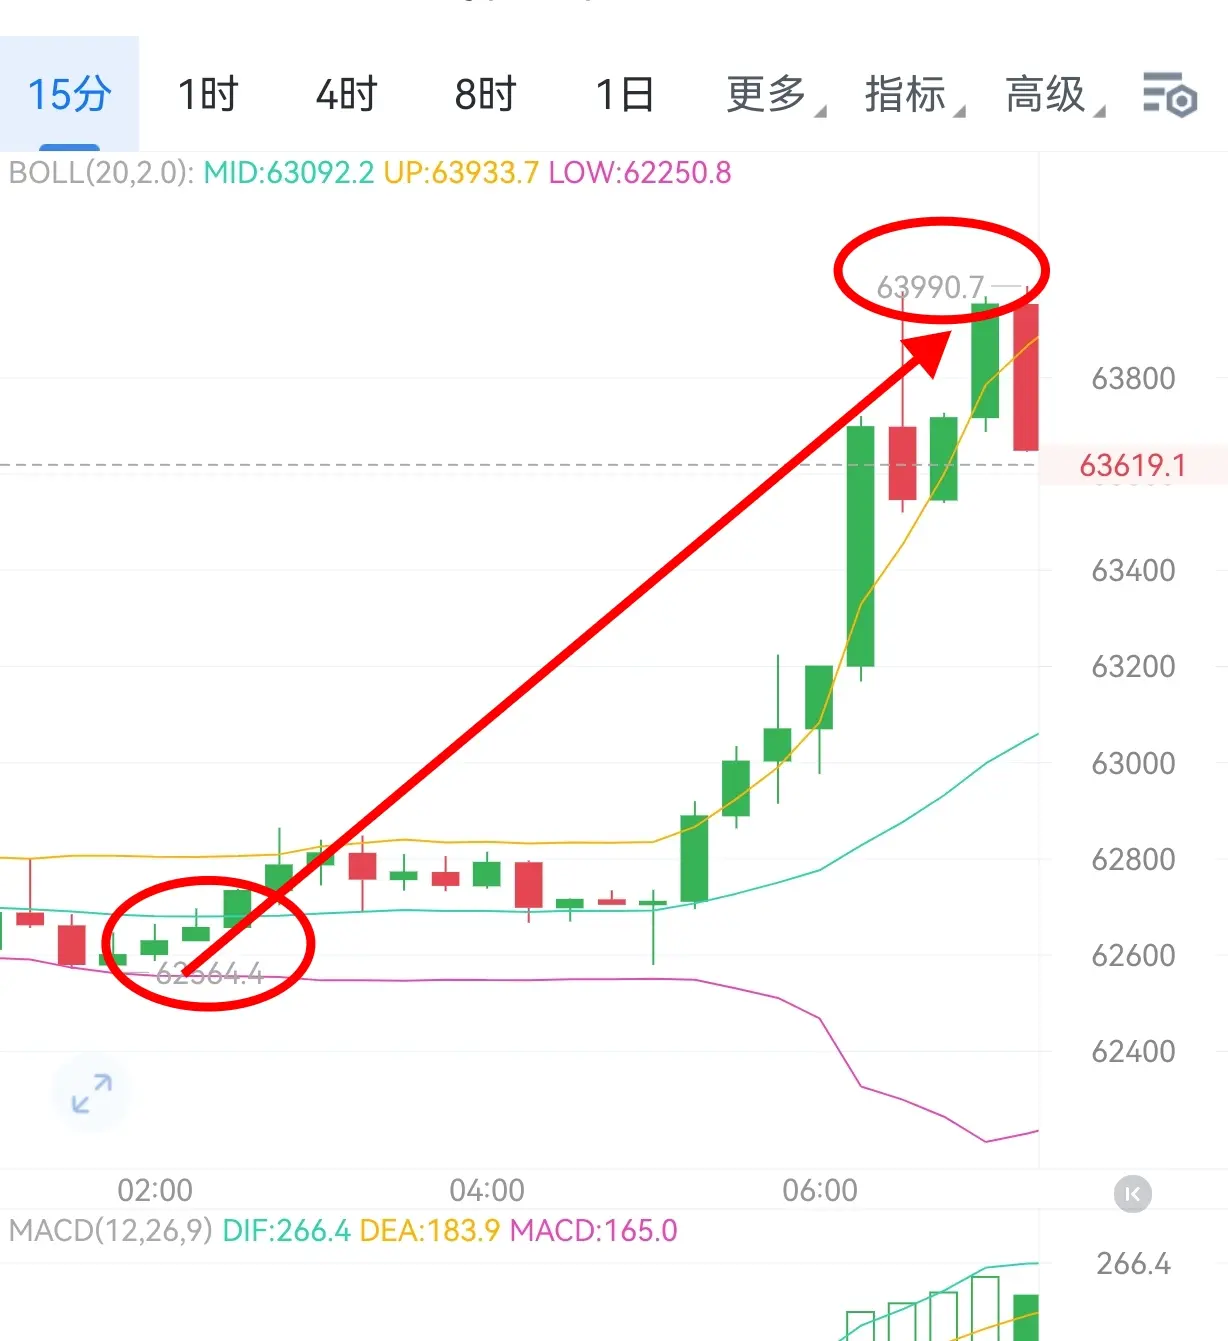
The wave that didn’t stretch yesterday afternoon has now perfectly surged this morning. This wave is definitely going to happen. The “do tou” structure has always been there. Right now, we can only pull back to go long and do “do tou,” while going to do “#BTC #ETH #BTC走势分析 ”.
BTC2.23%
ETH1.52%
View Original
post-image
post-image
  • Reward
  • Comment
  • Repost
  • Share
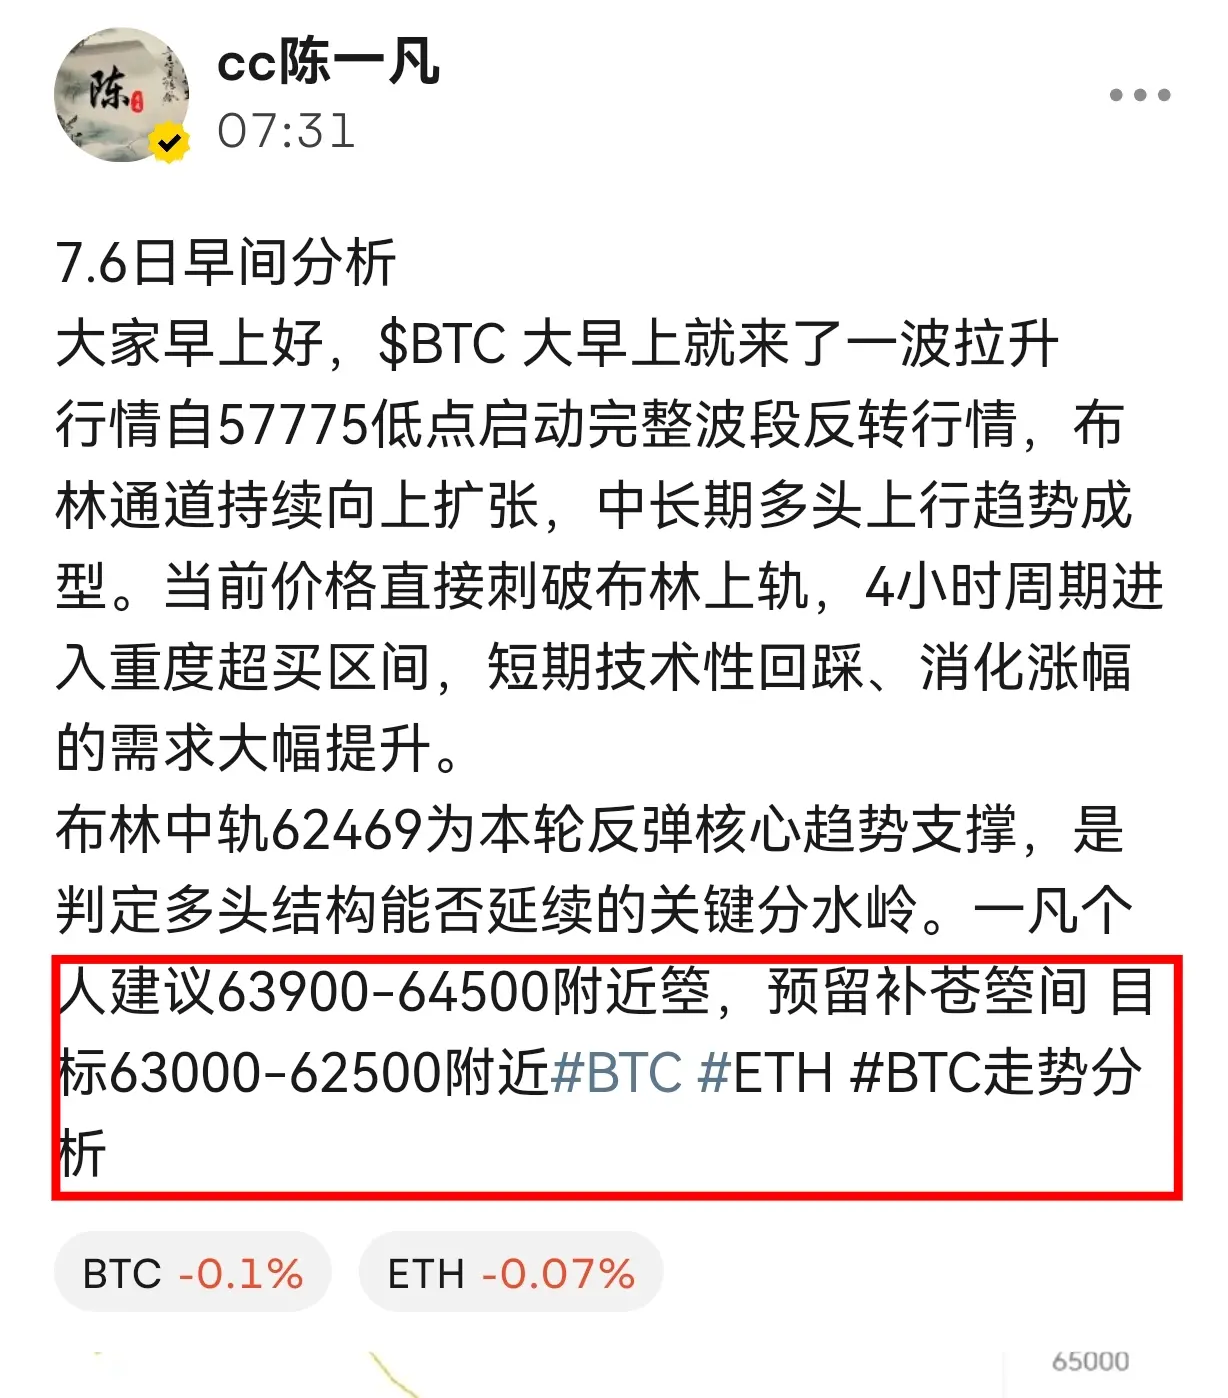
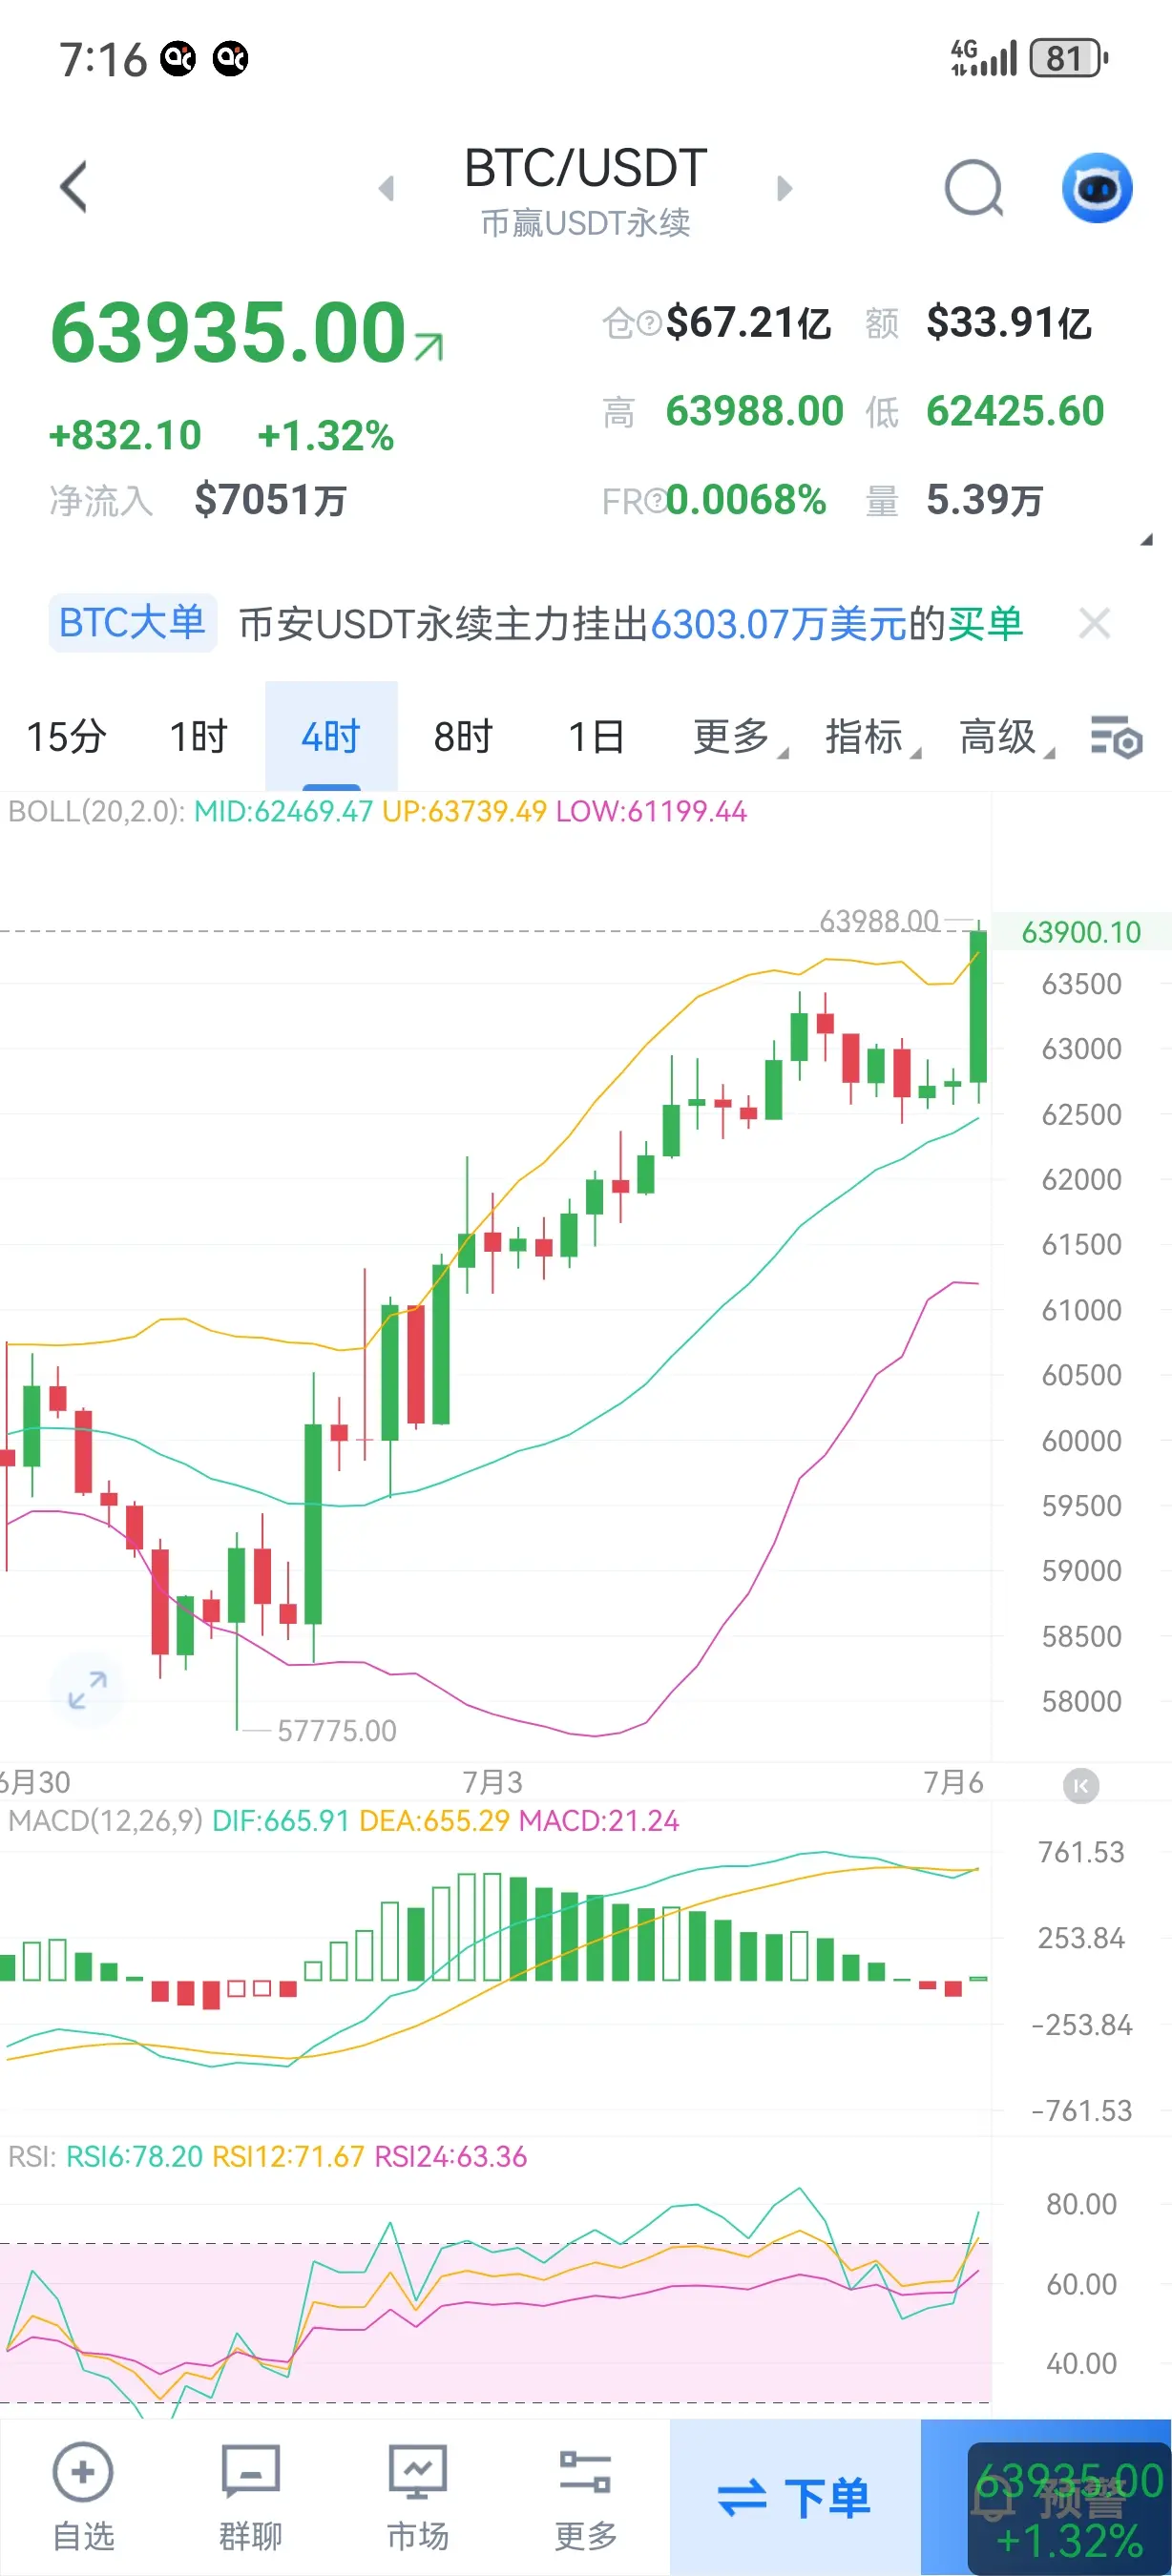
Morning Analysis on July 6th
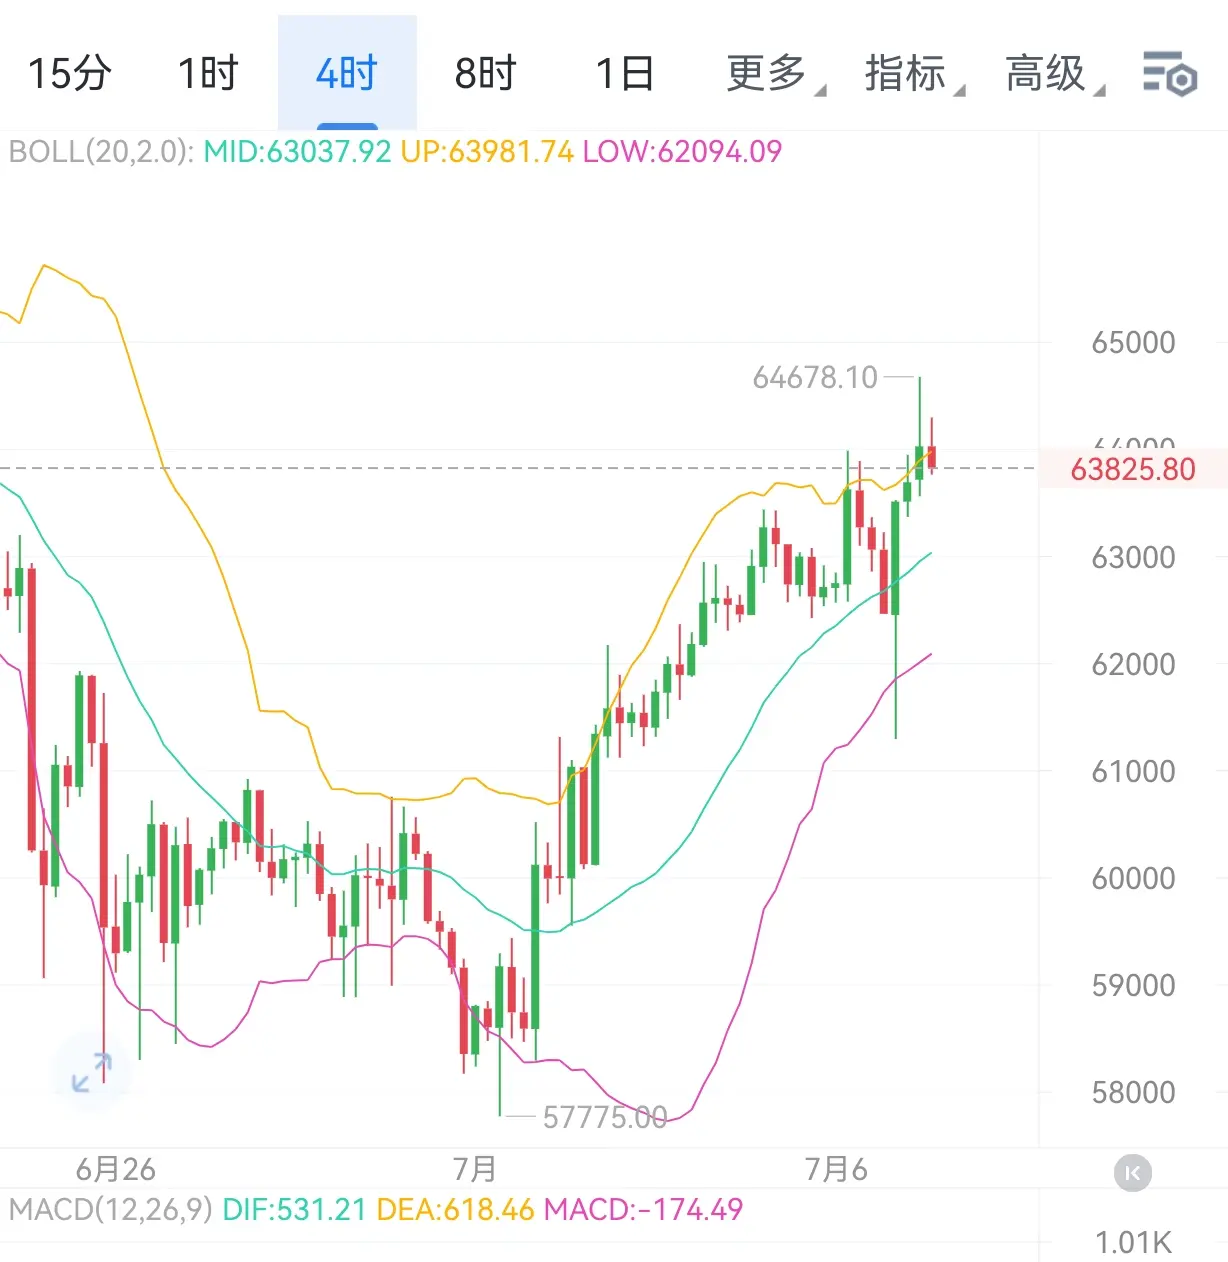
Good morning everyone, $BTC there was a surge early in the morning
The market has launched a complete wave reversal from the 57775 low, with the Bollinger Bands continuously expanding upward, forming a medium-to-long-term bullish uptrend. The current price has directly pierced the upper Bollinger Band, entering a severely overbought zone on the 4-hour timeframe, significantly increasing the need for a short-term technical pullback to digest gains.
The middle Bollinger Band at 62469 serves as the core trend support for this rebound and is the key watershed fo
BTC2.23%
ETH1.52%
View Original
post-image
  • Reward
  • Comment
  • Repost
  • Share
7.5th $BTC Evening Analysis
DIF crossed below DEA forming a small death cross, with slight green bars appearing, indicating that the short-term bullish momentum on the 4-hour level is weakening;
After a previous rally, the indicators entered a repair phase, with no deep bearish volume appearing, only a pullback after the rise. All three lines are above the 50 neutral line, and the overall bullish trend background remains unchanged;
Short-term RSI6 turns downward, entering a pullback repair after overbought conditions. It has not entered the oversold zone below 30, and there is no deep bearish
BTC2.23%
View Original
post-image
  • Reward
  • Comment
  • Repost
  • Share
$ETH Currently at 1764.99, short-term slight increase of 0.55%; the range for this 4-hour cycle is 1750.51-1808.00. Earlier, there was a strong rebound rally to the high of 1808, followed by a pullback. Now it is consolidating at a high level.
Fundamentals are showing a slight positive bias, with net capital inflow of 46.19 million USDT, current trading volume of 5.39B, and open interest of 4.07B. Long-side funds continue to flow in, and trading activity is ample. A pullback near 1735-1680 suggests targeting 1790-1830.#BTC #ETH #BTC走势分析
ETH1.52%
View Original
post-image
  • Reward
  • Comment
  • Repost
  • Share
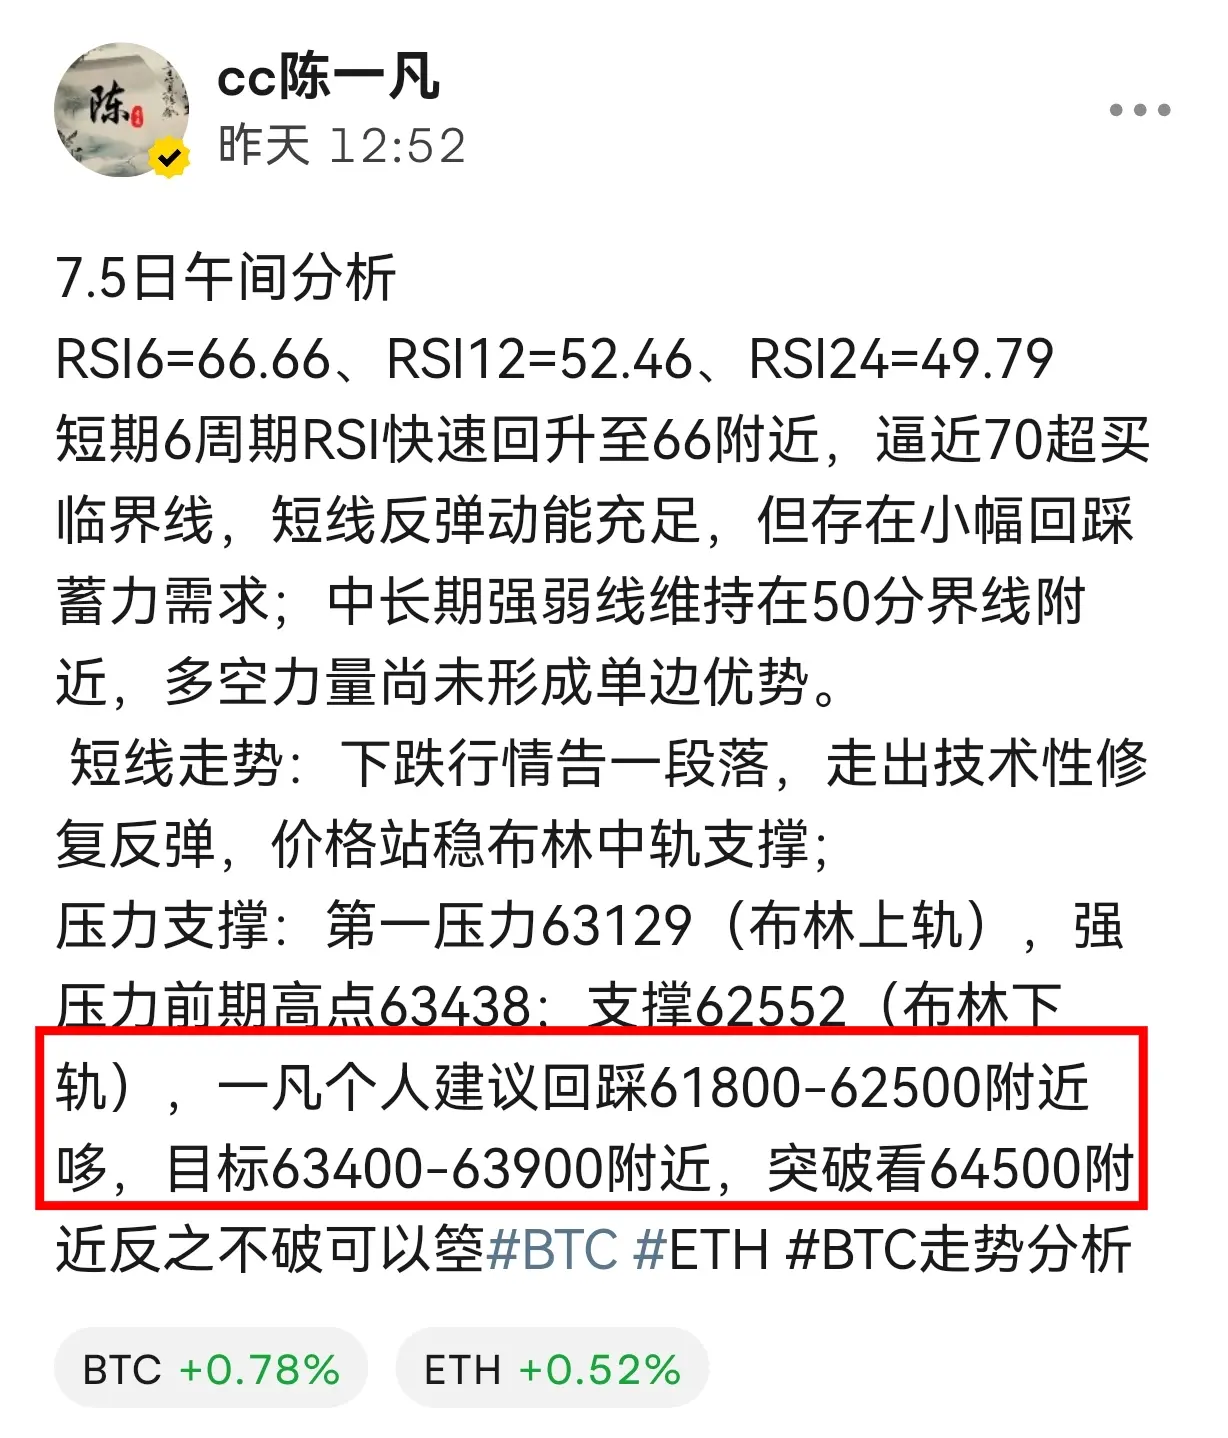
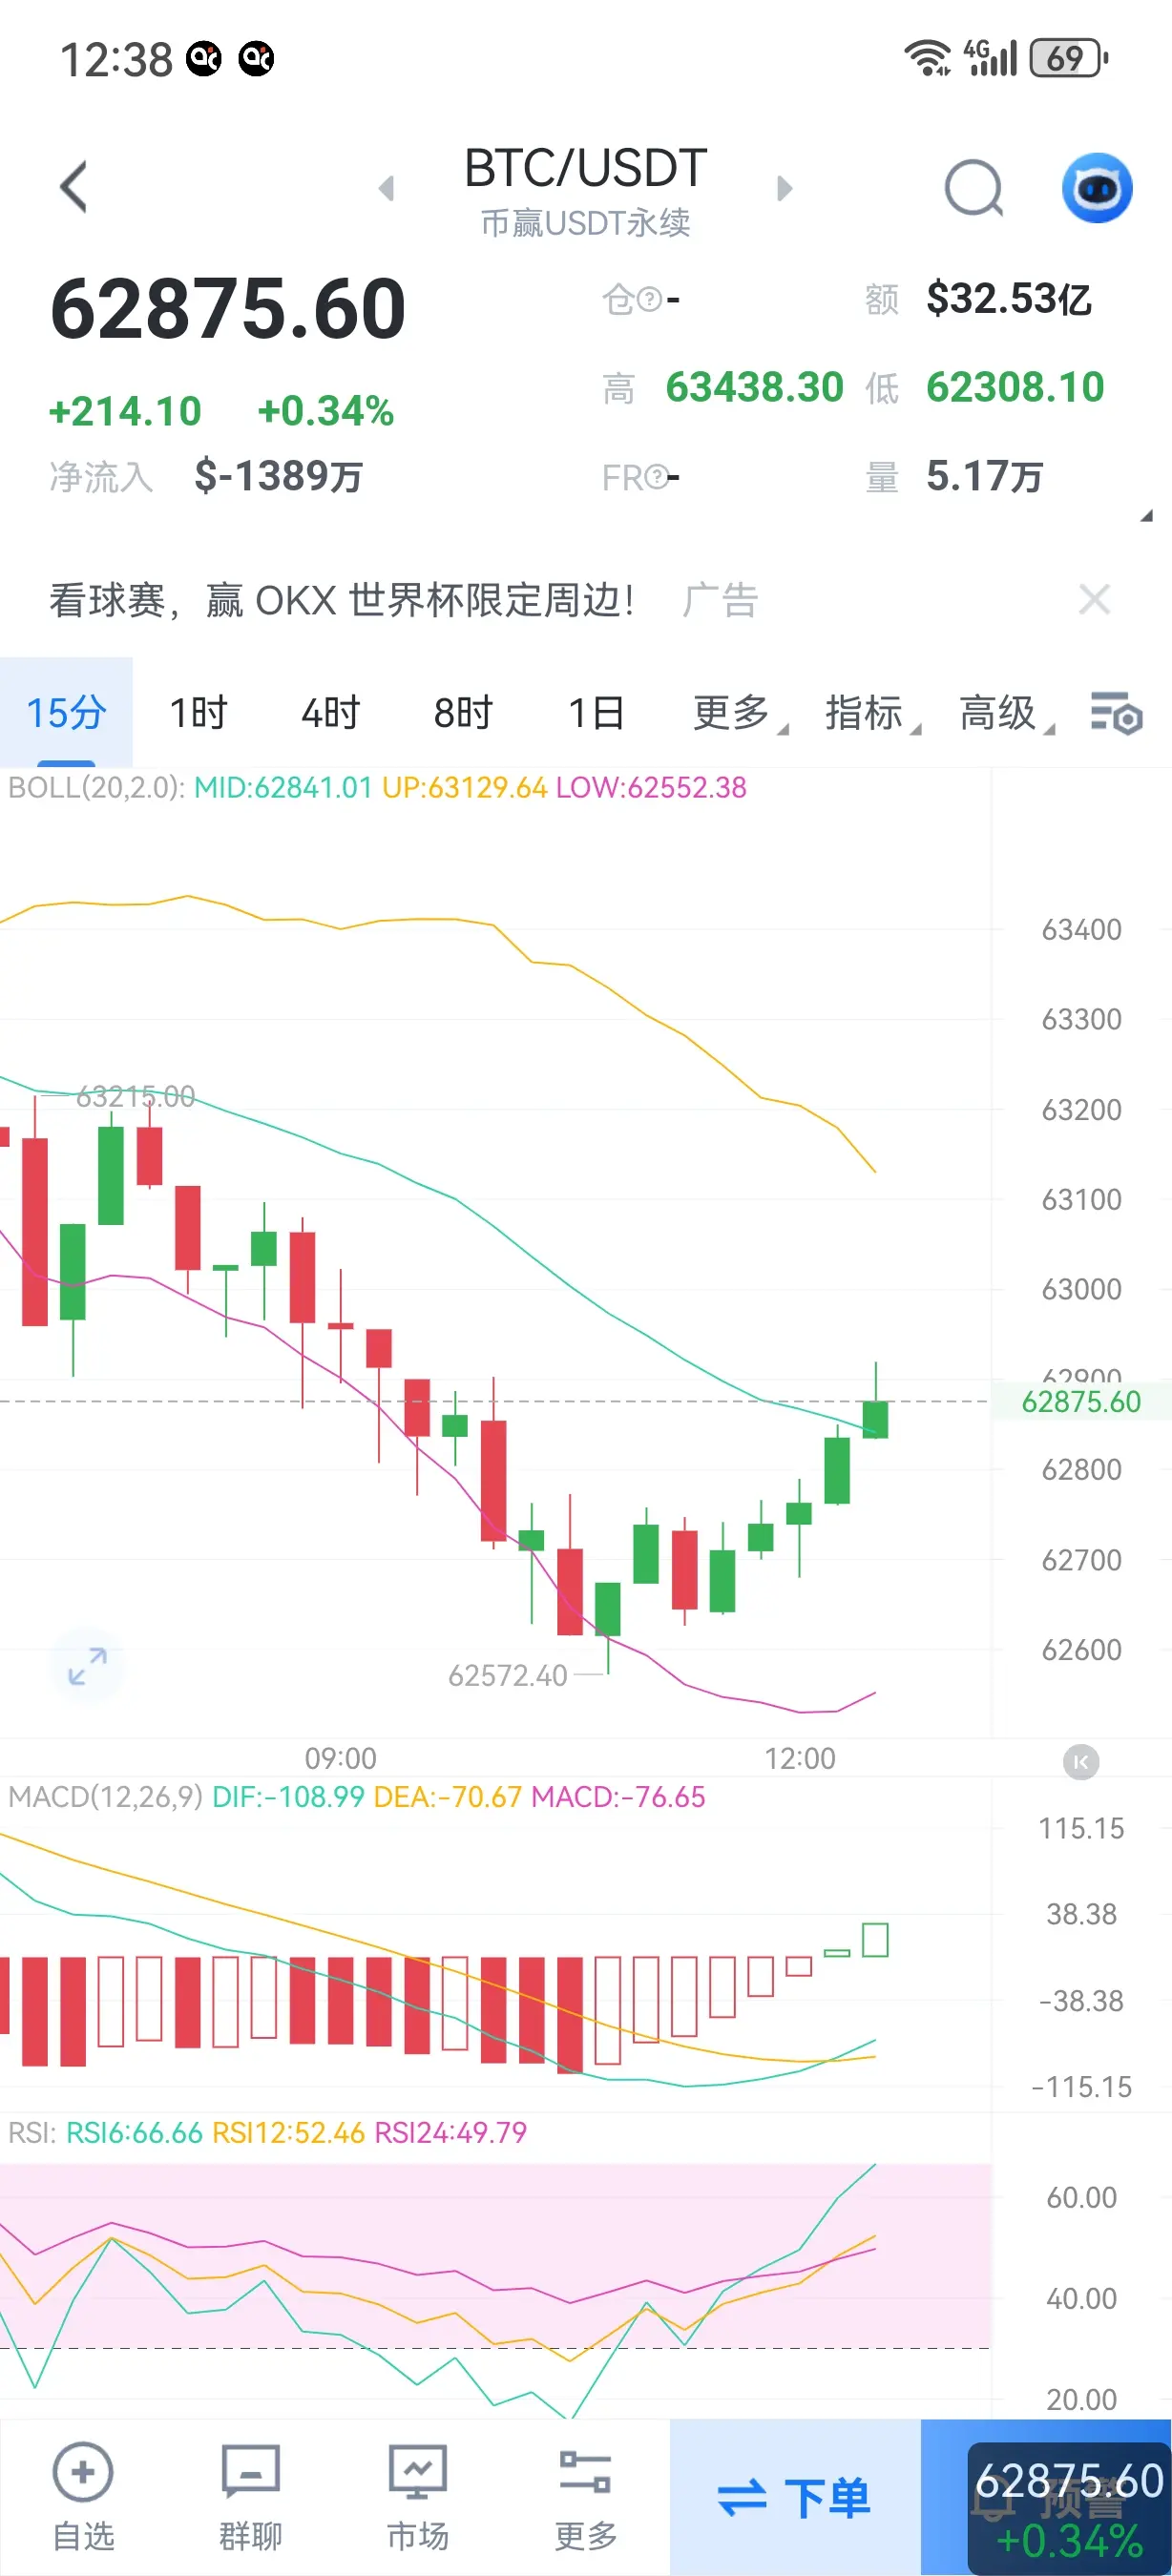
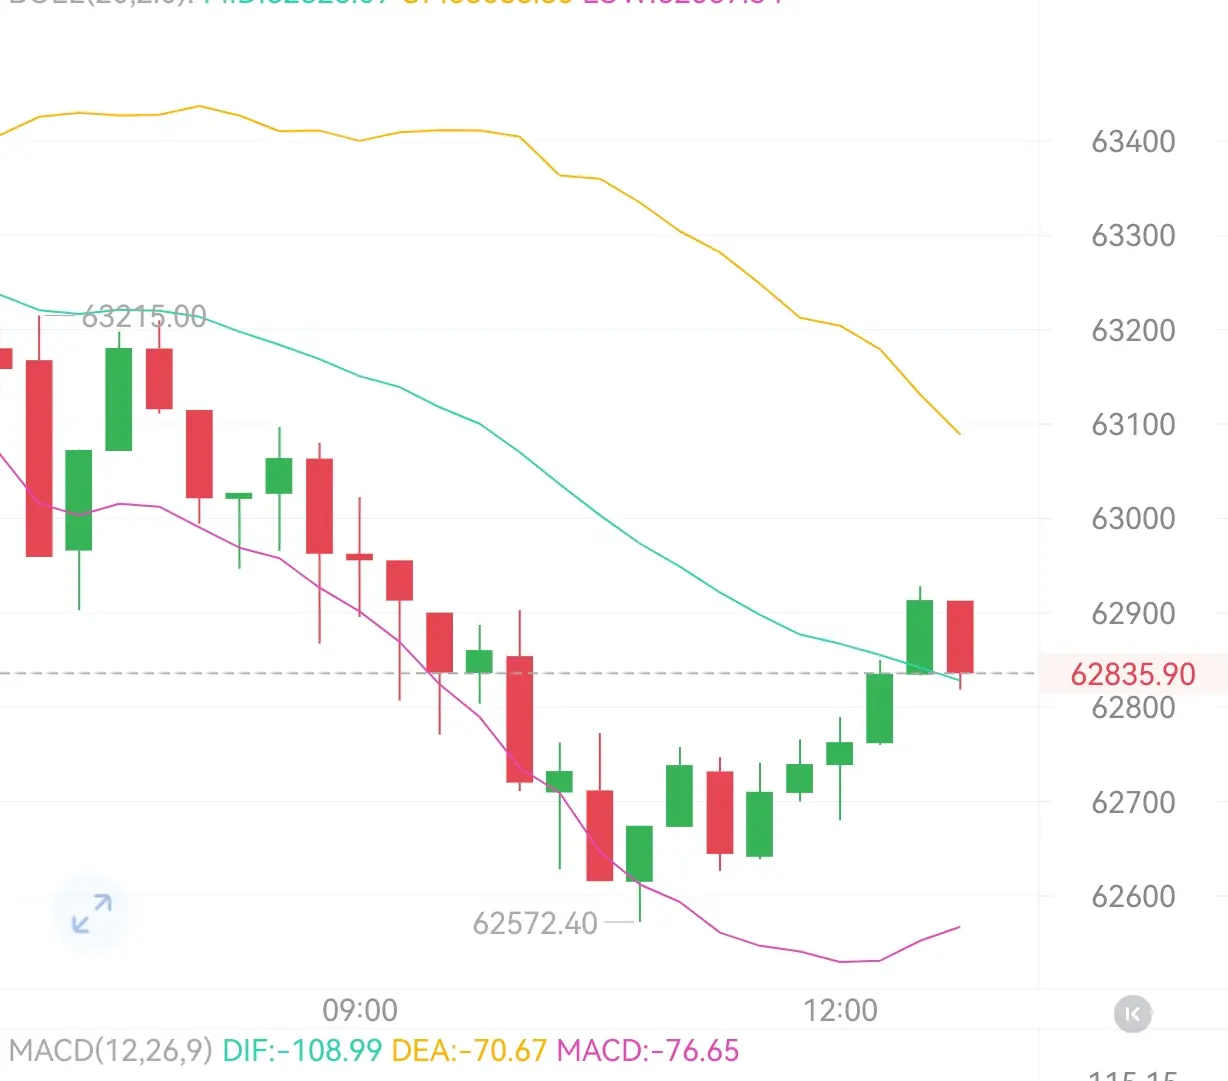
7.5 Midday Analysis
RSI6=66.66, RSI12=52.46, RSI24=49.79
In the short term, the 6-period RSI has quickly rebounded to around 66, nearing the 70 overbought threshold. Short-term rebound momentum is sufficient, but there is a need for a slight pullback to build up energy; the medium-to-long-term strength line remains around the 50 boundary, and bullish and bearish forces have not yet formed a clear one-sided advantage.
Short-term trend: The downtrend appears to have ended, and a technical correction rebound has formed, with the price holding above the middle Bollinger Band support.
Press
BTC2.23%
ETH1.52%
View Original
post-image
post-image
  • Reward
  • Comment
  • Repost
  • Share
  • Pinned