BrotherXinPlaysSolana

vip
Crypto Market Researcher
Diamond Hands
Futures Trading Strategist
Fully automated contract trading, Xin Xinge
sol
1. Today's direction: 【Bullish】
2. Key price levels:
- Intraday support: $83.70 USDT (4H Bollinger lower band)
- Intraday resistance: $87.08 USDT (24h high)
3. Trading reference:
- Long entry: Stabilize and enter between $85.50-$86.50
- Take profit 1: $87.50 | Take profit 2: $89.00
- Stop loss: $83.50 (break below Bollinger lower band)
- Position size: ≤15%, strictly with stop loss
4. Risk warning: Market-wide linkage risk, $87.08 is a key breakout level
5. Confidence level: 68%
SOL-0.43%
View Original
  • Reward
  • Comment
  • Repost
  • Share
Sol Strategy
1. Today’s Direction: 【Bearish】
2. Key Price Levels:
- Intraday Support: 83.42 USDT (Bollinger lower band)
- Intraday Resistance: 85.34 USDT (Bollinger middle band) / 87.27 USDT (Bollinger upper band)
3. Trading Reference:
Short (trend-following preferred): Enter 84.8–85.5, Take profit 82.5, Stop loss 86.5, Position ≤ 15%
Long (oversold, light position): Stabilize around 83.5 with a light position, Take profit 85.0, Stop loss 82.8
4. Risk Warning: BTC market correlation risk; RSI is not oversold but the overall trend is weak
5. Confidence Level: 75%
Testing Rul
SOL-0.43%
BTC-0.15%
View Original
  • Reward
  • Comment
  • Repost
  • Share
sol
1. Today's outlook: 【Bearish】
2. Key price levels:
- Intraday support: 83.64 USDT (Bollinger lower band)
- Intraday resistance: 88.87 USDT (Bollinger upper band)
3. Trading references:
- Short entry: 85.8~86.5 (1%~1.5% above current price)
- Short take profit 1: 83.64 (Bollinger lower band, about 1.8 ATR)
- Short take profit 2: 81.5 (more room)
- Short stop loss: 87.3 (about 1.5 ATR above)
- Position suggestion: ≤15%, with strict stop loss
4. Risk warning: 4H RSI at 39.9 is in a weak zone, but 1H RSI at 58.6 indicates a rebound, watch out for whipsaw risk
5. Confidence level: 76%
SOL-0.43%
View Original
  • Reward
  • Comment
  • Repost
  • Share
SOL Trading Recommendations
1. Today's Direction: [Bullish]
2. Key Price Levels:
- Intraday Support: 85.12 USDT (Bollinger Lower Band)
- Intraday Resistance: 89.96 USDT
3. Trading References:
- Going Long (Oversold Rebound, Follow the Trend):
- Entry: 84.31–85.94 Confirm stabilization
- Take Profit: 91.59
- Stop Loss: 83.49
- Position Size: ≤10%
- Going Short (Rebound Followed by Trend):
- Entry: 87.13–88.0
- Take Profit 1: 81.81 | Take Profit 2: 78.55
- Stop Loss: 90.78
- Position Size: ≤15%
4. Risk Warning: 4
SOL-0.43%
BTC-0.15%
View Original
  • Reward
  • Comment
  • Repost
  • Share
sol
1. Today's direction: 【Bearish】
2. Key price levels:
- Intraday support: $88.54 USDT
- Intraday resistance: $91.67 USDT
3. Trading reference:
- Short (trend-following): Entry $89.63-$90.07, take profit 1 $85.31 | take profit 2 $85.50, stop loss $96.08, position ≤ 15%
- Alternative long (oversold light position): Stabilize below $87.50 with a light position, stop loss $87.20
#Gate广场五月交易分享
SOL-0.43%
View Original
  • Reward
  • Comment
  • Repost
  • Share
📊 SOL Daily Trend Forecast
**Yesterday's Prediction Review:**
- Yesterday's direction: 【Bullish】 | Actual: 【Bearish】
- Yesterday's key price levels: Support $90.28 / Resistance $94.66
- Actual movement: Partially consistent
- Accuracy score: 0 wins, 1 loss (cumulative)
---
**1. Today's direction: 【Range Volatility】**
**2. Key price levels:**
- Intraday support: $89.02 USDT
- Intraday resistance: $97.68 USDT
**3. Trading reference:**
- Short (trend-following): Entry $92.61–$93.53 | Take profit 1 $87.80 | Take profit 2 $84.90 | Stop loss $95.77
- Long (oversold light p
SOL-0.43%
View Original
  • Reward
  • Comment
  • Repost
  • Share
1. Today's SOL outlook: 【Bullish】
2. Key price levels:
- Intraday support: $90.28 USDT (4H Bollinger lower band)
- Intraday resistance: $94.66 USDT (4H Bollinger middle band)
- Secondary resistance: $96.99 USDT
3. Trading references:
- Long (priority): Entry $90.86–$92.23, take profit at $94.66, stop loss at $89.80, position ≤20%
- Short (alternative): Only consider if it breaks and stabilizes above $94.66, stop loss at $97.50
4. Risk warning: 1D RSI at 67, moderate level, not deeply oversold; current position near Bollinger lower band support, watch for stop loss if it falls be
View Original
  • Reward
  • Comment
  • Repost
  • Share
📊 #实盘第3天#
【Market Report】
ETH is around $2364 at 8 a.m. today, with a 24-hour high of $2399 and a low of $2346, with volatility narrowing to 2.2%, and trading volume shrinking compared to yesterday.
【My Plan】
Last night at $2378, it rose to $2384 during the night, and this morning it fell back to $2364—this kind of oscillating market is the most annoying, with no clear direction.
Waiting for two signals:
① RSI<30 (oversold) → Possibly buy the dip and go long
② RSI>70 + volume breakout above $2400 → Possibly chase the long position
Neither are present now, so I am honestly observing.
【Today’s
ETH-0.78%
View Original
  • Reward
  • Comment
  • Repost
  • Share
📈 #实盘第2天#
【Yesterday's Market】
Yesterday, ETH had a roller coaster ride, with a high of $2398 and a low of $2312, a fluctuation of $86.
In the afternoon, I opened a position, took 7 long contracts, and closed everything in the early morning (lost 0.056U, high transaction fees).
Then I continued to stay on the sidelines, monitoring the market from 7 PM, RSI kept fluctuating between 48-54, not reaching the entry threshold.
→ Did not take any action, signals were not strong enough.
【Why not chase longs】
The EMA bullish alignment is still intact, but RSI hasn't reached oversold (<40), and MACD is
ETH-0.78%
View Original
  • Reward
  • Comment
  • Repost
  • Share
Still raising shrimp? Now I’m raising horses—hoping they’ll be able to help everyone. I have opened a live trading account; everyone, feel free to take a look.
View Original
  • Reward
  • Comment
  • Repost
  • Share
📊 Live Trading Day 1# 27U by the end of the year becomes 10,000U
My plan:
💰 Now: 27 U
🎯 By the end of the year: 10,000 U
📈 Gap: 999,973 U
How to achieve this?
- Earn 0.5%-1% each time
- Compound interest rolling
- No anti-liquidation, no margin calls
Last night made 2 trades:
🅰️ First trade: loss of 0.02 U
🅱️ Second trade: profit of 0.13 U
💰 Account: 27.54 → 27.65 U
No trades now, RSI back to 47, waiting further.
Do you think 27U can turn into 10,000U? Share your thoughts in the comments.
Follow me, let's witness this together.
View Original
  • Reward
  • Comment
  • Repost
  • Share
Long, short, single, double, eat
View Original
post-image
  • Reward
  • Comment
  • Repost
  • Share
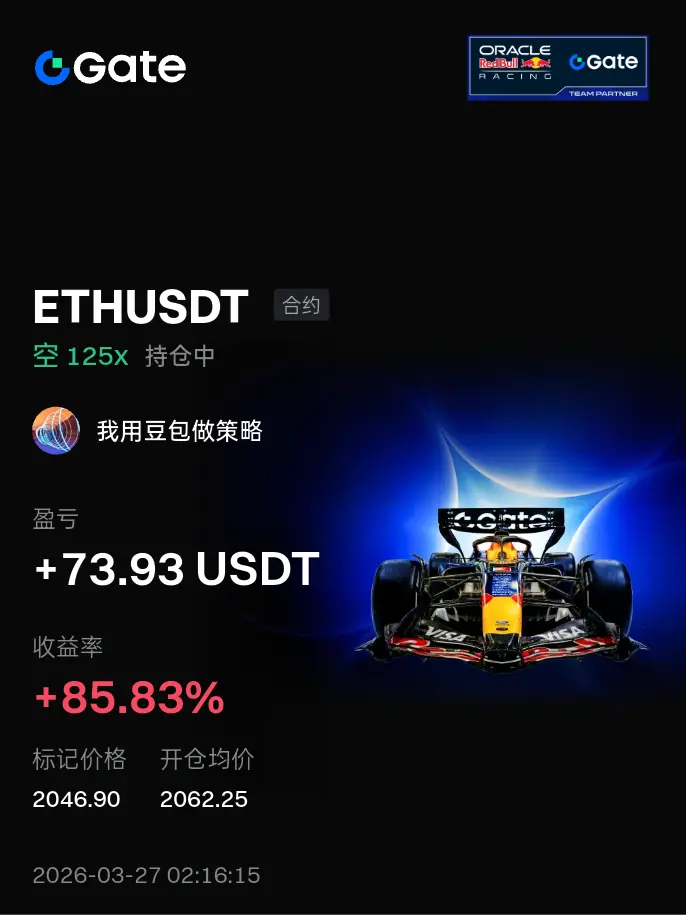
Close long positions first, short ETH at 2330
View Original
  • Reward
  • 1
  • Repost
  • Share
BrotherXinPlaysSolana:
Target 2300
# 📊 Overall Market Situation
- The selling pressure in the market has significantly weakened, and a short-term slight pullback is a good opportunity to buy on dips
- Positive news has boosted investor sentiment, and yesterday’s crypto market collectively strengthened
- Bitcoin surged to around 79,400 and then steadily strengthened at high levels, with bearish pressure weakening
- The current trend has slightly pulled back for adjustment, but the downward space is limited, with prices staying above the key support of 77,000
### 📈 Technical Pattern Analysis
- Daily chart: Strong and full bulli
BTC-0.15%
ETH-0.78%
View Original
  • Reward
  • Comment
  • Repost
  • Share
Core Conclusions
Short-term Strategy: Short on rallies
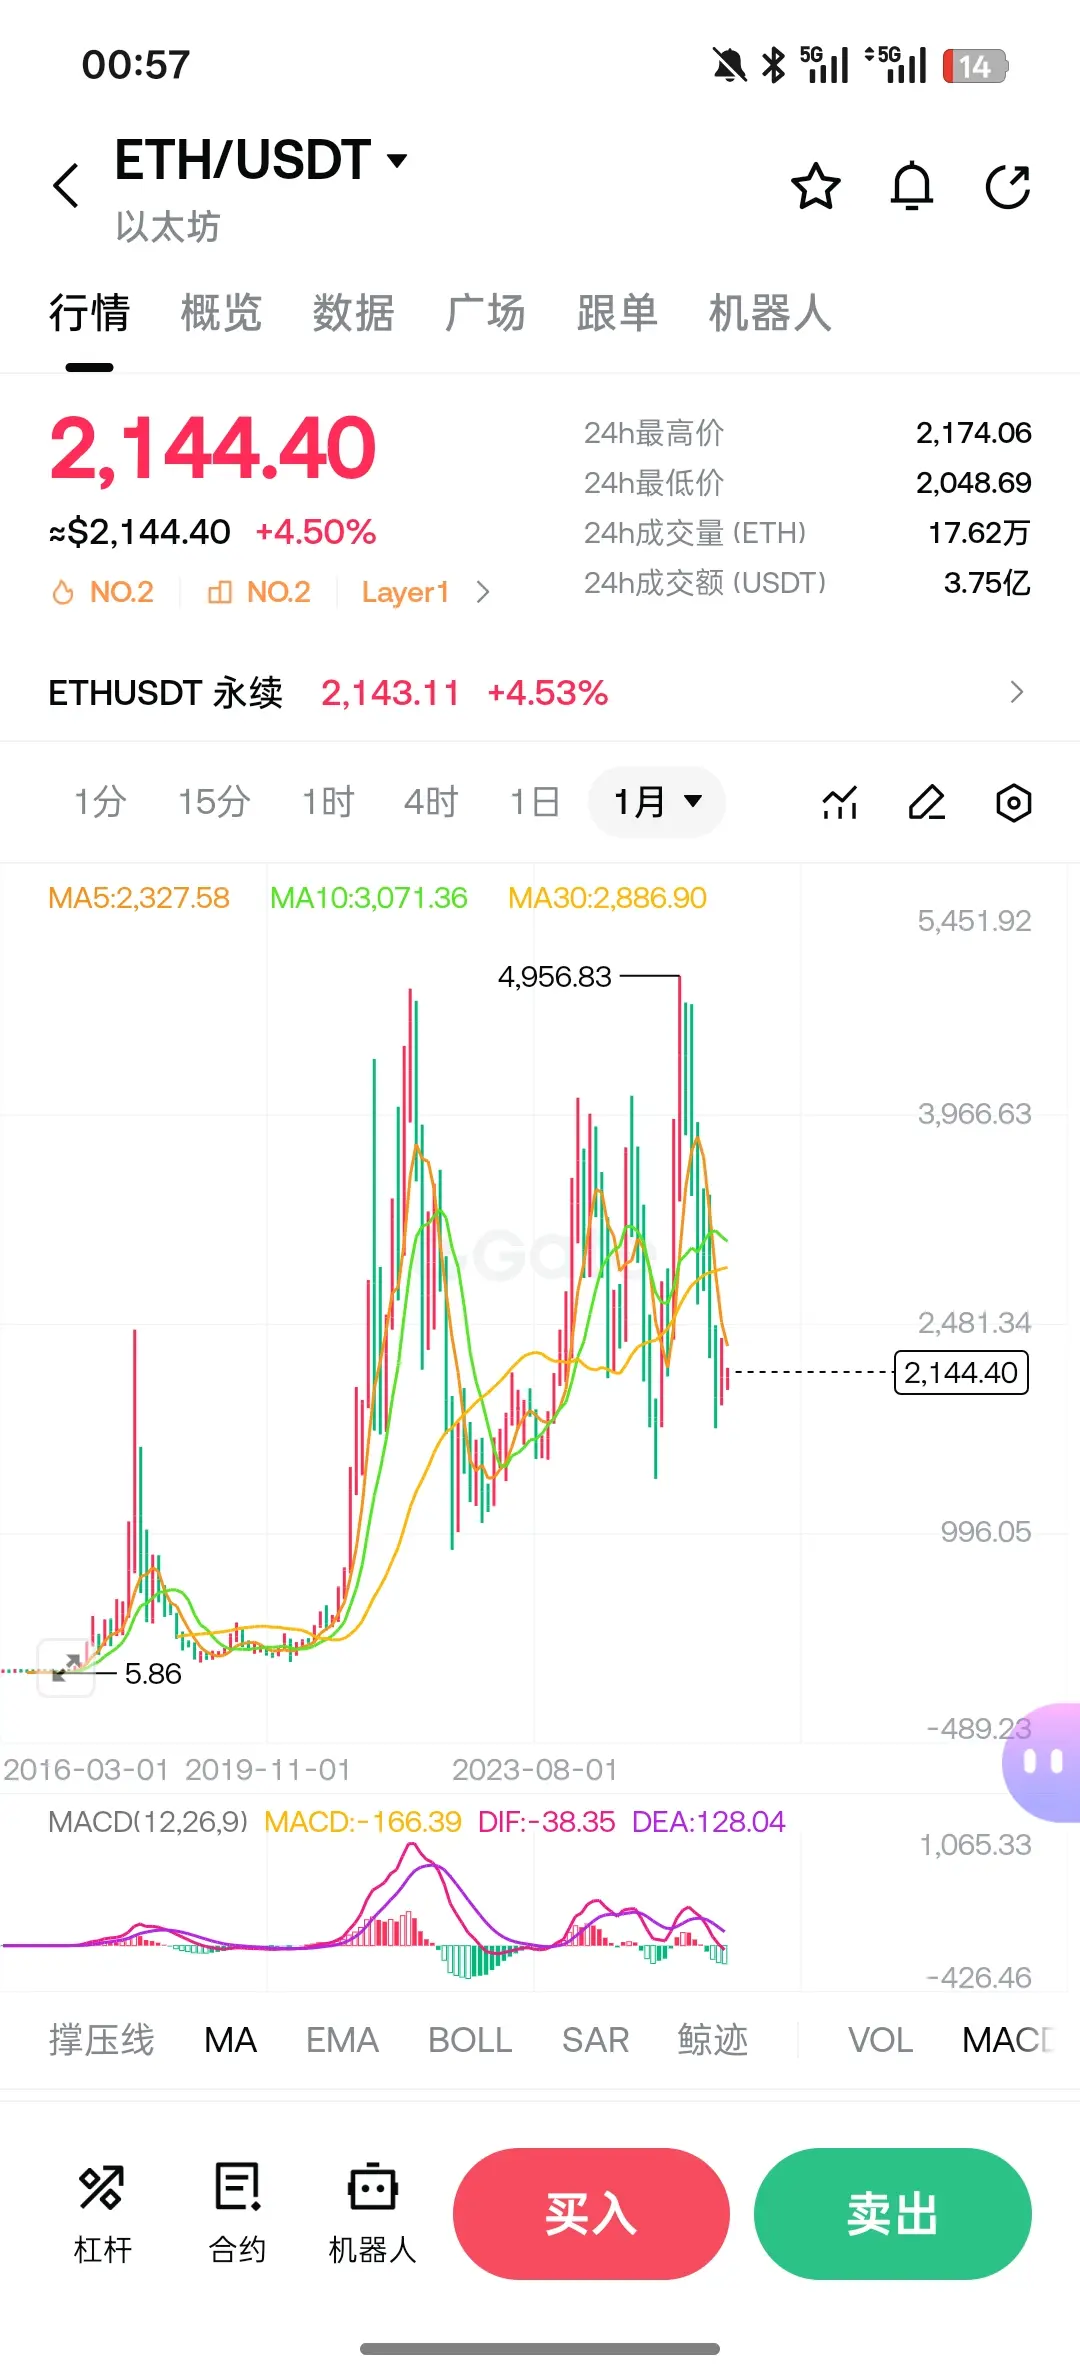
Currently, ETH is in a weak consolidation phase with whale short positions being laid out. The daily moving averages are in a bearish alignment, with heavy resistance above. The risk of going long is very high. It is recommended to prioritize shorting on rebounds, strictly control leverage, and avoid chasing highs.
I. In-depth Technical Analysis
Based on the 4-hour candlestick chart you provided:
1. Moving Average System (Bearish Alignment): The price is currently below MA5 (2099.10), MA10 (2121.98), and MA30 (2079.55). The short-term movi
ETH-0.78%
BTC-0.15%
View Original
  • Reward
  • Comment
  • Repost
  • Share
Worth referencing
View Original
GetLiquidatedCounterattack
#Gate广场四月发帖挑战
April 2026 ETH Key Event Calendar (Ranked by Impact Weight + Time)

I. Extremely High-Weight Events (Directly Determine Bullish or Bearish Direction)

1. April 10: U.S. March CPI Data Release

- Impact Level: Highest
- Logic:
- CPI cools more than expected → rate-cut expectations rise → ETH bulls push higher
- CPI rebounds more than expected → rate cuts are delayed → risk assets face collective pressure
- For ETH’s price action: determines whether this week trends upward in a range or quickly pulls back

2. Ethereum Glamsterdam Upgrade Testnet Progress

- Time: continues to ferment throughout April
- Key checkpoints: testnet vulnerabilities, node voting, confirmation of the mainnet launch time
- Impact:
- Smooth progress → continuous positive catalysts, supports high-level range trading
- Serious bugs appear → short-term sharp negative plunge

3. After Bitcoin Halving: Capital Flows & BTC Trend

- Time: throughout April
- Impact Level: Extremely High
- Logic: ETH is highly linked to BTC; Bitcoin strength or weakness directly determines ETH’s upper limit


II. High-Weight Events (Catalysts for Swing Trading)

4. Around April 15: Ethereum Economic Zone (EEZ) ecosystem project rollout progress

- Impact Level: High
- Highlights: L2 interoperability, TVL growth, whether large holders’ funds enter
- Positive result → pushes ETH to break out into an independent move

5. April 23–30: Federal Reserve meeting minutes / officials’ speeches

- Impact Level: High
- Focus: whether it releases clear rate-cut signals, and how it views inflation
- More dovish → bullish; more hawkish → bearish

6. April 30: U.S. March Core PCE Data (the Federal Reserve’s core inflation indicator)

- Impact Level: High
- Determines the direction of the market from late April to early May


III. Medium-Weight Events (Short-Term Volatility, Short-Term Opportunities)

7. ETH spot ETF fund flows (updated daily)

- Continuous net inflows → strong upside
- Continuous net outflows → pressure at high levels, prone to pullbacks

8. Ethereum staking amount, and data on tokens burned

- Staking keeps increasing + burns expand → stronger deflationary pressure → bullish support
- Large-scale unstaking → increased sell pressure → negative catalyst

9. DeFi TVL and Layer2 active data

- Continued recovery → fundamental support
- Continued decline → market sentiment weakens


IV. Low-Weight but Could Trigger Sudden Black Swan Events

10. Middle East geopolitical situation and oil price fluctuations

- Situation escalates → global risk appetite declines → ETH follows down

11. Crypto regulatory news (U.S./European Union)

- Strong regulatory stance → short-term rapid sell-off

 Trading time and pacing

- 4.6–4.9: Before CPI, trade cautiously with consolidation; mainly low volatility, suitable for light positions
- 4.10 (that day): data determines direction; follow on breakouts/breakdowns
- 4.11–4.20: Glamsterdam upgrade news + fund flows dominate the swing
- 4.23–4.30: the Fed’s stance + PCE determine whether month-end closes green or red
repost-content-media
  • Reward
  • Comment
  • Repost
  • Share
666
GetLiquidatedCounterattack
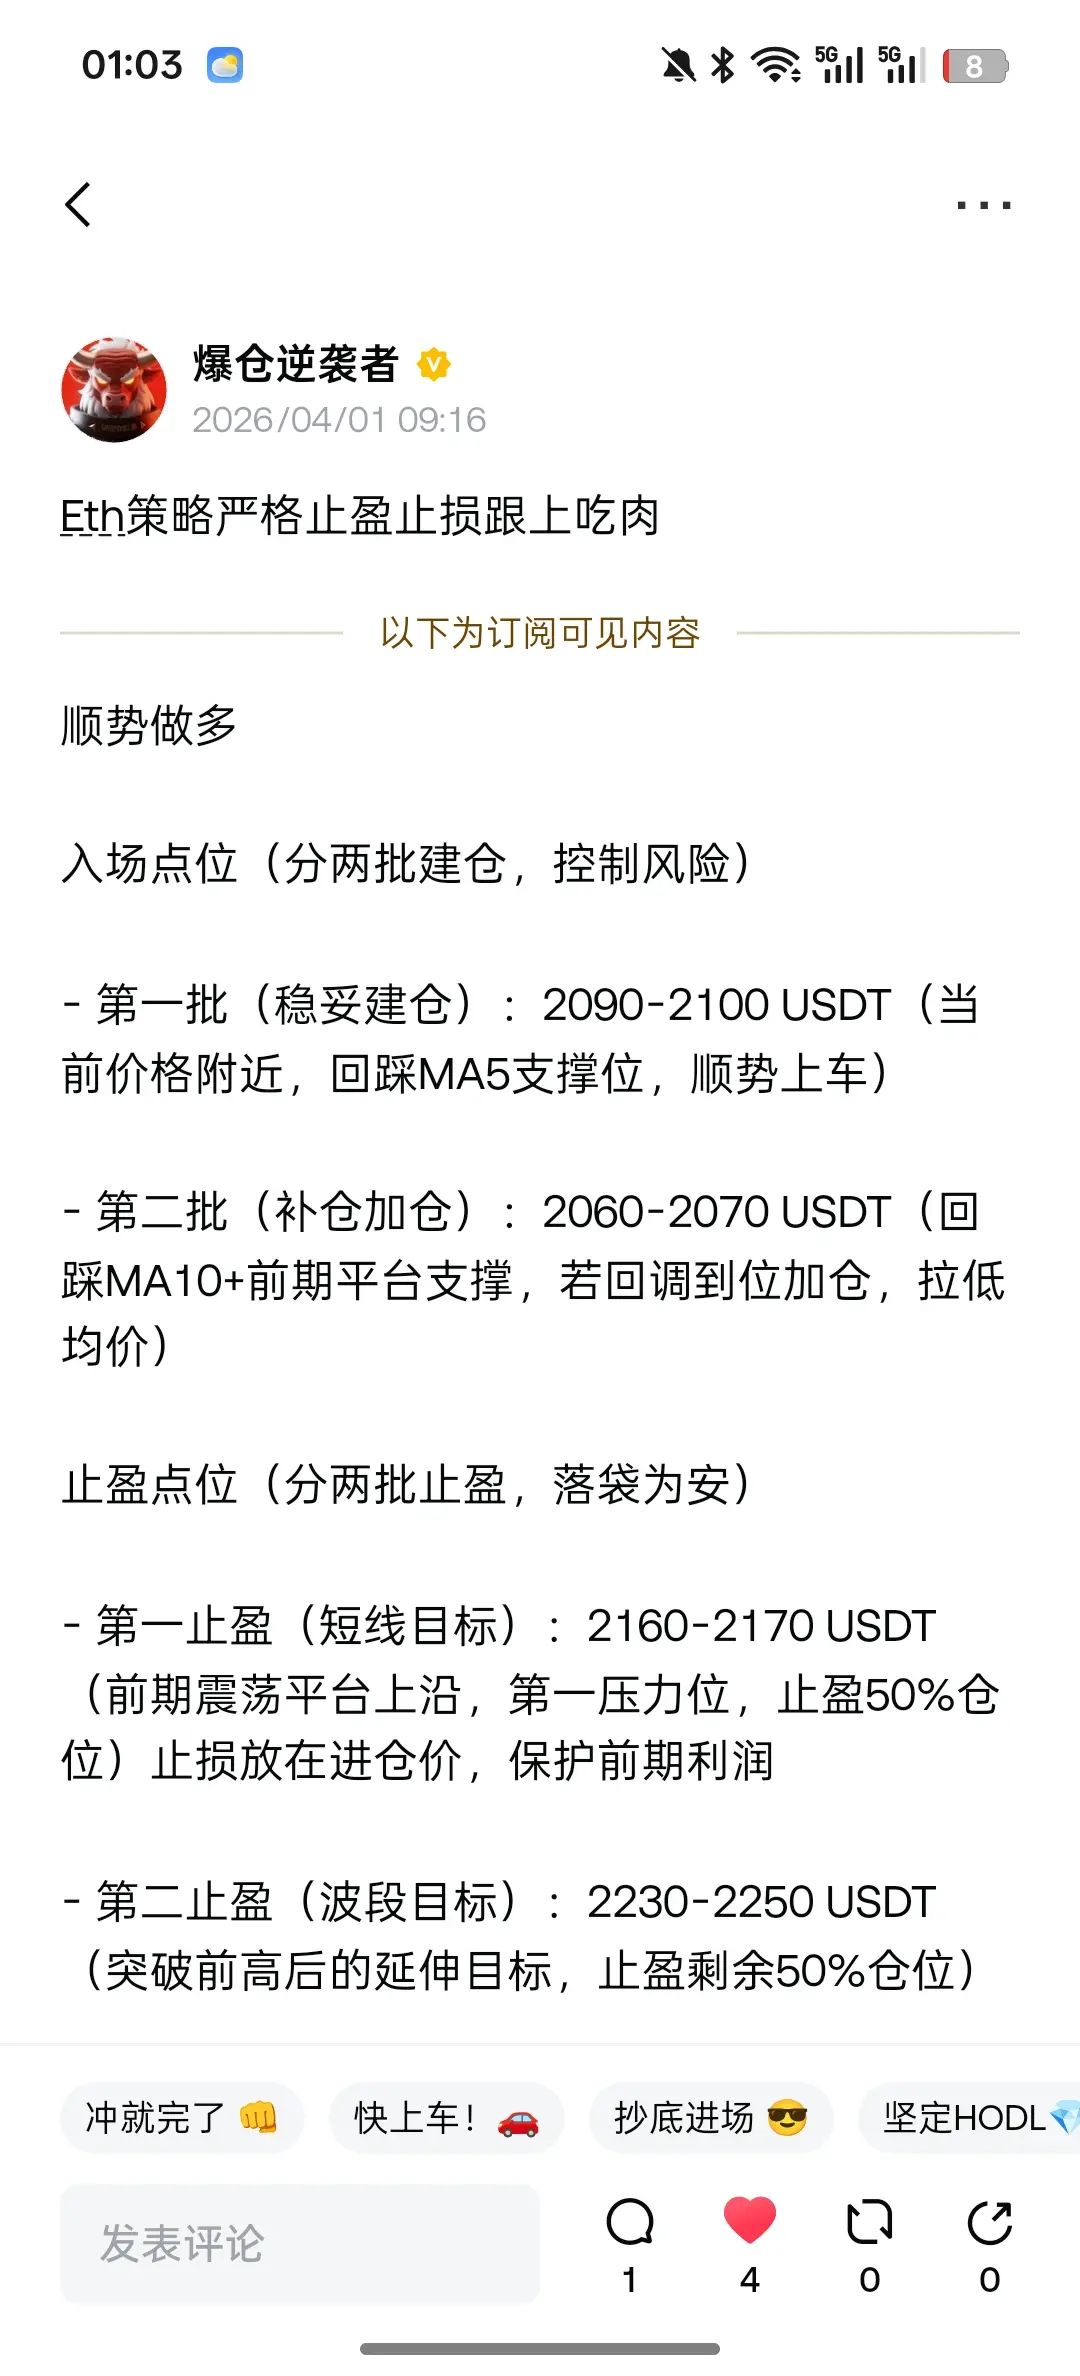
ETH takes profit at the first position. The top subscribers who have invested heavily can just watch the operations. Remember to set proper stop-loss levels. Today is April 1st, and I’ve started recording gains and losses. Subscription discounts are ongoing.
repost-content-media
  • Reward
  • Comment
  • Repost
  • Share
From the chart and EMA parameters (12, 50, 100), it is clear that the current market is in a pronounced downtrend, with short-term, medium-term, and long-term moving averages all arranged in a bearish configuration, and the price has broken below a key support level.
Trading Strategy
- Side: Short on rallies
- Entry point: Enter when the price rebounds to around 3328.46 (this level is a recent rebound resistance and a good opportunity for shorting)
- Stop-Loss point: Set above 3396.50 (to prevent unexpected price rebound and break above resistance, controlling risk)
- Target point: First targe
View Original
  • Reward
  • Comment
  • Repost
  • Share
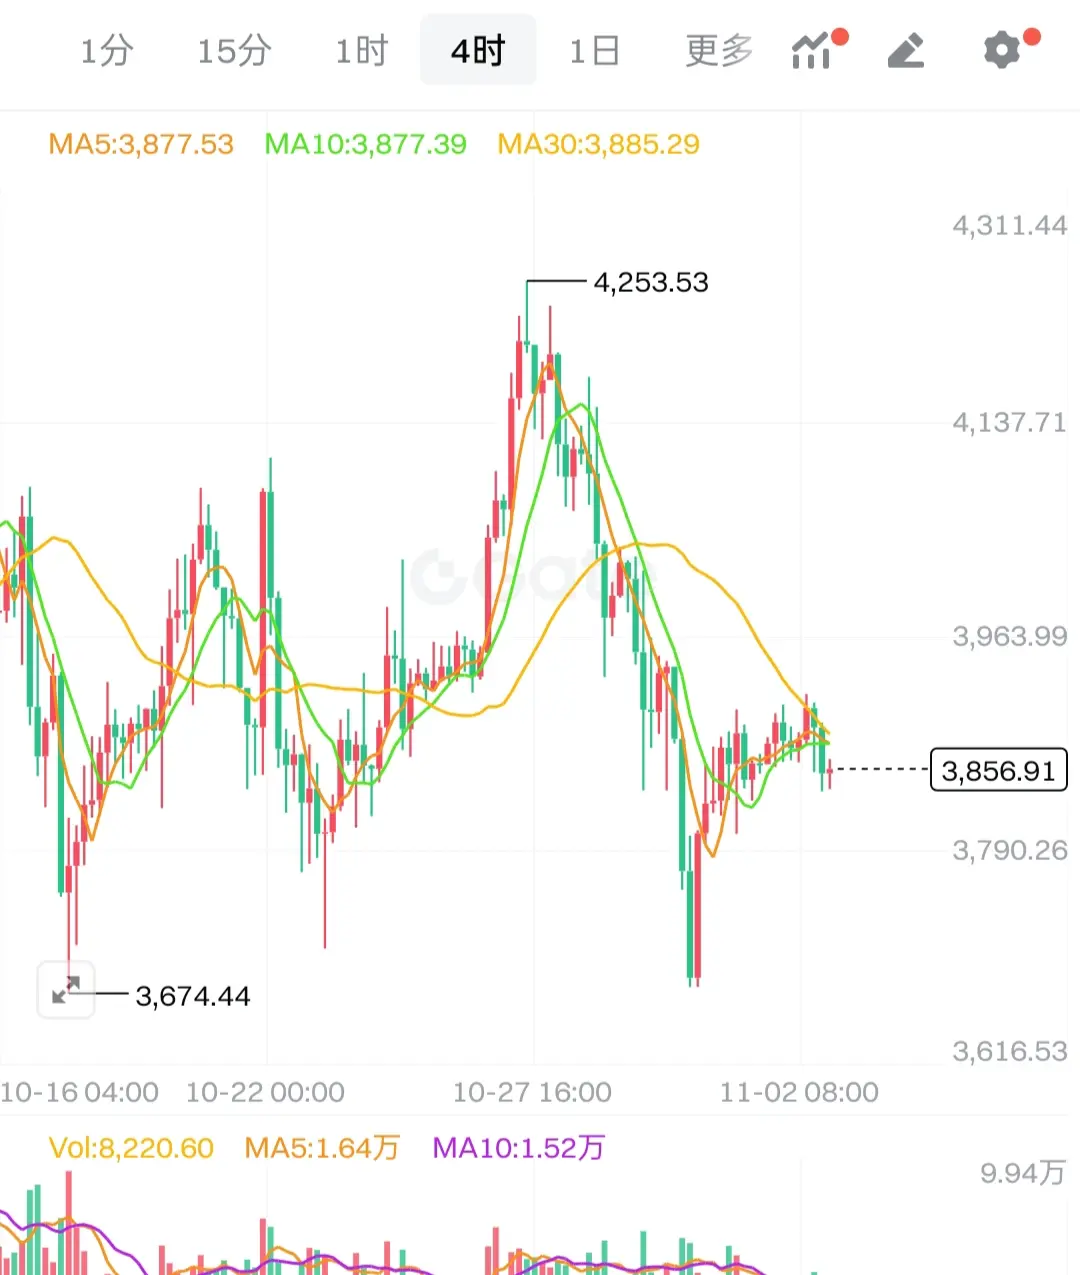
Combined analysis of trend, moving averages (EMA), and key levels:
1. Trend and Moving Average Analysis
From the 4-hour candlestick chart and EMA parameters (12, 50, 100):
- The price has sharply fallen from a high of 4253.53 and is currently consolidating around 3856.91, indicating a weak correction after a decline.
- EMA12 (short-term, orange), EMA50 (mid-term, green), and EMA100 (long-term, yellow) are arranged in a bearish order (short-term below mid-term and long-term), suggesting the current trend is bearish.
2. Trading Strategies and Levels
1. Bearish Bias (Follow the trend, suitable fo
View Original
post-image
  • Reward
  • Comment
  • Repost
  • Share
  • Pinned