ZhangShuofeng

vip
Age 0.2 Year
Peak Tier 0
No content yet
Although semiconductors continue to slide lower, there are signs that money is frantically buying the dip.
Yesterday, SOXX recorded a net inflow of $5.4 billion in a single day, directly setting a new historical record—and it was 4 times the previous highest record. If we also factor in the funds behind the 3x leveraged long semiconductor ETFs, then the total amount of money flowing into long semiconductor ETFs yesterday reached $7.1 billion.
Bloomberg ETF analyst Eric Balchunas believes that a level of activity on this scale is almost impossible to be driven by retail investors; it looks more
SOXX-0.09%
View Original
  • Reward
  • Comment
  • Repost
  • Share
On July 7, ETH spot ETF total holdings rose to 5,338,916.95 ETH
The net inflow on that day was 12,165.87 ETH, with fund recovery momentum clearly stronger than BTC.
So far this week, cumulative net inflow stands at 5,504.98 ETH. Over the last 7 trading days, it has also turned back to a small net inflow of 2,257.02 ETH, indicating that short-term fund sentiment for ETH has started to improve.
ETH2.55%
BTC1.10%
View Original
  • Reward
  • Comment
  • Repost
  • Share
On July 7, the total holdings of BTC spot ETFs rose to 1,213,269.46 BTC
That day saw a small net inflow of 140.24 BTC, with the capital flow turning from continuous outflows in previous days to a slight recovery, but the strength was not strong.
This week's cumulative net inflow so far is 4,390.83 BTC, indicating that short-term pressure has eased somewhat. However, over the last 7 trading days, there is still a net outflow of 12,503.82 BTC, so the overall trend cannot be considered a complete reversal.
BTC1.10%
View Original
  • Reward
  • Comment
  • Repost
  • Share
BTC this week focuses on whether the 62000-62200 range can hold. If the daily & weekly candlestick bodies do not break below this range, the probability increases that the rebound expands to target the entire red decline in Figure 1. Under this path, there will be at least one more upward move later;
If it breaks below 62000 and cannot reclaim it afterward, be cautious of the end of the rally starting from 57800.
In the past two days, I took two short-term short trades. There should be more trading opportunities in the coming days, depending on whether the key level will be retested. Depending
BTC1.04%
View Original
  • Reward
  • Comment
  • Repost
  • Share
Today, the situation in the US stock market—especially for AI and semiconductors—is still not ideal. The indices it drives have all started to fall. Recently, I wrote about seven or eight related tweets, and you can see them in the pinned posts. Many friends, after moving from crypto into the US stock market, still use a rather aggressive approach. I find it hard to comment on that, but for the US stock market, the importance of data may be even more meaningful.
For example, the flow of funds—why institutions and hedge funds are exiting tech stocks. Also, where exactly this round of retail inv
BTC1.02%
MSTR0.78%
View Original
  • Reward
  • 1
  • Repost
  • Share
GateUser-60acfe95:
Doesn't a small amount of funds suffice to prove potential risks, and might the risks be relatively large?
On July 6, the total holdings of ETH spot ETF fell to 5,326,751.08 coins
Net outflow on that day was 6,660.89 ETH, ranking 173rd in the historical sample for single-day outflow, which is not extreme in itself.
Cumulative net outflow this week so far is 6,660.89 ETH, and the net outflow over the past 7 trading days is still 57,866.80 ETH. The capital side has not yet seen a significant recovery like BTC.#eth $ETH
ETH2.53%
View Original
  • Reward
  • Comment
  • Repost
  • Share
On July 6, the total holdings of BTC spot ETFs rebounded to 1,212,415.16 BTC.
Net inflow on that day was 4,250.59 BTC, ranking 124th in historical samples, not extreme.
However, the cumulative net inflow this week is currently 4,250.59 BTC, while the net outflow over the past 7 trading days is still 24,541.16 BTC, indicating short-term recovery, but the pressure from previous consecutive reductions has not been fully digested.#btc $BTC
BTC1.04%
View Original
  • Reward
  • Comment
  • Repost
  • Share
MSTR Market Analysis 2026.07.06
Today MicroStrategy dropped this "bomb" of selling BTC into the market, and BTC simultaneously fell by 2700 points.
It is normal for selling BTC to be interpreted as bearish. After all, MicroStrategy's biggest narrative in the past was buying BTC. Now they have started selling BTC to cover preferred stock dividends and cash reserves. This indicates that the company has moved from simply expanding its BTC holdings to a stage that places more emphasis on cash flow and capital structure balance. More important than paying attention to the act of selling BTC itself
MSTRX0.32%
View Original
  • Reward
  • Comment
  • Repost
  • Share
This week is finally coming to an end. Next week won’t have any very important macroeconomic data. The only item that’s slightly more important would be the Fed meeting minutes, but personally, I don’t think they carry much significance—after all, the conflict between the US and Iran has already ended in the meantime. Speaking of the conflict, let’s talk about the trend of WTI. It’s basically pretty much in line with what I expected: pushing it down from around $68 is getting harder, especially since around $65 is already the pre-war average level.
At this price, continuing to short WTI doesn’
BTC1.04%
View Original
  • Reward
  • Comment
  • Repost
  • Share
That’s exactly how it is. From the data, it’s clearly evident that many retail investors either don’t know how to buy AI, or they worry that after they buy, there will be a pullback—so they choose to buy an index. And the more the price drops, the more they buy, because in the U.S., especially the S&P 500, has been rising in the long run.
So the apparent contradiction between institutional exits and retail investors chasing lower prices actually makes sense in terms of operations. Institutions are looking to earn more stable returns, while retail investors are essentially going long on the U.S
SPYX0.54%
View Original
  • Reward
  • Comment
  • Repost
  • Share
Korean Stock Market: Invisible Leverage, Visible Surge
The KOSPI index is rising, and the VIX is also at a high level — a typical high-volatility rally.
On the surface, Korean retail investors' margin balance accounts for only 0.8% of free-float market cap, so leverage seems not excessive. But the devil is in the details: leveraged ETF exposure has surged from 1% last year to 2.5%-3% now.
Adding this hidden part, the actual leverage pressure is enormous.
What's worse is the ETF's "daily rebalancing" mechanism: buy when it rises, sell when it falls. This effectively installs an accelerator for
View Original
  • Reward
  • Comment
  • Repost
  • Share
In the past couple of days, I've seen many discussions about CRCL. My personal view remains consistent with what I said earlier: if USDC still relies on U.S. Treasury yields as its main source of profit, then any stablecoin with potential in the payment space, whether it's Open USD or Close USD, will hurt USDC's stock price.
I think the recent drop in CRCL is not solely due to Open USD. Whether Open USD can officially launch is uncertain, but behind the scenes, payment channels have emerged that are willing to pay for stablecoins, and there are enterprises and institutions willing to use stabl
CRCLX4.97%
View Original
  • Reward
  • Comment
  • Repost
  • Share
Today, we are mainly looking at the data for KOSPI and KOSPI VIX.
KOSPI is the most core broad market index of the Korean stock market, which can be understood as the Korean version of the S&P 500 or the CSI 300, reflecting the overall performance of major listed companies in South Korea.
KOSPI VIX is the volatility index of the Korean market (similar to the VIX in the U.S. stock market), mainly reflecting the market's expectations for future volatility of the KOSPI 200. Simply put, KOSPI represents the price direction, while KOSPI VIX represents the expected market volatility.
Current data sh
BTC1.04%
View Original
  • Reward
  • Comment
  • Repost
  • Share
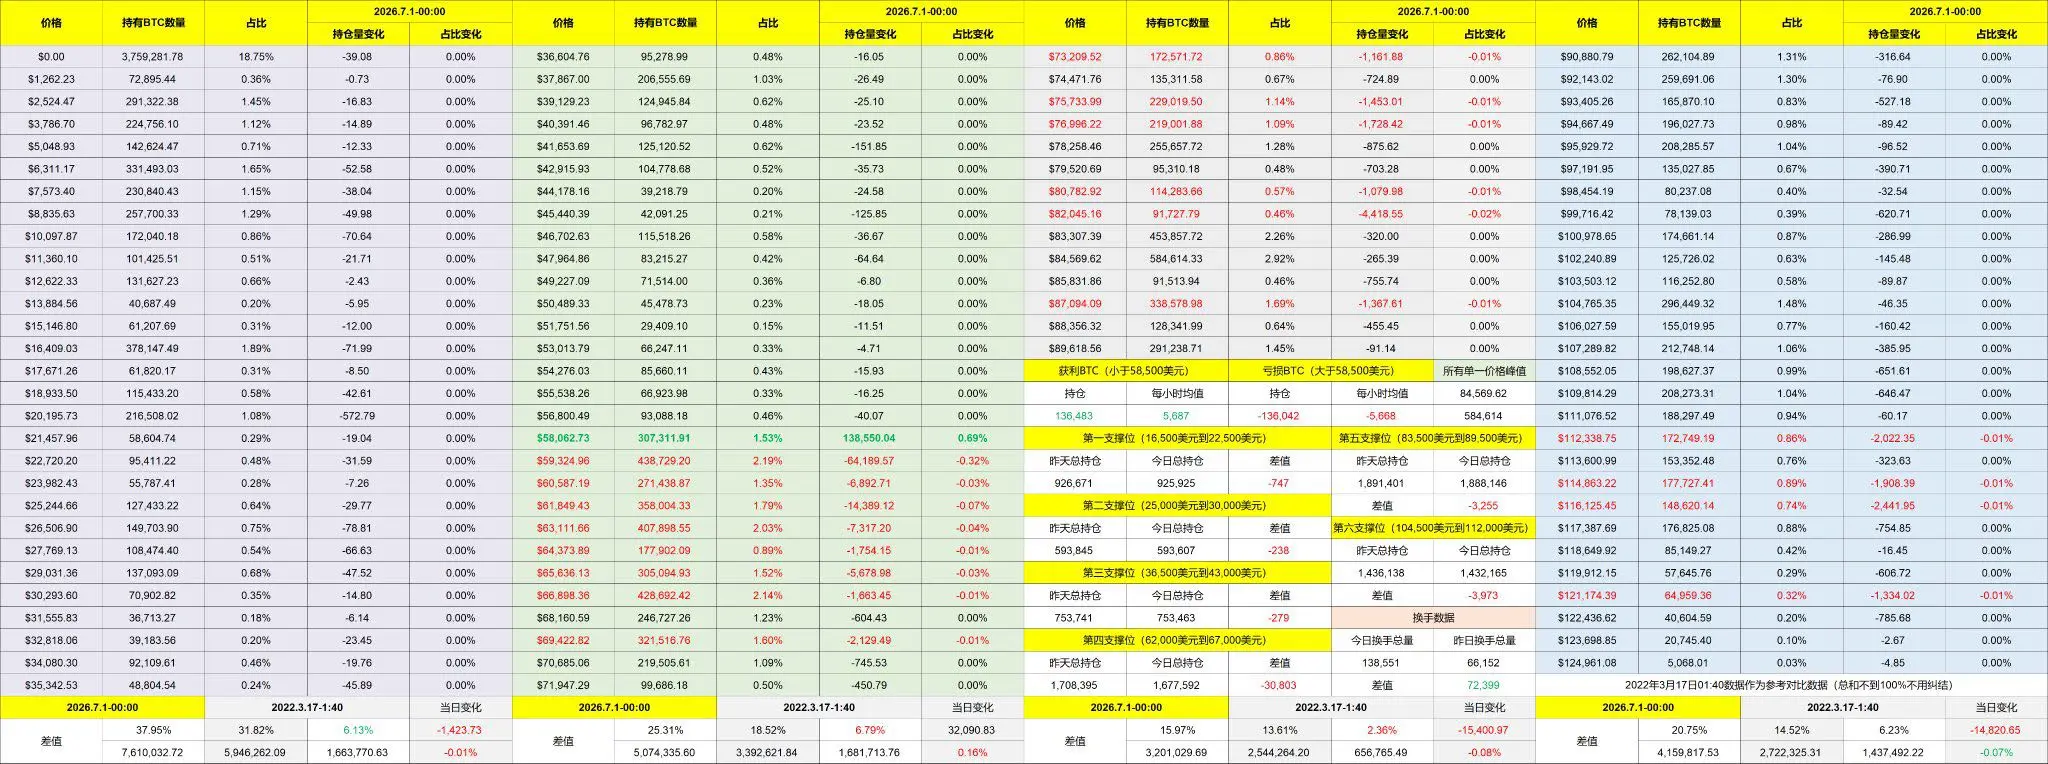
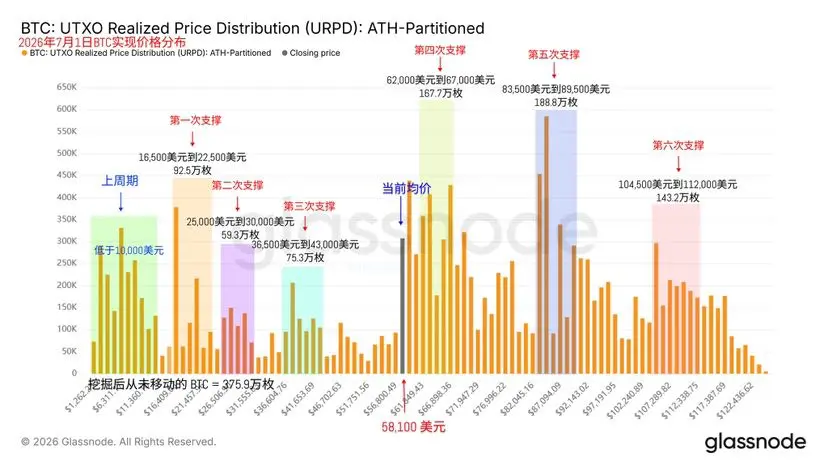
BTC Market Analysis 2026.07.03
BTC has rebounded from 58700 to near the green Gann angle line 3/1 (61950). Next, pay attention to tomorrow's daily close and this week's weekly close:
If both the daily and weekly candlestick bodies close above 61950 and subsequently complete a support-resistance swap here, confirming the support is valid, then the rebound magnitude may expand to counter the red segment decline shown in the chart. Breaking above 63730 would increase the probability of an expanded rebound.
If the daily and weekly closes are below 61950, the rebound from 58700 will be temporarily
BTC1.04%
View Original
  • Reward
  • Comment
  • Repost
  • Share
Friday is a U.S. holiday, so U.S. stocks will not open. Then comes a three-day holiday. The recent two days' performance of U.S. stocks has not been great, mainly due to the pullback in the semiconductor sector. The reasons have been mentioned in the two pinned tweets. Since last week, institutions and hedge funds have been exiting tech stocks, and those who took over afterward should mostly be retail investors. The subsequent trend still needs to be observed based on data.
Have institutions and hedge funds re-entered, or are they still waiting for a better time? Letting the market cool down a
BTC1.04%
View Original
  • Reward
  • Comment
  • Repost
  • Share
On July 1, the total holdings of ETH spot ETFs rebounded to 5,330,165.98 ETH.
The net inflow for the day was 23,118.86 ETH, which is not extreme among historical samples, ranking roughly outside the top quarter of historical inflows.
However, this week has turned into a cumulative net inflow of 10,883.48 ETH, indicating that ETH ETFs have at least seen a short-term capital recovery.
But over the past 7 trading days, there is still a net outflow of 116,906.75 ETH, meaning it is too early to say the trend has fully reversed.
ETH2.55%
View Original
  • Reward
  • Comment
  • Repost
  • Share
On July 1, the total holdings of BTC spot ETFs fell to 1,204,955.50 BTC.
Net outflows for the day were 4,620.64 BTC. In the table’s history of single-day outflows, this ranks 48th—neither the most extreme nor the least.
However, over the past 7 trading days, the cumulative net outflow has already reached 41,694.38 BTC, and the ongoing sell-down pressure remains near the very top of historical rankings. #btc $BTC
BTC1.04%
View Original
  • Reward
  • Comment
  • Repost
  • Share
Today’s biggest hotspot is undoubtedly OpenUSD. At first, I thought this news was what dragged $BTC down, but upon closer inspection, it turns out Bitcoin’s decline happened nearly an hour earlier than the announcement. Add to that the fact that tonight’s U.S. stock market performance is pretty good, yet BTC inexplicably drops more than 3% with no obvious negative catalyst—it really is a bit of a “makes no sense” sell-off. Still, it’s fine; the 59,000 dual-currency order I posted today will most likely be filled tomorrow.
It reminds me of something I’ve kept emphasizing over the past two years
BTC1.04%
View Original
post-image
post-image
  • Reward
  • Comment
  • Repost
  • Share
On June 29, total holdings of ETH spot ETFs rebounded to 5,325,111.49
That day saw a net inflow of 5,828.99 ETH, ending the pressure from previous consecutive large outflows.
However, the cumulative net outflow over the past 7 trading days still stood at 174,580.87 ETH, so this day seems more like a brief recovery after consecutive reductions, and it cannot yet indicate a reversal in the capital trend. #eth $ETH
ETH2.53%
View Original
  • Reward
  • Comment
  • Repost
  • Share
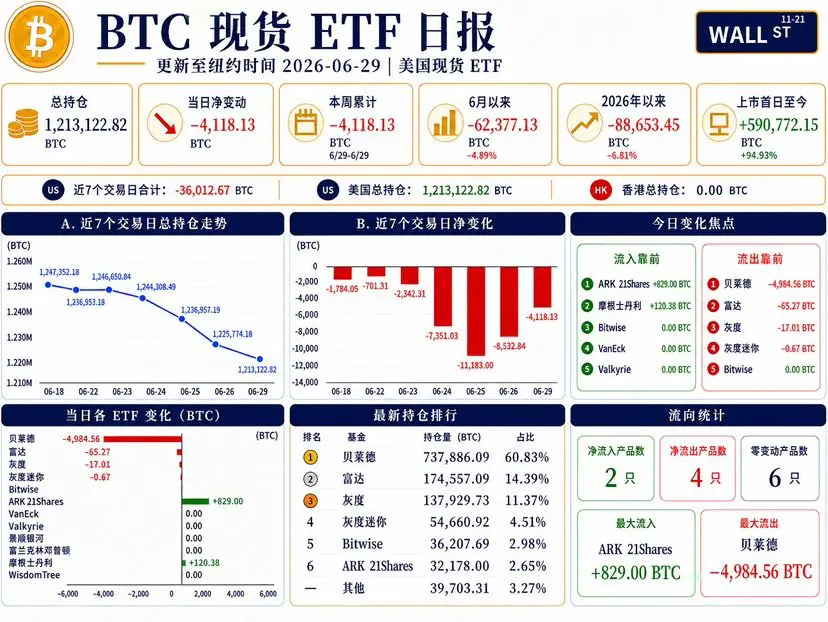
On June 29, total BTC spot ETF holdings fell to 1,213,122.82 BTC
Daily net outflow was 4,118.13 BTC, although the daily outflow was lower than the extreme levels on June 25 and June 26.
However, the cumulative net outflow over the past 7 trading days has reached 36,012.67 BTC, which is a historically very high consecutive reduction pressure range. #btc $BTC
BTC1.04%
View Original
post-image
  • Reward
  • Comment
  • Repost
  • Share
  • Pinned