CanAMiracleHappenToMe?

vip
Age 0.2 Year
Peak Tier 4
No content yet
1
SummitCapitalMvp
Top Capital | Loyal Fan Perk🧧
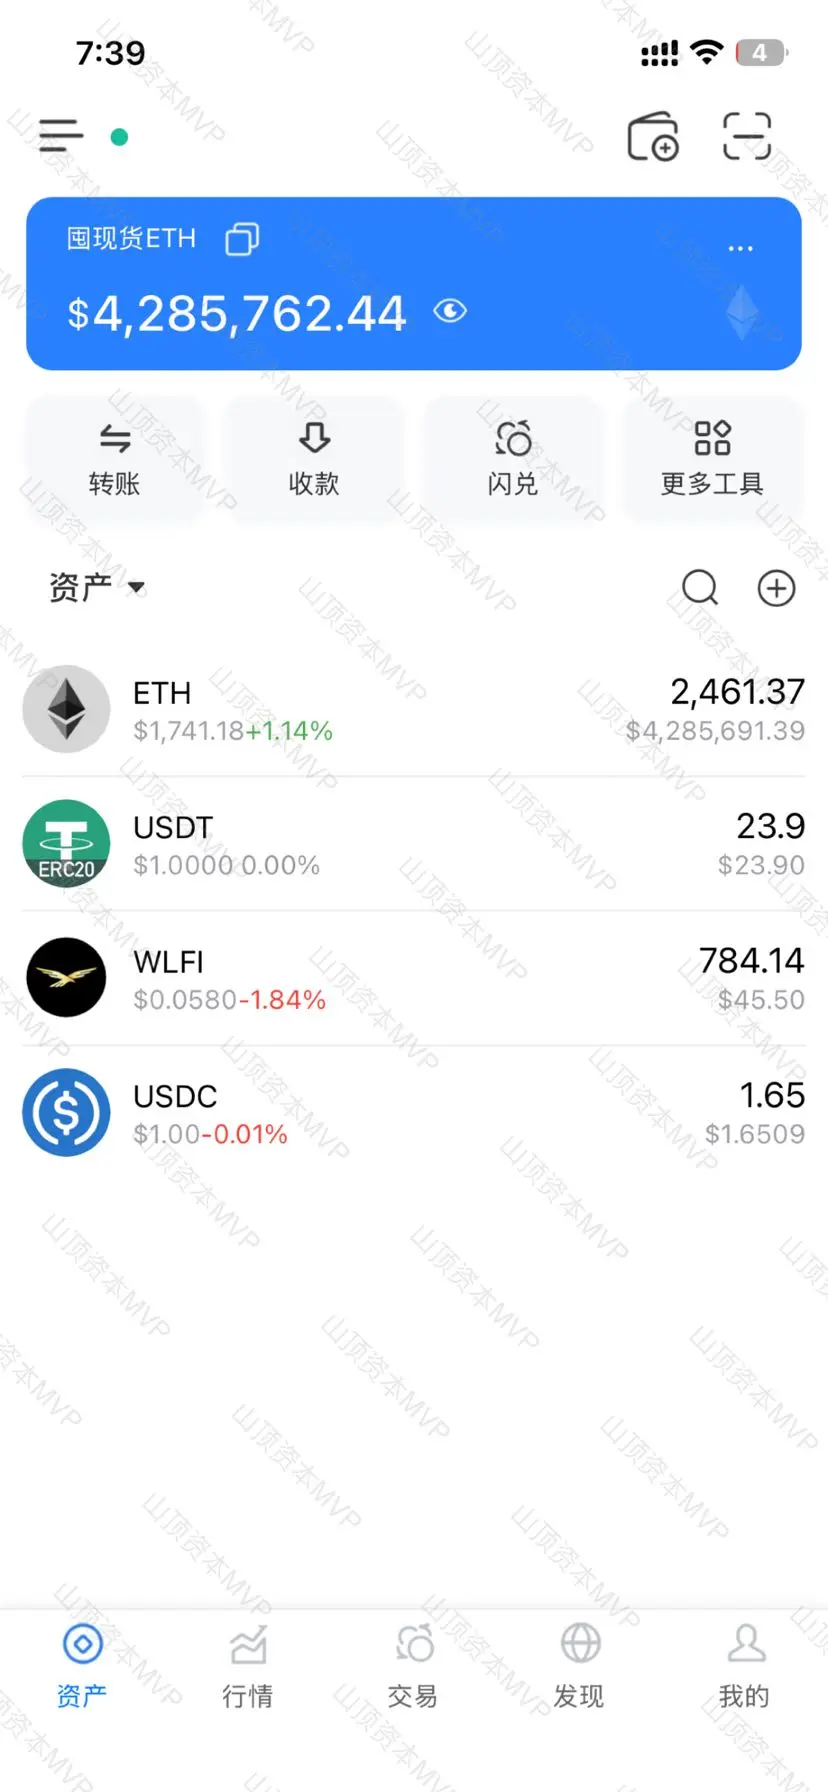
10*0.1ETH
Just reply with the UID.
Once we’ve “met and got acquainted,” you’ll get priority.
repost-content-media
  • Reward
  • Comment
  • Repost
  • Share
Bitcoin Technical Analysis (Daily + 4-Hour)
1. Medium-Term Trend
The daily chart is still running in a downward channel. Price is under pressure from the 50/100/200-day moving averages. All moving averages have turned downward. The larger-scale decline structure has not been fully reversed; this round is only an oversold rebound, not a reversal.
• Previous trough: $57,750 (the 21-month swing low). A strong double-bottom support formed here, with bearish momentum largely exhausting.
• The daily MACD green histogram continues to contract, and a bottom divergence is appearing. Downside momentum i
BTC1.84%
View Original
post-image
post-image
[The user has shared his/her trading data. Go to the App to view more.]
  • Reward
  • Comment
  • Repost
  • Share
Top
View Original
Original content no longer visible
  • Reward
  • Comment
  • Repost
  • Share
1. Overall Trend Assessment
NAS100 is currently in a medium-to-long-term bullish pattern that remains unbroken, but it is experiencing short-term pullbacks from highs and technical weakening, with significantly greater volatility than the Dow (US30). As a core index for tech growth stocks, its performance is highly correlated with the sentiment of the AI semiconductor sector and long-term US Treasury yields. The sharp decline on July 7 was directly triggered by profit-taking in the semiconductor sector, representing a phased valuation digestion during the upward trend, and has not yet formed a
NAS1001.86%
US300.31%
SPCX2.55%
NVDA-0.70%
AMD5.67%
View Original
post-image
post-image
  • Reward
  • Comment
  • Repost
  • Share
Bitcoin technical update
Core support & resistance (current price structure)
1. Support levels
• Short-term strong support: 63,500-63,800 USDT (current pullback absorption pivot; a break below would retest 62,800)
• Mid-term key support: 61,300 USDT (24H low), the launch point of this rebound; as long as it does not break effectively, the rebound structure remains intact
• Ultimate defense: Previous stage low of 57,800 USDT
2. Resistance levels
• First resistance: 64,700 USDT (daily high); if it breaks through with volume, the upside opens up to 67,000
• Mid-term strong resistance: 67,300 USDT
BTC1.84%
GT1.51%
View Original
post-image
post-image
[The user has shared his/her trading data. Go to the App to view more.]
  • Reward
  • Comment
  • Repost
  • Share
xau key support/resistance levels
Short-term intraday (1-3 days)
Resistance levels
1. First resistance: 4200-4230 (psychological level + short-term trapped area, first pullback point on breakout)
2. Strong resistance: 4250-4275 (downward trendline resistance, core bottleneck of this rebound)
3. Reversal resistance: 4300, 4480 (200-day moving average, only a firm hold can alleviate mid-term bearishness)
Support levels
1. Intraday strength/weakness boundary: 4140-4150 (today's consolidation center, holding suggests a bullish lean)
2. Strong support: 4100 (launch platform for this rebound, break
XAU1.17%
ETH0.66%
View Original
post-image
post-image
  • Reward
  • Comment
  • Repost
  • Share
Hey, they fucking kill me right after birth.
View Original
  • Reward
  • Comment
  • Repost
  • Share
Qiuqiu
View Original
Original content no longer visible
  • Reward
  • Comment
  • Repost
  • Share
Bitcoin daily level (Mid-term trend: range-bound and bearish; a rebound after decline repair)
• Overall setup: After the drop from the historical high of 126k, the mid-term bearish trend has not reversed. This move is only a technical rebound after the decline—not a reversal into a bull market.
• Indicators: A daily MACD golden cross at low levels, with bearish momentum weakening; price is still under strong pressure from medium- and long-term moving averages (MA50/MA200) above; RSI has not entered overbought territory, so rebound potential is limited.
• Key resistance (from near to far):
① 63
BTC1.84%
View Original
post-image
post-image
[The user has shared his/her trading data. Go to the App to view more.]
  • Reward
  • Comment
  • Repost
  • Share
  • Reward
  • Comment
  • Repost
  • Share
  • Reward
  • Comment
  • Repost
  • Share
BTC short-term (4H/daily, oscillating weakly with repair)
1. Support (from near to far)
• Short-term strong support: 61600–62000 (current box bottom, multiple test rebound midpoint), 4H close below triggers new downtrend
• Mid-term defense line: 60700–61000 (previous low dense trading zone, concentrated institutional buying)
• Ultimate bottom: 58400–59500 (21-month low area, ultimate support for this decline)
2. Resistance (layered pressure on rebounds)
• First resistance: 63300–63500 (4H Bollinger mid-band, easy to drop back on low volume surge)
• Mid-term core resistance: 65200–65600 (dai
BTC1.84%
View Original
post-image
post-image
post-image
[The user has shared his/her trading data. Go to the App to view more.]
  • Reward
  • Comment
  • Repost
  • Share
Big Tech Technical Analysis (Daily + 4-Hour)
Short Term (1–7 Days)
1. Moving Averages: All short-term moving averages are in a bearish arrangement, and the medium-term downtrend has not reversed; however, on the 4-hour chart, there is a small MACD golden cross and deep oversold KDJ, indicating a short-term repair and rebound demand.
2. Key Support/Resistance
• First Support: 59300 (Bollinger Band lower rail, starting point of this rebound; if broken, it will retest 58000 for the previous low)
• Strong Support: 57700 (recent low; if effectively broken, it opens downward space to the 53000–55000
BTC1.84%
View Original
post-image
post-image
  • Reward
  • Comment
  • Repost
  • Share
Bitcoin Technical Key Levels
Support (from strong to weak)
1. 59000: 4-hour key neckline, short-term long core defense line; breaking below invalidates the rebound logic
2. 58200-58500: Lower edge of the oscillation center, concentrated absorption zone for bottom-fishing capital
3. 57700: Recent swing low; a valid breakdown will open new downside space
Resistance (from strong to weak)
1. 60700-61000: Intraday first layer of selling pressure, near the early morning high, first take-profit area for a rebound
2. 61300-61800: Strong resistance at the high of this rebound; only a volume-supported h
BTC1.84%
CRCL-1.74%
View Original
post-image
post-image
  • Reward
  • Comment
  • Repost
  • Share
Bitcoin Market Analysis
Layered Key Support/Resistance Levels
Short-term (1–3 days, 4H/Daily)
• Strong Resistance Zone (Rebound Ceiling)
First Resistance: 60000–60900 (Former support turned resistance; rebounds here are prone to heavy selling and pullbacks)
Mid-term Strong Resistance: 62700 (Daily Bollinger middle band; only by holding above this range can the short-term bearish trend be reversed)
• Support Ladder (Near to Far)
Short-term First Support: 58000–58300 (The current last critical line of defense for bulls)
Secondary Support: 57000 (If 58000 breaks on increased volum
BTC1.84%
View Original
post-image
post-image
  • Reward
  • Comment
  • Repost
  • Share
Bitcoin support zone: First key support at the psychological level of 59000-60k USD; strong support around 55000/52000 USD, if broken effectively, it will open up deeper retracement space;
Resistance zone: Short-term first resistance at 63000-64000 USD, only if it holds can the short-term trend be repaired; further strong resistance at 67000, 70k USD;
• Indicator characteristics: Daily/weekly moving averages are in bearish alignment, short-term moving averages are suppressing, MACD remains in a bearish range, some cycles show oversold/bottom divergence signals, there is a demand for oversold
BTC1.84%
View Original
post-image
post-image
  • Reward
  • Comment
  • Repost
  • Share
Key Technical Levels and Signals
• Resistance Zone: First resistance at $60,000–$62,000, then toward $64,000 and $68,000, the previous high-volume trading area. Only a volume-supported breakout and hold above $64,000 would establish a bottom-building and repair expectation;
• Support Zone: Recent low at $58,900; the next key psychological/structural support at $55,000–$50,000. A valid breakdown below this range could lead to accelerated downside;
• Indicator Status: Daily moving averages are bearishly aligned (short-term moving averages above long-term), MACD continues downward, RSI is relativ
BTC1.84%
View Original
post-image
post-image
[The user has shared his/her trading data. Go to the App to view more.]
  • Reward
  • Comment
  • Repost
  • Share
Big Pie Support: the $58,000 stage low is a strong support; next is the $56,000–$57,000 chip-dense zone. The $60,000 psychological level has shifted from prior support to short-term resistance—an area of repeated contention;
• Resistance: $62,000–$63,000 and $65,000–$68,000; the 50/200-day moving averages above form layered suppression;
• Indicators: short-term moving averages are arranged bearishly; RSI enters an oversold range; there are signs of a mild bottom-divergence repair; MACD downside momentum is narrowing but has not yet formed a golden cross reversal—this is only a weak rebound and
BTC1.84%
View Original
post-image
post-image
[The user has shared his/her trading data. Go to the App to view more.]
  • Reward
  • Comment
  • Repost
  • Share
Gold
Resistance Levels (Top to Bottom)
1. First Resistance: 4090-4100 (Intraday high + previous breakdown platform, strong selling zone)
2. Second Resistance: 4040-4050 (5/10-day moving average suppression, short-term bounce limit)
3. Key Pivot: 4000 round number; only holding above 4100 will ease the bearish structure
Support Levels (Top to Bottom)
1. Near-term Support: 4020-4000 (Yesterday's closing range, bulls vs bears tug-of-war)
2. Strong Support: 3970-3980 (Previous low, physical buying defense zone)
3. Critical Breakdown Level: 3950; an effective break below will open a
GLDX1.20%
PAXG1.12%
META4.68%
View Original
post-image
post-image
[The user has shared his/her trading data. Go to the App to view more.]
  • Reward
  • Comment
  • Repost
  • Share
xau
#美光市值超越Meta跻身全美前十 Technical Analysis (Daily + 4-Hour + Hourly Cycles)
Key Support Levels (Near to Far)
1. Near-term first support: $3990–$4000 (psychological level, intraday strength/weakness demarcation)
2. Medium-term strong support: $3950, $3930 (previous low dense trading zone, long defense line)
3. Extreme downside range: $3880–$3820 (consolidation bottom from last year, long-term bottom-fishing zone)
Key Resistance Levels (Layered Pressure on Rebound)
1. Intraday first resistance: $4060–$4080 (5-day moving average + yesterday's decline platform, first hurdle for rebound)
2. Medium-te
XAU1.17%
META4.68%
View Original
[The user has shared his/her trading data. Go to the App to view more.]
  • Reward
  • 1
  • Repost
  • Share
ThisIsTranslateContent::
Just go for it 👊
  • Pinned