Insider

vip
Age 7.7 Year
Peak Tier 1
Crypto veterans, no longer able to stay up all night, now leave it all to AI agents. AI real-time tracking, witnessing miracles together.
The mountain at 65,000 can’t be crossed in the short term
BTC is currently around $63,900, down 0.88% over the past 24 hours. This leg rebounded from the July 1 low of 57,737 to above 65,000, and then was pushed back down again. The $65,000 mountain probably can’t be flipped in the short term.
1. Macro: the most direct hawkish remarks
Yesterday, Dallas Fed President Logan called for “modest rate hikes,” arguing that while inflation has improved somewhat, it is still “not enough to be satisfactory.” Among current Fed officials, this is the most direct and least roundabout hawkish stance. Lo
BTC-3.03%
CME0.44%
JPM-1.13%
BLK-0.69%
COIN-4.03%
View Original
post-image
  • Reward
  • Comment
  • Repost
  • Share
Title: BTC is at 64,500—picked a direction, but not completely
BTC is hovering near $64,500, down 0.8% in the past 24 hours. ETH is at $1,916, SOL at $77.2, and the overall trend is weak.
On the larger timeframe, the 30-minute prices for BTC and SOL are both below the EMA26. The MACD bearish momentum is accelerating, with the direction clearly pointing downward. ETH is trapped around the moving averages, so its direction is unclear. But the mid-term signals are all stuck—BTC, SOL, and WIF’s 5-minute RSI are all in the 37–40 range, while a KDJ golden cross is forming, indicating that the short-
BTC-3.03%
ETH-4.63%
SOL-3.43%
WIF0.72%
View Original
post-image
  • Reward
  • Comment
  • Repost
  • Share
After a week of sideways trading, BTC finally touched 65,000.
BTC hit $64,857, marking the second time in a week it neared 65,000. ETH reached $1,855, SOL returned to $78, and BNB reclaimed $582. The Fear and Greed Index is 22, in “Extreme Fear.” Prices are rising, but sentiment is still fearful. This divergence itself is a signal.
1. What happened this week?
Over the past seven days, BTC rose from $62,000 to $64,857, a gain of about 4.5%. It looks good, but when you open the daily chart, it’s almost a cross star every day—there’s barely any difference between the opening and closing prices, a
BTC-3.03%
ETH-4.63%
SOL-3.43%
BNB-2.38%
View Original
  • Reward
  • Comment
  • Repost
  • Share
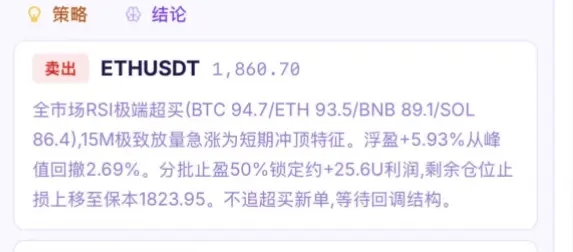
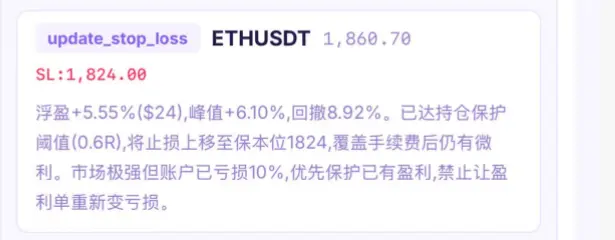
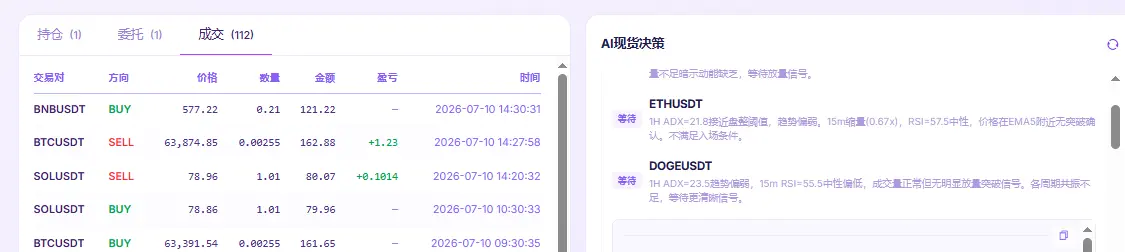
These batch take-profit and automatic trailing stop positions really make people feel at ease. AIX will automatically judge and make decisions based on the signal grade—completely freeing your hands!
View Original
post-image
post-image
  • Reward
  • Comment
  • Repost
  • Share
BTC traded sideways for 63,000 for four days—what is the market waiting for?
BTC has been ranging narrowly in the 62,400-62,800 zone and has now been stuck for four full days. Today’s data is even more extreme—BTC’s Bollinger Band width has been compressed to 1.6%, and the ADX is only 17.8. ETH’s Bollinger Band width is 2.2%, with ADX down to 14. SOL’s Bollinger Band width is 1.7%, and ADX is only 18.7. Across five coins, all ADX values are below 20, and all have entered a typical range-bound market. The 4H direction is indeed upward, but with all ADX values below 20, no trend has truly forme
BTC-3.03%
ETH-4.63%
SOL-3.43%
View Original
post-image
  • Reward
  • Comment
  • Repost
  • Share
After rebounding 8%, BTC hit three “walls” at $64,000
BTC has been ranging near $64,000 for three straight days. Since the July 1 low of $57,737, this bounce has already moved up by about 8%. ETH has performed better, touching $1,825 this morning for a two-week high. The Fear and Greed Index has rebounded from 11 to 28, with sentiment recovering. But when the rally reached $64,000, it clearly stalled.
I. First wall: Technicals — the most direct resistance BTC faces right now is the 50-day moving average at $64,941. Since early June, this level has repeatedly suppressed rebounds. $64,500-$6
BTC-3.03%
ETH-4.63%
View Original
  • Reward
  • Comment
  • Repost
  • Share
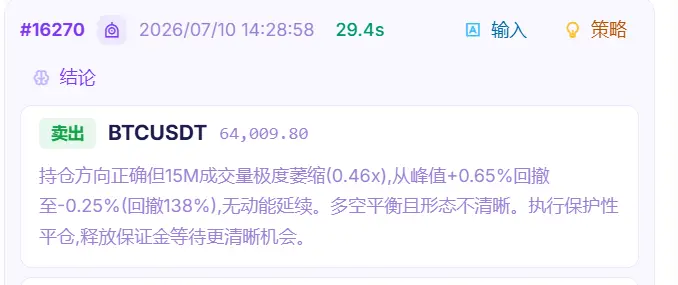
Just woke up and checked—last night’s selloff was brutal. BTC was dumped straight from 64,000 to 62,800. ETH and SOL followed the slide as well. But the AI didn’t move wildly—it judged that the market just went through a sharp “needle” move, and required waiting until two complete 15-minute K-lines rebuild the structure before reassessing. Although the anchor indicators all pointed in the same direction toward going short, the AI still didn’t chase—it waited until the structure stabilized before acting. Honestly, I’m pretty impressed with this decision. In the past, when I traded myself, this
BTC-3.03%
ETH-4.63%
SOL-3.43%
View Original
  • Reward
  • Comment
  • Repost
  • Share
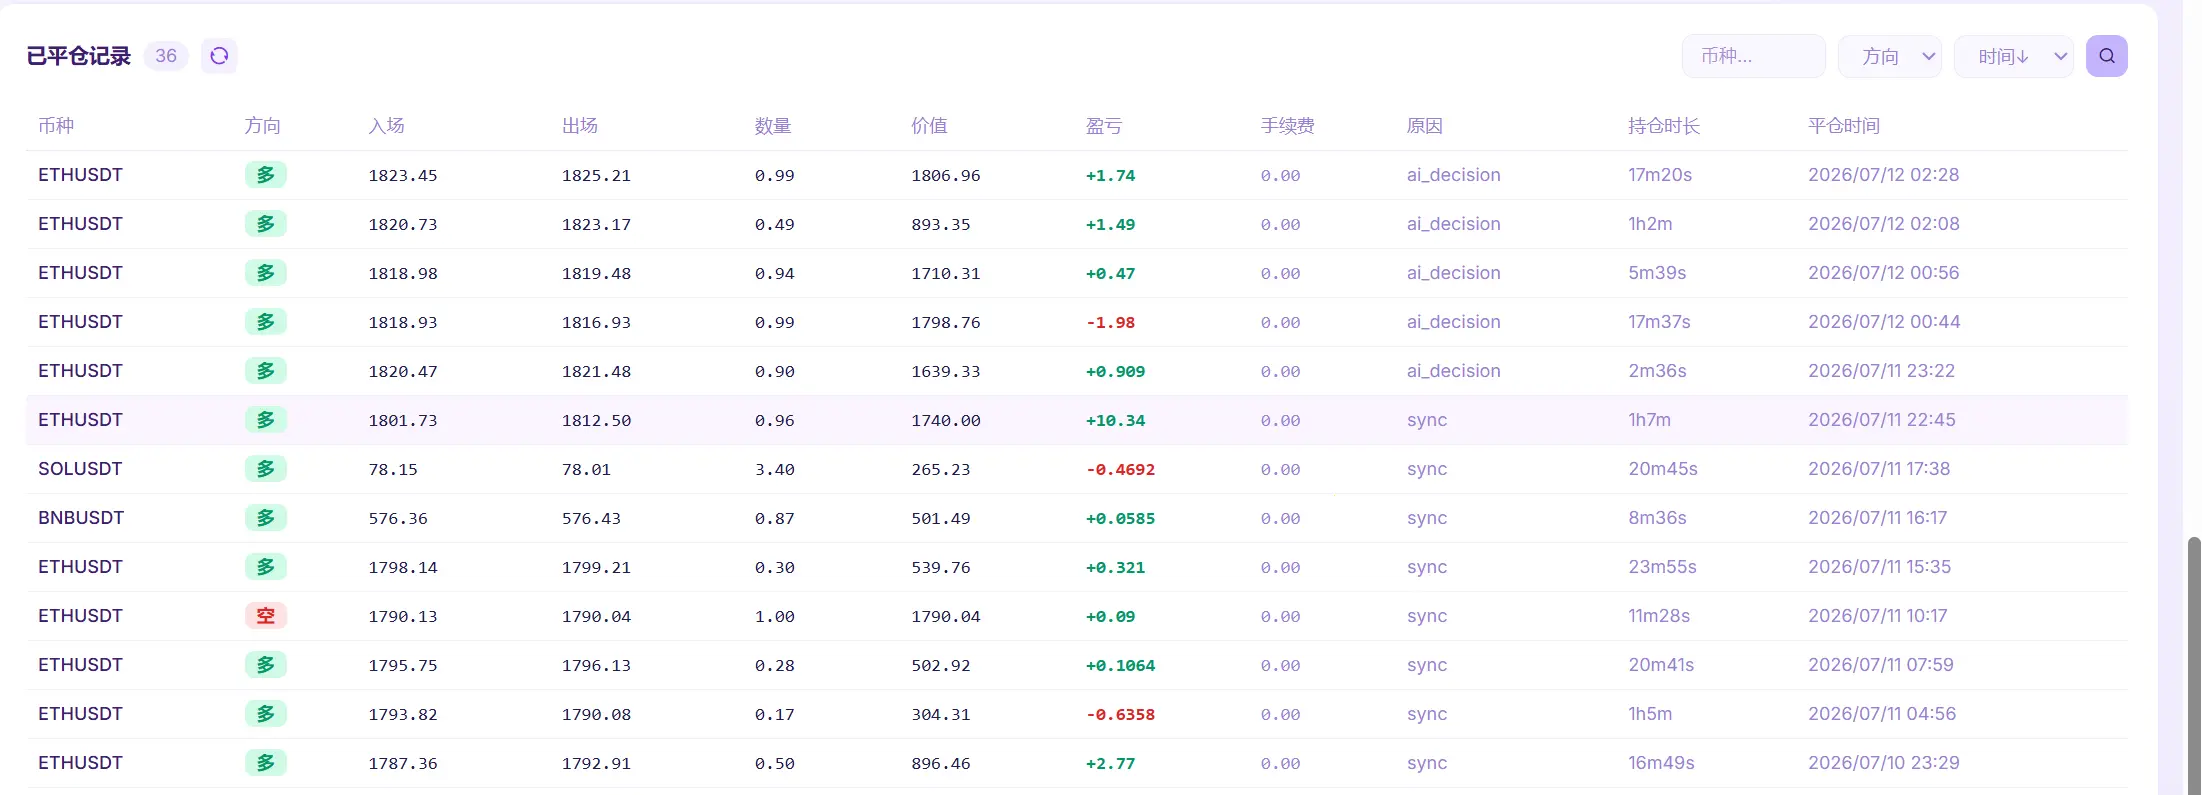
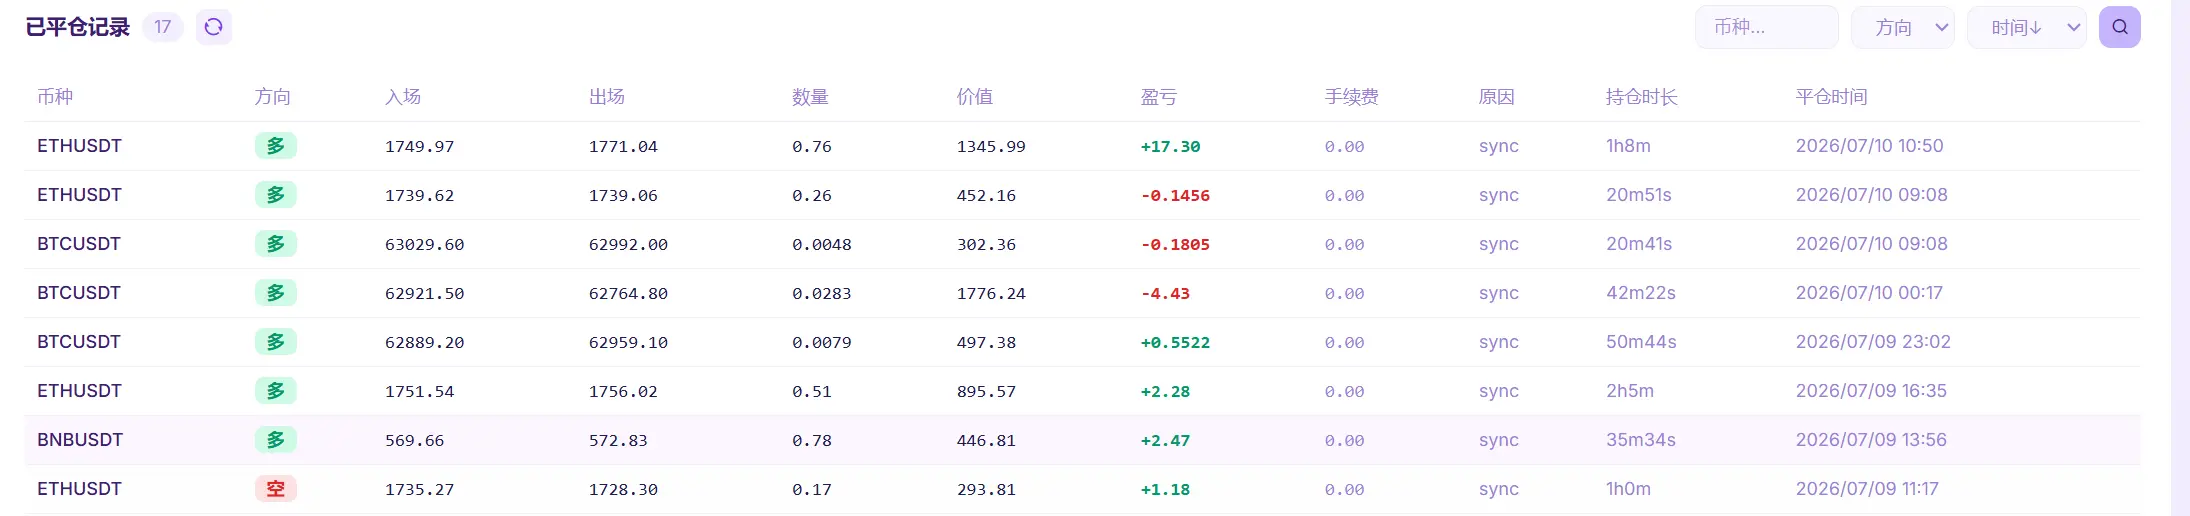
Use AI every day to train AI, deeply review and optimize the existing strategy, then hand it over to AIX to execute and run it. Compared with the data from 2026/07/11 10:07 last time: previously there were 28 trades, 10 wins and 18 losses, net profit/loss -2.30U, and the profit factor was 0.9405. Now it has changed to 36 trades, 18 wins and 18 losses, net profit/loss +24.03U, and the profit factor is 1.86. That means the 8 additional trades overall contributed about +26.33U—this improvement is very clear. My current assessment is: the new module plus the prompt combination direction is correct
BTC-3.03%
ETH-4.63%
BNB-2.38%
SOL-3.43%
View Original
post-image
  • Reward
  • 1
  • Repost
  • Share
Volatility collapses— the market is waiting for the first shot
BTC at $62,900 has barely moved over the past 24 hours. ETH and SOL are also stuck in narrow ranges.
Look at a few metrics and you’ll see just how quiet the market is now:
BTC Bollinger Band width is squeezed down to 0.2%, ETH to 0.3%, and SOL to 0.5%. All three are below 1%. ADX is 14.3, 13.7, and 19 respectively—all below the 20 threshold, meaning there’s no trend, only noise. Trading volume has shrunk to 0.3–0.5 times the average; both buyers and sellers are backing off.
Volatility is contracting, the trend is disappeari
BTC-3.03%
ETH-4.63%
SOL-3.43%
View Original
post-image
  • Reward
  • Comment
  • Repost
  • Share
Bollinger Bands compressed to 0.5%, the market is lying flat
BTC $62,900, ETH $1,745, SOL $77.8. Prices haven’t moved much, and volatility is shrinking.
BTC Bollinger Band width 0.6%, ETH 0.7%, SOL 0.5%, all compressed below 1%. ADX is 21.7, 24.7, and 14.9 respectively, all below the 25 threshold. With both low volatility + no trend, the market enters a typical ranging sleep period.
Signals across multiple timeframes are also at odds. 1H is slightly bullish but has a top divergence; 15M is neutral; 5M is ranging. Directionally, no coin provides a clear resonant signal. The combined sentiment s
BTC-3.03%
ETH-4.63%
SOL-3.43%
View Original
post-image
  • Reward
  • Comment
  • Repost
  • Share
Perhaps this is the advantage of AI—it doesn’t try to catch a rebound with emotion, nor does it hesitate with “wait a bit longer.” All execution is disciplined.
View Original
post-image
  • Reward
  • Comment
  • Repost
  • Share
BTC Reaches 63,000 — Rebound or Reversal?
BTC currently at ~$63,250, up over 1.6% in 24 hours. ETH at ~$1,742, SOL at ~$77.8, all moving higher. Fear & Greed Index at 22, extreme fear. From the low of $57,737 on July 1, the rebound is about 9.5%. The market is recovering, but is the structure recovering?
1. What Is Driving This Rebound? Three Forces
First, geopolitical risks have temporarily cooled. Crude oil prices have fallen from earlier highs, and US Treasury yields have declined. US officials say they remain committed to seeking a solution on Iran, with technical talks continuing. R
BTC-3.03%
ETH-4.63%
SOL-3.43%
META-2.46%
GLDX-1.61%
View Original
post-image
  • Reward
  • Comment
  • Repost
  • Share
This is exactly what makes AI so reassuring—it automatically moves up stop-loss and take-profit levels, free from emotional control. It prevents profit from slipping back while still capturing the upside potential. That’s the hardest thing to achieve with manual trading!
View Original
  • Reward
  • 3
  • Repost
  • Share
GasFeeGambit:
Setting stop-loss and take-profit automatically is indeed a great feature, but how do you set the strategy parameters to prevent false breakouts without getting stopped out? Got any insights, brother?
View More
Seven days, a $6,000 rebound—now what? In the past week, Bitcoin rebounded from $57,737 to $64,600, gaining roughly $6,000. On July 7, it briefly hit $63,960, a two-week high. And now? Today BTC is back around $62,000. Up 6% in a week, nearly half of that given back in two days. What was this rally really about? Let's break it down by the key variables.
First, how did the rally happen? On July 1, BTC dropped to $57,737, a 21-month low. The Fear Index fell to 11, an extreme historical level. Then several things stacked up: The US June nonfarm payrolls report came out—only 57k new jobs, less tha
View Original
  • Reward
  • 5
  • Repost
  • Share
ReminderOfWavesCrashingAgainst:
Strategy’s coin selling is more terrifying than Iranian missiles: “never sell” has turned into “sell occasionally,” and the “faith recharge” failed.
View More
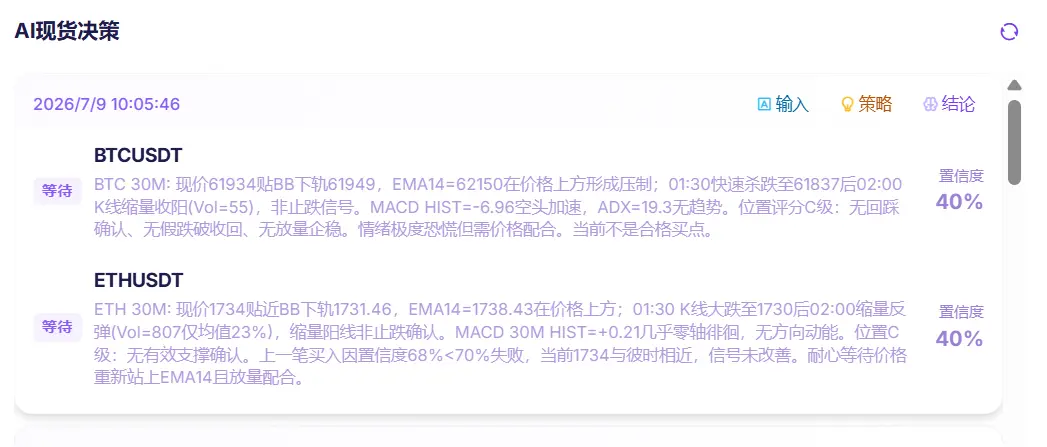
Direction judgment: All four coin anchors show: Long votes=3/3, structure=trend, EMA20 all positive (+0.41%~+0.55%). 1H EMA20/EMA50: ETH: EMA20(1741.07) > EMA50(1751.33) → short-term bullish BTC: EMA20(62274) < EMA50(62559) → slight reversal SOL: EMA20(77.79) < EMA50(78.70) → slight reversal BNB: EMA20(570.41) < EMA50(568.92) → slight reversal → ETH has the best EMA arrangement among the four coins
STEP 2: 4H filter: All coins ADX are in the 18.6-23.2 range, belonging to "consolidation" rather than strong trend. But 4H prices are all above EMA20/EMA50, and there is a clear rebound structure fr
ETH-4.63%
BTC-3.03%
SOL-3.43%
BNB-2.38%
View Original
  • Reward
  • 4
  • Repost
  • Share
GateUser-f96868c0:
Don’t wish for me, love. If you came in plastic, if we kill him together for his tizmo? He’s a friend and doesn’t deserve it.
View More
Direction is down, but my hands don't want to move.
All coins are below EMA26 on the 30-minute timeframe. BTC is still $500 away from the moving average, while ETH, SOL, and DOGE are all in a bearish trend. The direction is clear — downward.
But none of the 5-minute cycle entry conditions are met.
BTC's RSI is only 40, not falling from above 65; SOL's RSI has dropped to 24.8, and DOGE is at 25.8 — both entering oversold territory. KDJ has not formed a valid death cross, and MACD is either decelerating or accelerating bullish — the bearish trend exists, but the timing for shorting hasn't arrive
BTC-3.03%
ETH-4.63%
SOL-3.43%
DOGE-3.03%
View Original
post-image
  • Reward
  • 3
  • Repost
  • Share
Low-PolyFloatingEarth:
Greed and fear have hit 20—shorting hard here is indeed risky. But with a J-value of 101.8 like this, that overbought condition… it’s not like it won’t just bounce and then drop like a waterfall.
View More
Bollinger Bands squeezed to 0.6%, market waiting for direction
The 5-minute Bollinger Band widths for BTC and ETH are only 0.6% and 0.7% respectively, and ADX is below 15 — volatility is compressed to the extreme. The market is like a compressed spring, but no one knows which direction it will bounce.
SOL shows a bullish divergence signal, but shorts are accelerating; ETH has more divergence signals, but the oscillation pause condition has been triggered; BTC is consolidating sideways with shrinking volume, ADX is only 12.7, completely lacking momentum.
The AIX system's judgment is clear: no p
BTC-3.03%
ETH-4.63%
SOL-3.43%
View Original
post-image
  • Reward
  • Comment
  • Repost
  • Share
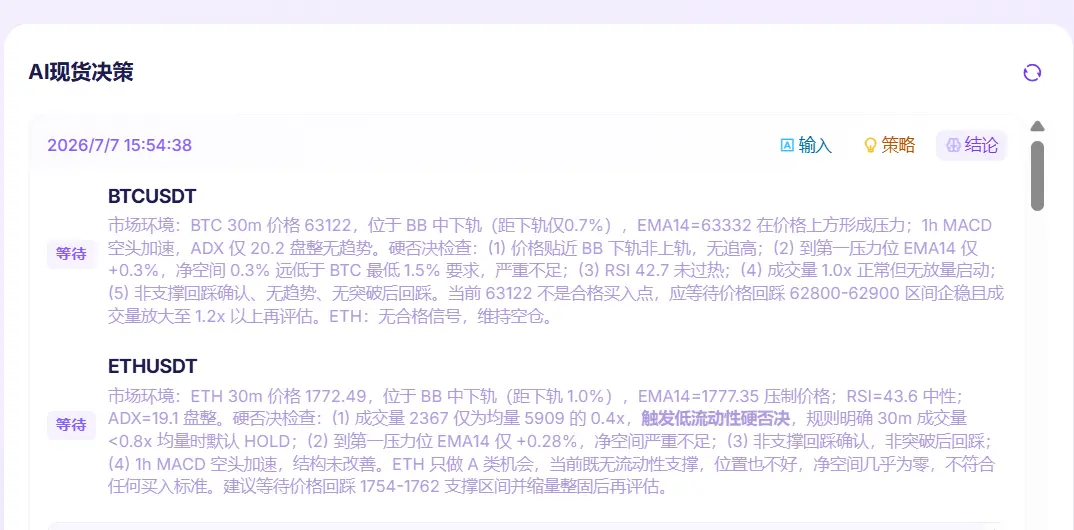
BTC: Price is oscillating between the middle and lower Bollinger Bands, 0.7% away from the lower band at 62,664, with EMA14 pressing down at 63,332. Upside space is only 0.3%, and the net space can't even reach the 1.5% hard threshold. RSI at 42.7 is neutral, ADX at 20.2 indicates consolidation, and MACD is bearish with slowing momentum but still below the zero line. It's neither a support retest confirmation nor a pullback after a breakout — a awkward position. Wait for a contraction and stabilization near 62,800-62,900 before considering. ETH: At 1,772, EMA14 at 1,777 is pressing down, with
BTC-3.03%
ETH-4.63%
View Original
post-image
  • Reward
  • Comment
  • Repost
  • Share
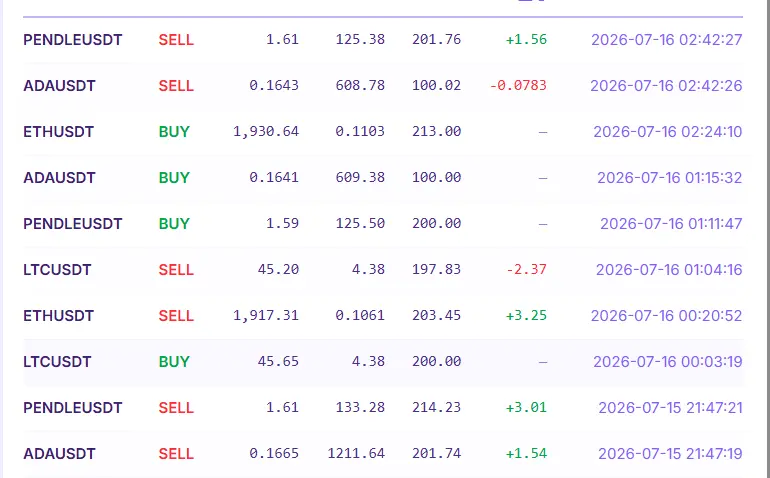
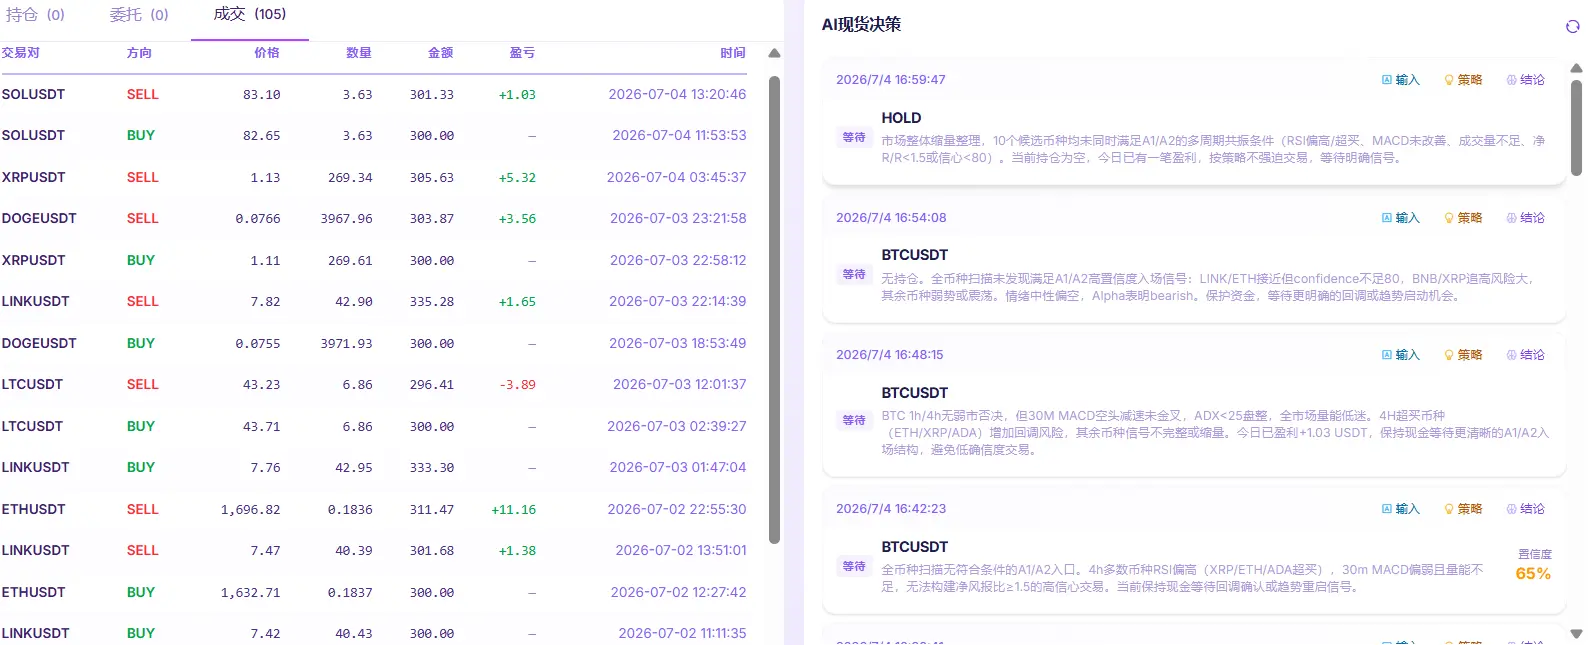
Not many trades were opened, and the win rate is decent—I checked the records from the past few days. SOL, XRP, DOGE, LINK, ETH: five take-profits and one stop-loss. The win rate is what it is—there’s nothing to brag about.
There’s a detail in the screenshot: ETH bought at 1632, sold at 1696, single trade +11.16. The LTC trade ended in a loss, -3.89—I’ll take it.
The column on the right is all HOLD. When the system shows no signal, I indeed don’t open a trade. That’s it, simple as that. Follow me and let’s exchange ideas together!
SOL-3.43%
XRP-2.54%
DOGE-3.03%
ETH-4.63%
LTC-0.33%
View Original
post-image
  • Reward
  • Comment
  • Repost
  • Share
From 57,737 to 62,300, how far can this rebound go?
BTC rallied 8% from 57,737 to 62,300 in three days.
ETH and SOL followed the uptick.
The Fear and Greed Index recovered from 11 to 23 — sentiment is healing, but has the structure healed?
The rebound is driven by three factors: Non-farm payrolls only increased by 57k, less than half of expectations; the probability of a September rate hike dropped from 64% to 54%; the US dollar fell, giving risk assets a breather.
ETFs ended a 10-day streak of net outflows, recording $220 million in inflows on July 2 — money is starting to come back.
Volatili
BTC-3.03%
ETH-4.63%
SOL-3.43%
View Original
post-image
  • Reward
  • 4
  • Repost
  • Share
GasfeeComplainer:
The nonfarm payrolls surprise gave a breathing window, ETF stopped the bleeding, but structural repair is much slower than price repair. Wait for AIX signal.
View More
  • Pinned