#BTCMarketAnalysis
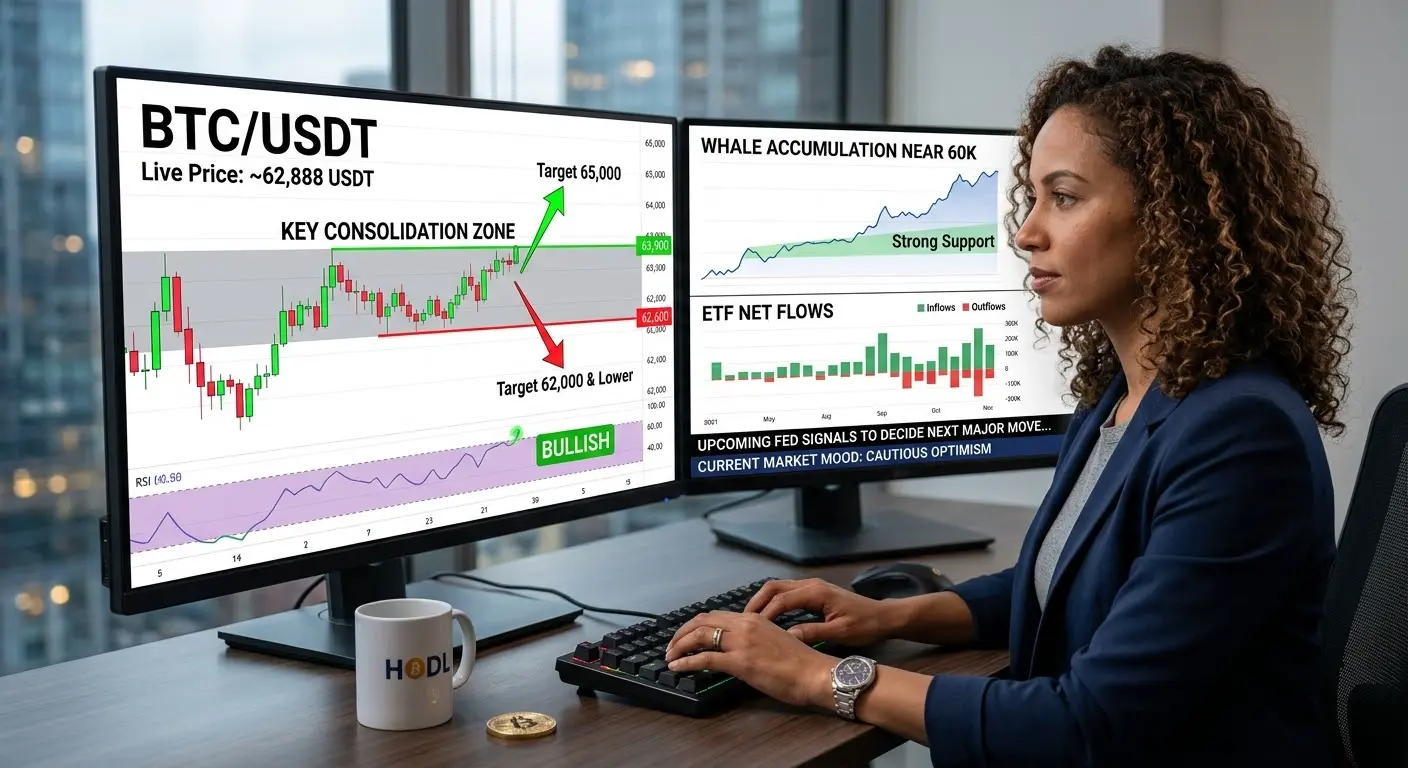
Bitcoin is currently trading at approximately 62,888 USDT, positioned within a critical consolidation zone that will likely determine the next major directional move. The cryptocurrency has recovered 7.99% over the past week from the 57,800 support area, though it remains down 1.08% in the last 24 hours as profit-taking and uncertainty persist.
Market Structure and Price Action
Bitcoin has established a well-defined trading range between 62,000 and 63,900, with the current price sitting near the middle of this consolidation pattern at 62,888. The 24-hour trading volume shows healthy participation with volume-price synchronization, indicating genuine market interest rather than artificial price manipulation. The Fear and Greed Index has improved significantly from Extreme Fear at 9 to Fear at 26, reflecting recovering sentiment though caution remains prevalent among market participants.
Critical Support and Resistance Levels
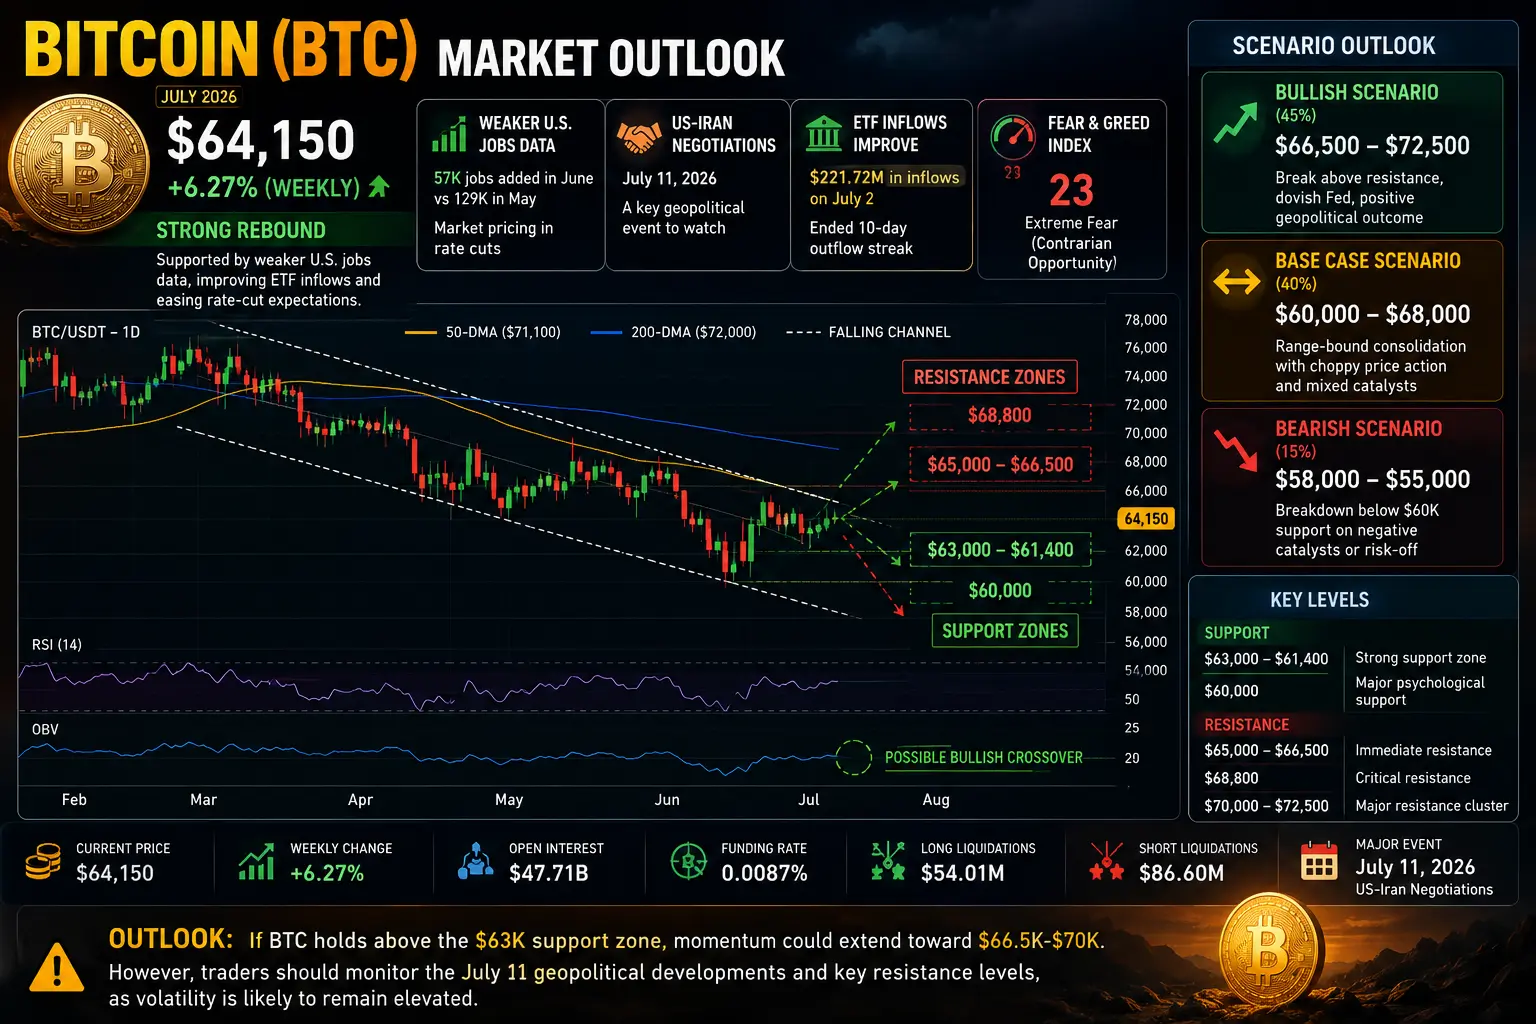
Immediate resistance stands at 63,900, representing the first major barrier that bulls must overcome for continued upside momentum. Beyond this level, the 65,000 psychological resistance and the 50-day Simple Moving Average at approximately 71,000 present significant hurdles. The 200-day Simple Moving Average at 72,000 remains the ultimate bullish reclaim target to reverse the medium-term downtrend.
Support levels are well-established at 62,600, 62,000, and the stronger demand zone at 61,900. A breakdown below 62,600 would signal corrective pressure targeting 62,000, while failure to hold 62,000 risks a retest of the 60,000 psychological support. The invalidation level for bullish structure sits at 61,000, with loss of this level potentially opening the path toward 58,000 and lower.
Technical Indicator Analysis
The daily Relative Strength Index reads 60.7, indicating bullish momentum without reaching overbought conditions. This leaves room for further upside movement before technical exhaustion sets in. However, the Stochastic Oscillator and Williams Percent Range signal near-term pullback risk, suggesting caution for immediate long entries.
The Moving Average Convergence Divergence on the 4-hour timeframe displays bottom divergence, where price makes new lows while the MACD histogram rises, indicating potential downside exhaustion and accumulation occurring at lower levels. The 15-minute timeframe shows bullish alignment with Positive Directional Indicator exceeding Negative Directional Indicator and Average Directional Index at 25.45, though the recent break below the 15-minute 20-period Moving Average at 62,866 signals short-term weakness.
Derivatives Market Analysis
Open interest across Bitcoin futures has stabilized at approximately 46.38 billion dollars, with funding rates at neutral levels of 0.0049%, indicating balanced positioning between longs and shorts. This equilibrium reduces the risk of cascading liquidations in either direction. Recent liquidation data shows short covering dominates with 55.7% of liquidations being short positions, suggesting bearish capitulation and potential for continued upside if momentum sustains.
The Coinbase premium remains weak, signaling limited United States spot demand despite the price recovery. This divergence between futures activity and spot demand warrants caution, as sustainable rallies typically require spot market participation.
Institutional Flow Analysis
Exchange-Traded Fund flows present a mixed picture with 5.85 billion dollars in outflows over the past 30 days, representing significant institutional selling pressure. However, recent data shows stabilization with 222 million dollars in inflows on July 3, snapping a 10-day outflow streak. BlackRock and Fidelity continue dominating the ETF landscape, capturing over 90% of inflows on positive flow days, while smaller issuers struggle to maintain market share.
Strategy, formerly MicroStrategy, holds 847,363 Bitcoin acquired at an average cost basis of 75,651 dollars per coin, representing the largest corporate treasury position. The company reported a 12.5 billion dollar loss in the first quarter of 2026 as Bitcoin declined 52% from its October 2025 peak of 126,080 dollars. JPMorgan has warned that Strategy's concentrated position could increase volatility, with any forced liquidation potentially impacting Bitcoin's price dynamics significantly.
Whale accumulation data shows long-term holders have accumulated 14.7 million Bitcoin around the 60,000 level, representing record holdings and strong underlying demand at lower prices. Anonymous whale activity includes recent accumulation of 37.7 million dollars in Bitcoin and Ethereum over three days, indicating smart money interest at current levels.
Macroeconomic Context
The Federal Reserve's monetary policy remains the dominant external factor influencing Bitcoin's price trajectory. Recent soft labor market data has reduced expectations for further rate hikes, providing relief to risk assets including cryptocurrencies. The upcoming Federal Open Market Committee minutes release and speeches by Federal Reserve officials will likely determine short-term direction.
The correlation between Bitcoin and traditional risk assets remains elevated, with the asset trading as a high-beta risk-on instrument. The United States dollar strength, inflation expectations, and global liquidity conditions continue impacting cryptocurrency valuations.
Price Forecast and Scenarios
Bullish Scenario: A confident breakout above 63,900 with sustained volume above 1.5 billion dollars daily would open the path toward 65,000, representing 3.36% upside from current levels. Continued momentum could target 68,000 and eventually the critical 71,000 50-day Moving Average. This scenario requires ETF inflows to resume, macroeconomic conditions to remain supportive, and spot demand to increase as indicated by Coinbase premium improvement.
Bearish Scenario: Failure to hold 62,600 support triggers a correction toward 62,000, with a breakdown below this level risking a retest of 61,900 or lower. Loss of 60,000 psychological support opens the path toward 58,000 and potentially 55,000. This scenario would likely coincide with renewed ETF outflows, hawkish Federal Reserve rhetoric, or deterioration in risk appetite.
Base Case: Sideways consolidation between 62,000 and 63,900 persists through July as the market digests macroeconomic data and awaits clearer directional catalysts. This range-bound action would frustrate both bulls and bears while allowing technical indicators to reset.
Comprehensive Trading Strategy
For active traders, a breakout approach offers the highest probability setup. Consider buy stop orders above 63,900 targeting 65,000 with stop loss at 63,300, providing a risk-reward ratio of approximately 2.3 to 1. Position sizing should not exceed 2% of portfolio given current volatility conditions.
Alternatively, sell stop orders below 62,600 targeting 62,000 with stop loss at 63,000 provide defensive positioning for breakdown scenarios. Traders should monitor volume confirmation on any breakout, as false breaks above resistance without volume support typically reverse quickly.
Swing traders should consider accumulation on dips toward 62,000 with stop loss below 61,500, targeting 65,000 and 68,000 on successful recovery. This approach aligns with whale accumulation patterns and offers favorable risk-reward characteristics.
Risk Management Framework
Position sizing remains paramount with maximum 2-3% exposure per trade given the current 25.45 Average Directional Index reading indicating moderate trend strength. Traders should utilize stop losses religiously and avoid leverage above 3x in the current environment, as funding rate normalization suggests reduced but persistent liquidation risk.
Portfolio allocation recommendations suggest maintaining 60% cash or stablecoins until directional confirmation above 65,000, with 40% allocated to spot Bitcoin positions accumulated on weakness toward 62,000. This defensive posture preserves capital while maintaining upside exposure.
Market Outlook and Conclusion
Bitcoin stands at a critical juncture with technical, fundamental, and sentiment factors creating a complex decision matrix. The confluence of whale accumulation at 60,000, neutral derivatives positioning, and improving Fear and Greed Index suggests the path of least resistance remains higher, though patience is required for confirmation.
The key determinant for the next major move will be institutional flow resumption and Federal Reserve policy clarity. Traders should remain nimble, respecting the 62,000 to 63,900 range until decisive breakout occurs with volume confirmation. The coming two weeks will likely determine whether Bitcoin reclaims 65,000 for bullish continuation or retests lower support levels, making disciplined risk management essential for navigating this pivotal period.
@Gate_Square
Bitcoin is currently trading at approximately 62,888 USDT, positioned within a critical consolidation zone that will likely determine the next major directional move. The cryptocurrency has recovered 7.99% over the past week from the 57,800 support area, though it remains down 1.08% in the last 24 hours as profit-taking and uncertainty persist.
Market Structure and Price Action
Bitcoin has established a well-defined trading range between 62,000 and 63,900, with the current price sitting near the middle of this consolidation pattern at 62,888. The 24-hour trading volume shows healthy participation with volume-price synchronization, indicating genuine market interest rather than artificial price manipulation. The Fear and Greed Index has improved significantly from Extreme Fear at 9 to Fear at 26, reflecting recovering sentiment though caution remains prevalent among market participants.
Critical Support and Resistance Levels
Immediate resistance stands at 63,900, representing the first major barrier that bulls must overcome for continued upside momentum. Beyond this level, the 65,000 psychological resistance and the 50-day Simple Moving Average at approximately 71,000 present significant hurdles. The 200-day Simple Moving Average at 72,000 remains the ultimate bullish reclaim target to reverse the medium-term downtrend.
Support levels are well-established at 62,600, 62,000, and the stronger demand zone at 61,900. A breakdown below 62,600 would signal corrective pressure targeting 62,000, while failure to hold 62,000 risks a retest of the 60,000 psychological support. The invalidation level for bullish structure sits at 61,000, with loss of this level potentially opening the path toward 58,000 and lower.
Technical Indicator Analysis
The daily Relative Strength Index reads 60.7, indicating bullish momentum without reaching overbought conditions. This leaves room for further upside movement before technical exhaustion sets in. However, the Stochastic Oscillator and Williams Percent Range signal near-term pullback risk, suggesting caution for immediate long entries.
The Moving Average Convergence Divergence on the 4-hour timeframe displays bottom divergence, where price makes new lows while the MACD histogram rises, indicating potential downside exhaustion and accumulation occurring at lower levels. The 15-minute timeframe shows bullish alignment with Positive Directional Indicator exceeding Negative Directional Indicator and Average Directional Index at 25.45, though the recent break below the 15-minute 20-period Moving Average at 62,866 signals short-term weakness.
Derivatives Market Analysis
Open interest across Bitcoin futures has stabilized at approximately 46.38 billion dollars, with funding rates at neutral levels of 0.0049%, indicating balanced positioning between longs and shorts. This equilibrium reduces the risk of cascading liquidations in either direction. Recent liquidation data shows short covering dominates with 55.7% of liquidations being short positions, suggesting bearish capitulation and potential for continued upside if momentum sustains.
The Coinbase premium remains weak, signaling limited United States spot demand despite the price recovery. This divergence between futures activity and spot demand warrants caution, as sustainable rallies typically require spot market participation.
Institutional Flow Analysis
Exchange-Traded Fund flows present a mixed picture with 5.85 billion dollars in outflows over the past 30 days, representing significant institutional selling pressure. However, recent data shows stabilization with 222 million dollars in inflows on July 3, snapping a 10-day outflow streak. BlackRock and Fidelity continue dominating the ETF landscape, capturing over 90% of inflows on positive flow days, while smaller issuers struggle to maintain market share.
Strategy, formerly MicroStrategy, holds 847,363 Bitcoin acquired at an average cost basis of 75,651 dollars per coin, representing the largest corporate treasury position. The company reported a 12.5 billion dollar loss in the first quarter of 2026 as Bitcoin declined 52% from its October 2025 peak of 126,080 dollars. JPMorgan has warned that Strategy's concentrated position could increase volatility, with any forced liquidation potentially impacting Bitcoin's price dynamics significantly.
Whale accumulation data shows long-term holders have accumulated 14.7 million Bitcoin around the 60,000 level, representing record holdings and strong underlying demand at lower prices. Anonymous whale activity includes recent accumulation of 37.7 million dollars in Bitcoin and Ethereum over three days, indicating smart money interest at current levels.
Macroeconomic Context
The Federal Reserve's monetary policy remains the dominant external factor influencing Bitcoin's price trajectory. Recent soft labor market data has reduced expectations for further rate hikes, providing relief to risk assets including cryptocurrencies. The upcoming Federal Open Market Committee minutes release and speeches by Federal Reserve officials will likely determine short-term direction.
The correlation between Bitcoin and traditional risk assets remains elevated, with the asset trading as a high-beta risk-on instrument. The United States dollar strength, inflation expectations, and global liquidity conditions continue impacting cryptocurrency valuations.
Price Forecast and Scenarios
Bullish Scenario: A confident breakout above 63,900 with sustained volume above 1.5 billion dollars daily would open the path toward 65,000, representing 3.36% upside from current levels. Continued momentum could target 68,000 and eventually the critical 71,000 50-day Moving Average. This scenario requires ETF inflows to resume, macroeconomic conditions to remain supportive, and spot demand to increase as indicated by Coinbase premium improvement.
Bearish Scenario: Failure to hold 62,600 support triggers a correction toward 62,000, with a breakdown below this level risking a retest of 61,900 or lower. Loss of 60,000 psychological support opens the path toward 58,000 and potentially 55,000. This scenario would likely coincide with renewed ETF outflows, hawkish Federal Reserve rhetoric, or deterioration in risk appetite.
Base Case: Sideways consolidation between 62,000 and 63,900 persists through July as the market digests macroeconomic data and awaits clearer directional catalysts. This range-bound action would frustrate both bulls and bears while allowing technical indicators to reset.
Comprehensive Trading Strategy
For active traders, a breakout approach offers the highest probability setup. Consider buy stop orders above 63,900 targeting 65,000 with stop loss at 63,300, providing a risk-reward ratio of approximately 2.3 to 1. Position sizing should not exceed 2% of portfolio given current volatility conditions.
Alternatively, sell stop orders below 62,600 targeting 62,000 with stop loss at 63,000 provide defensive positioning for breakdown scenarios. Traders should monitor volume confirmation on any breakout, as false breaks above resistance without volume support typically reverse quickly.
Swing traders should consider accumulation on dips toward 62,000 with stop loss below 61,500, targeting 65,000 and 68,000 on successful recovery. This approach aligns with whale accumulation patterns and offers favorable risk-reward characteristics.
Risk Management Framework
Position sizing remains paramount with maximum 2-3% exposure per trade given the current 25.45 Average Directional Index reading indicating moderate trend strength. Traders should utilize stop losses religiously and avoid leverage above 3x in the current environment, as funding rate normalization suggests reduced but persistent liquidation risk.
Portfolio allocation recommendations suggest maintaining 60% cash or stablecoins until directional confirmation above 65,000, with 40% allocated to spot Bitcoin positions accumulated on weakness toward 62,000. This defensive posture preserves capital while maintaining upside exposure.
Market Outlook and Conclusion
Bitcoin stands at a critical juncture with technical, fundamental, and sentiment factors creating a complex decision matrix. The confluence of whale accumulation at 60,000, neutral derivatives positioning, and improving Fear and Greed Index suggests the path of least resistance remains higher, though patience is required for confirmation.
The key determinant for the next major move will be institutional flow resumption and Federal Reserve policy clarity. Traders should remain nimble, respecting the 62,000 to 63,900 range until decisive breakout occurs with volume confirmation. The coming two weeks will likely determine whether Bitcoin reclaims 65,000 for bullish continuation or retests lower support levels, making disciplined risk management essential for navigating this pivotal period.
@Gate_Square