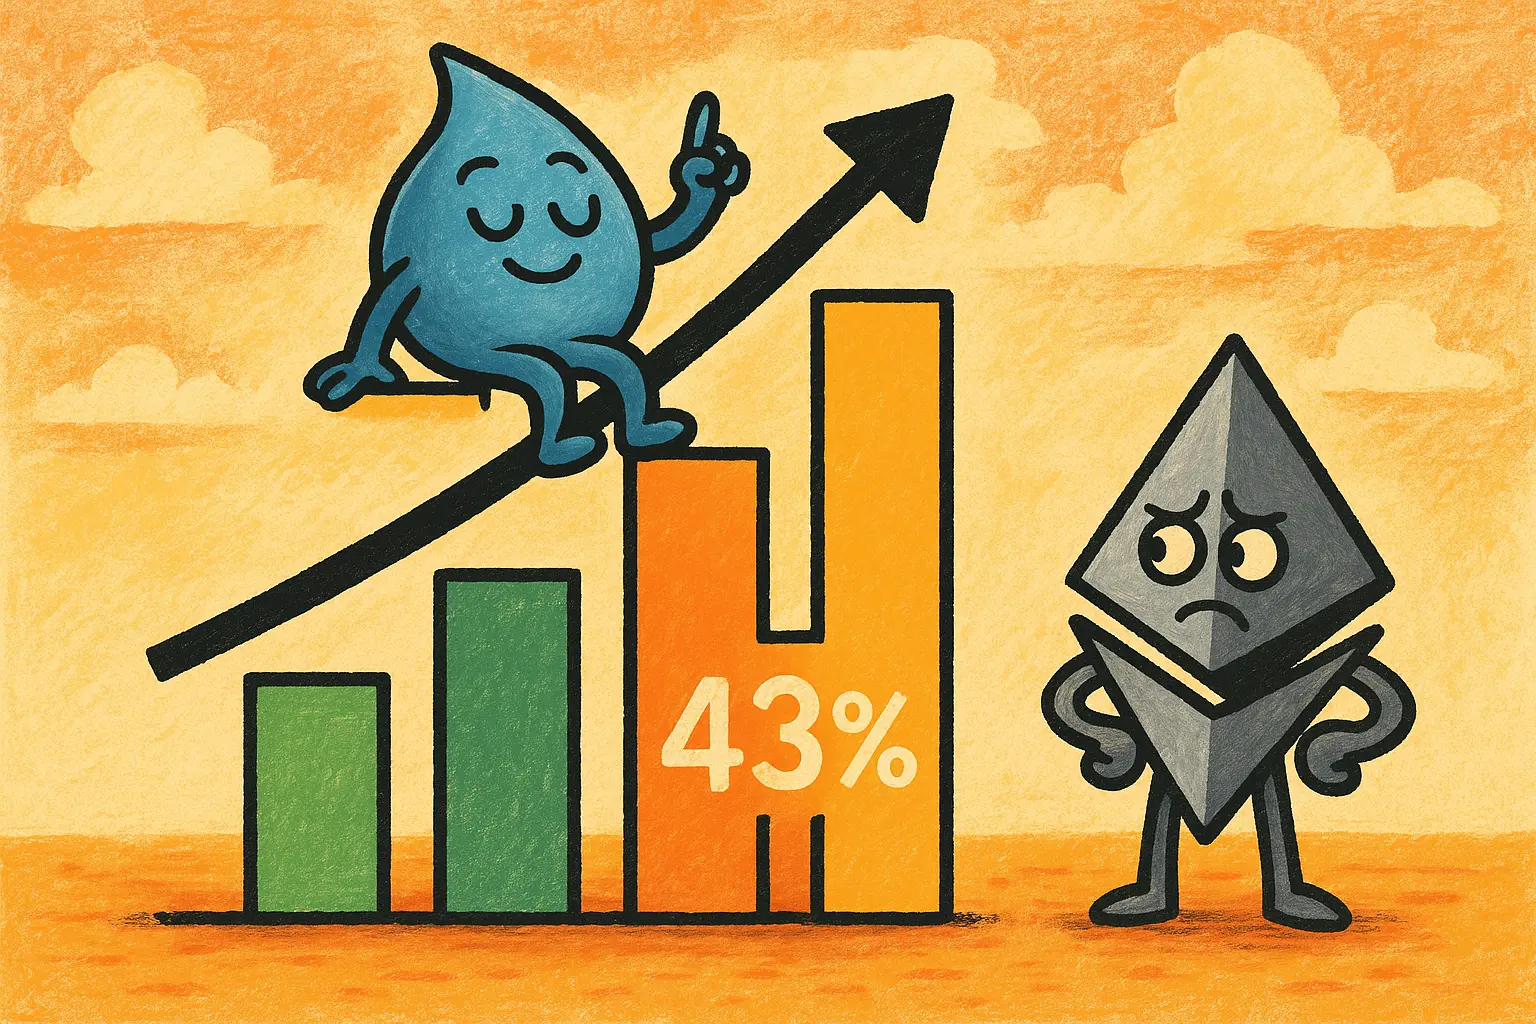
According to The Block on May 14, last week’s data on major blockchain transaction fee distribution showed that Hyperliquid ranked first with a 43% fee market share, with weekly revenue of about $11 million; Ethereum ranked second with a market share of about 13% and revenue of about $3 million; Solana accounted for about 10% with revenue of about $2 million.
Verified fee confirmation data for major blockchains last week
The Block reported and confirmed last week’s fee data for each chain:
Hyperliquid: market share of about 43%, revenue of about $11 million; source is perpetual contract opening, maintenance, and closing fees
Ethereum (ETH): market share of about 13%, revenue of about $3 million; source is DeFi trades, smart contract execution, and token transfers
Solana (SOL): market share of about 10%, revenue of about $2 million; source is DEX trading activity
Bitcoin (BTC): market share is relatively smaller; as The Block reported, activity in Ordinals and Runes has fallen sharply from the 2024 peak, and Bitcoin’s network is currently mainly returning to basic currency transfer use cases
Ethereum fee share declines: confirmed impact of Dencun upgrade fee compression
The Block reported and confirmed that Ethereum’s 13% share in this dataset reflects the fee compression phenomenon after the Dencun upgrade. The Dencun upgrade significantly reduced the Blob fees produced by Layer 2 on Ethereum’s mainnet by introducing Proto-Danksharding (EIP-4844), causing Ethereum mainnet fee revenue to continue declining. The Block noted that the 13% share shown in this distribution chart is clearly different from Ethereum’s historical dominance in the fee market.
Solana fee vs. transaction volume gap: confirmed data discrepancy by The Block
The Block reported and confirmed that there is a significant gap between Solana’s roughly 10% fee market share and its share in DEX trading volume across chains. The Block’s analysis attributes the gap to the fact that Meme Coin trades on Solana—characterized by high-frequency, low-fee activity—cannot be effectively converted into fee revenue. Solana’s weekly fee revenue was about $2 million.
FAQ
How is fee market share distinguished from transaction volume, and why does it better measure the value of on-chain business?
Blockchain transaction fees are the actual costs users pay to process on-chain transactions, reflecting users’ willingness to pay. A chain can process a large number of transactions with very low fees per trade (such as Solana’s meme coin trades), but that cannot translate into meaningful fee revenue. Fee market share can therefore differentiate chains that generate truly paid activity from those that rely on low fees and high throughput.
What is the main source of Hyperliquid fees?
According to The Block, Hyperliquid’s fees primarily come from perpetual derivatives trading activity. When platform users open, maintain, and close leveraged positions, they must pay fees, which is the core component of its fee revenue.
How does Ethereum’s Dencun upgrade affect its fee revenue?
The Dencun upgrade (implemented in 2024) introduced EIP-4844, which significantly reduced the Blob data fee cost for using Ethereum mainnet on Layer 2, directly lowering the fee revenue Ethereum mainnet can obtain from Layer 2 activity. The Block reported and confirmed that Ethereum’s 13% share in this week’s data reflects the ongoing fee compression effect of the upgrade.

