This guide is aimed at swing traders and cryptocurrency traders who want to use both indicators more effectively for entries, exits, and trend confirmation. It focuses on how Parabolic SAR and SuperTrend differ in calculation, signal behavior, volatility handling, performance in sideways markets, combined-use strategies, and practical limitations, so you can choose the right tool for managing positions and protecting gains in fast-moving crypto markets.
TL;DR
-
Parabolic SAR moves progressively toward price, making it useful for trailing stops and possible exits.
-
SuperTrend uses Average True Range to confirm bullish or bearish market direction.
-
Parabolic SAR usually reacts faster, while SuperTrend generally provides a steadier trend filter.
-
Both indicators can generate whipsaws in sideways markets.
-
SuperTrend may suit trade selection, while Parabolic SAR may suit position management.
| Comparison factor |
Parabolic SAR |
SuperTrend |
| Primary role |
Trailing exits and reversal warnings |
Trend confirmation and filtering |
| Main inputs |
Extreme price and acceleration factor |
Price midpoint, ATR and multiplier |
| Volatility adjustment |
Indirect |
Direct through ATR |
| Typical behaviour |
Tightens as a trend extends |
Maintains a volatility-based distance |
| Main weakness |
Premature pullback signals |
Later signals and range whipsaws |
| Better suited to |
Managing an open swing |
Choosing trade direction |
The central difference is how each indicator follows price. Parabolic SAR becomes more sensitive as a trend continues, while SuperTrend adjusts its distance according to volatility. Neither indicator predicts whether a trade will be profitable.
What Is Parabolic SAR and Its Acceleration Factor?
Parabolic SAR is a trend-following indicator designed by J. Welles Wilder that tracks an active directional move and identifies possible stop-and-reversal levels. Dots appear below price during bullish conditions and above price during bearish conditions, and Wilder also created rsi.
Its defining feature is the acceleration factor. With classic SAR settings of 0.02, 0.02, and 0.20, sar starts below price in an uptrend and moves progressively closer as price prints a new high. When the trend direction reverses, the dots flip to the other side, which can warn that momentum is weakening, but it does not confirm a lasting reversal.
For swing traders, the Parabolic SAR indicator is usually more useful as a trailing-exit reference than as an independent entry system. Its sensitivity can protect gains, but an ordinary pullback may also cause an early exit.
What Is SuperTrend?
SuperTrend is an ATR-based indicator that places a volatility-adjusted line above or below price. A line below price commonly signals bullish conditions, while a line above price signals bearish conditions.
The calculation starts with a price midpoint and adds or subtracts a multiple of Average True Range. The bands generally widen when volatility rises and narrow when it falls.
The SuperTrend indicator is mainly a trend-confirmation tool. It changes direction after price crosses the relevant volatility band, which can filter small fluctuations but may delay a signal.
How Do Their Signals Differ in Trend Direction?
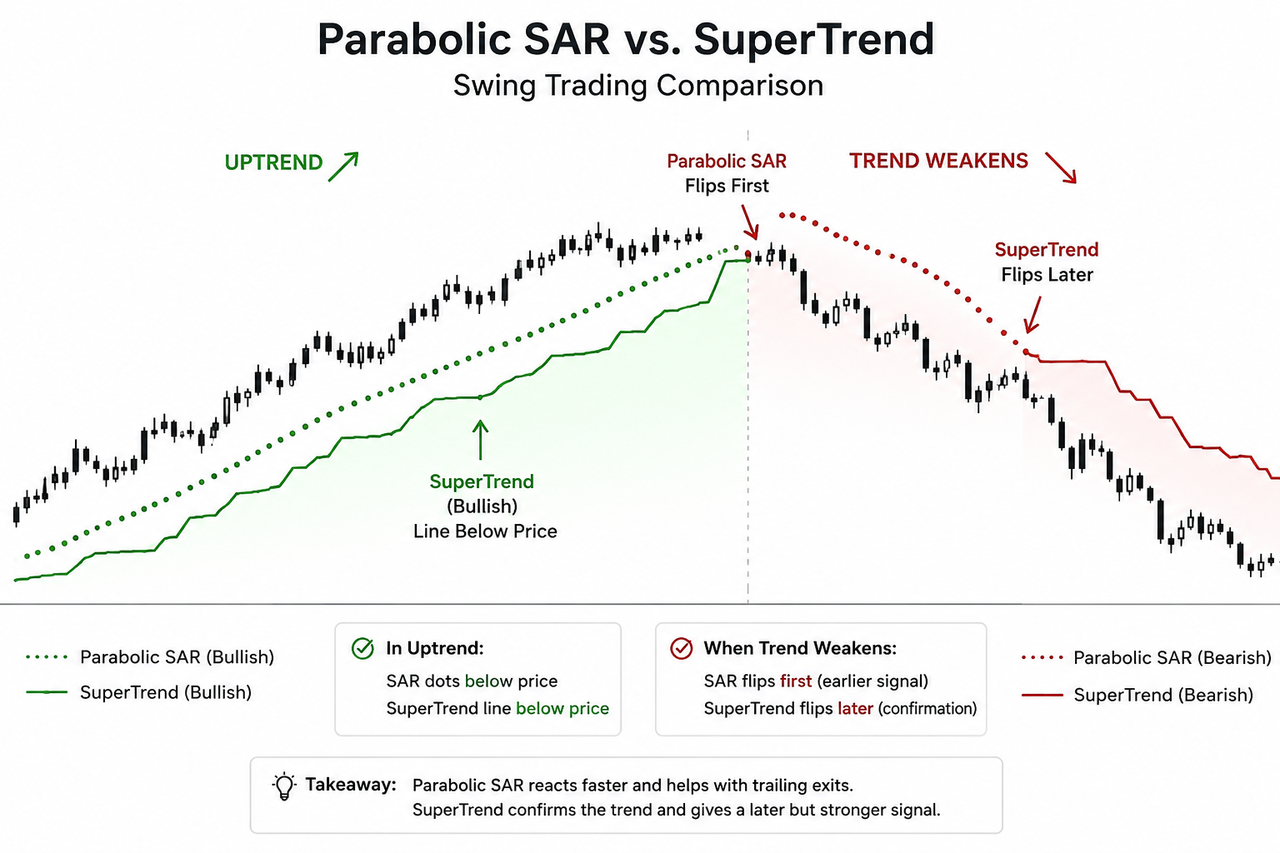
Parabolic SAR usually reacts faster to a weakening trend, while SuperTrend generally waits for a larger volatility-adjusted move.
During an uptrend, both may remain below price on each price bar. As the move develops, Parabolic SAR dots accelerate upward and may produce sar flips after a moderate pullback, with the dots moving to the other side of price. SuperTrend can remain bullish until price closes through its lower ATR-based boundary.
The trade-off is straightforward: Parabolic SAR provides earlier sar signals but more false reversals, while SuperTrend offers steadier confirmation with greater lag. A trader protecting an extended move may use that faster SAR response to act sooner. A trader trying to remain in a volatile trend may prefer SuperTrend’s wider buffer.
Which Is Better for Swing-Trading Entries?
SuperTrend is generally better for filtering entries because it provides a clear directional condition. Bullish setups can be considered while price remains above the active line, and bearish setups while the line remains above price.
A SuperTrend switch should not automatically trigger a trade. Price may cross the line during a failed breakout and return to the previous range. Better setups align with price structure, volume, momentum and nearby support or resistance.
A rising EMA 20 can confirm short-term direction, while the EMA 20 vs. EMA 50 relationship can show whether short-term momentum supports the broader swing.
Parabolic SAR can support an entry when a dot flip aligns with a confirmed breakout or reversal pattern. Used alone, the flip may reflect only a temporary retracement.
Which Is Better for Swing-Trading Exits?
Parabolic SAR is generally better for trailing exits because its level tightens as a trend extends. This helps protect more of an open move without relying on a fixed profit target.
SuperTrend can also serve as a trailing-stop reference, but its ATR-based distance often gives price more room. That wider buffer can help a position survive normal volatility, although it may return more unrealized gains before reversing.
| Exit objective |
More suitable indicator |
Reason |
| Protect gains during a mature swing |
Parabolic SAR |
Tightens toward price |
| Stay in a volatile trend longer |
SuperTrend |
ATR creates a wider buffer |
| React quickly to weakening price |
Parabolic SAR |
Often flips sooner |
| Avoid exits from small pullbacks |
SuperTrend |
Gives price more space |
Different settings can make either indicator faster or slower, so these describe typical rather than guaranteed behaviours.
Which Handles Volatility Better?
SuperTrend handles changing volatility more directly because ATR is built into its calculation. When volatility rises, the bands usually move farther from price. When volatility falls, they generally move closer.
Parabolic SAR does not adjust directly to ATR. Its responsiveness depends mainly on the acceleration factor and new extreme prices. A sharp but temporary pullback can therefore cross the SAR level, and a sharp pullback can trigger a flip even before volatility has clearly settled, even when the larger trend remains intact.
SuperTrend is not automatically superior in volatile cryptocurrency markets. A low multiplier may place the line too close to price, while a high multiplier may delay reversals. Settings should match the asset, timeframe and intended holding period, and tighter settings can make Parabolic SAR more responsive for short-term trading while also increasing noise.
Both indicators are less reliable in sideways markets because they need sustained directional movement. When price repeatedly crosses a narrow range, Parabolic SAR dots that would normally sit above price in a downtrend or below it in an uptrend may switch sides without a durable trend.
Parabolic SAR can become especially active because its stop-and-reverse structure assumes that one trend ending may begin another. SuperTrend may remain stable longer with wider settings, but repeated trend flips can still create whipsaws in this environment.
An ADX indicator can help assess whether directional movement is strong enough for a trend-following approach. ADX measures trend strength rather than direction. Some traders use SAR signals only when ADX is above 25 to help filter weak trend conditions.
Can They Be Used Together?
Parabolic SAR and SuperTrend can work together when each has a separate role. SuperTrend can define the permitted trading direction, while Parabolic SAR can manage the exit.
A practical framework is:
-
Identify the bullish or bearish SuperTrend condition.
-
Confirm that price structure agrees.
-
Use volume, momentum or ADX to filter weak setups.
-
Enter after a separate breakout or pullback trigger.
-
Follow Parabolic SAR as the swing develops.
-
Reassess when the dots flip or price invalidates the setup.
The MACD indicator can confirm whether momentum supports the signal. A Moving Average Ribbon can show whether broader trend alignment is expanding or compressing.
Additional indicators should contribute new information rather than repeat the same trend signal.
Which Should Swing Traders Choose for Trend Following Strategies?
SuperTrend is usually the stronger choice for confirming direction, while Parabolic SAR is usually the stronger choice for managing an established swing.
Choose Parabolic SAR when the objective is protecting gains, reacting quickly to weakening price and following a clear trend. Choose SuperTrend when the objective is filtering setups, adapting to volatility and allowing more room during ordinary pullbacks.
Consider neither as a primary signal when price is trapped in a narrow range, market structure lacks direction, settings have not been tested or position-sizing rules are undefined.
The practical verdict is role-based rather than absolute. SuperTrend can answer which direction deserves attention, while Parabolic SAR can answer when continued participation no longer fits the trade-management plan.
Risks and Limitations
Parabolic SAR and SuperTrend are lagging indicators based on historical price data. They cannot predict unexpected news, liquidity disruptions, price gaps or sudden changes in market sentiment.
Signals also depend heavily on settings. Parameters that perform well on one cryptocurrency or timeframe may fail in another market regime. Selecting settings only because they maximize past results can create overfitting.
An indicator reversal is not a complete trading instruction. It does not define position size, maximum loss, liquidity, execution price or risk-to-reward conditions.
Educational disclaimer: Technical indicators cannot guarantee trading outcomes. Digital assets are volatile, and indicator signals may fail during rapid price changes, low-liquidity conditions, or sideways markets. Traders should independently evaluate position size, leverage, execution risk, and invalidation levels.
Conclusion
Parabolic SAR and SuperTrend each serve a different purpose in swing trading rather than competing as direct substitutes. SuperTrend generally provides stronger trend confirmation through its ATR-based design, while Parabolic SAR is often more effective for managing trailing exits as a trend develops. The more suitable indicator depends on whether the priority is identifying the market direction or protecting an existing position. Many swing traders use both together, with SuperTrend filtering trade direction and Parabolic SAR managing exits, while confirming signals with price structure and sound risk management.
FAQ
Is Parabolic SAR better than SuperTrend?
Parabolic SAR is better suited to responsive trailing exits, while SuperTrend is better suited to volatility-adjusted trend confirmation. The stronger choice depends on the required function.
Which indicator gives earlier reversal signals?
Parabolic SAR often gives earlier signals because its dots accelerate toward price as a trend continues. Earlier warnings can protect gains but may also cause premature exits.
Can SuperTrend be used as a stop-loss?
The SuperTrend line can provide a dynamic stop reference because its distance from price changes with ATR. Traders still need separate execution, slippage and account-risk rules.
Do both indicators work for cryptocurrency trading?
Both can be applied to cryptocurrency charts, but continuous trading, rapid volatility changes and market noise can increase false signals. Price structure, liquidity and risk controls remain necessary.







