Summary
-
Bollinger Bands are a classic technical analysis indicator that combines both trend and volatility information, and can identify changes in market structure through price position relative to the channel.
-
In the crypto asset market, which is characterized by high volatility and pronounced fat-tail distributions, traditional Bollinger Band parameters and conventional usage methods may not always remain effective, and therefore must still be tested in combination with market characteristics.
-
This report systematically reviews the core structure, common patterns, and trading implications of Bollinger Bands, with a focus on analyzing their typical manifestations in crypto markets, including squeezes, breakouts, expansions, and band walks.
-
On this basis, this report constructs a mean reversion strategy based on Bollinger Band squeeze conditions, and conducts a historical backtest using BTC/USDT 5-minute data.
-
The backtest results show that a simple mean reversion strategy without optimization is easily affected by high trading frequency, fee erosion, and false breakout market conditions; after applying volatility filters, cooldown mechanisms, and bandwidth screening, the stability of the strategy improves significantly.
-
The research shows that Bollinger Bands still retain strong analytical value in crypto markets, but the effectiveness of the strategy depends heavily on parameter selection, market regime identification, and long-term sample testing.
Introduction
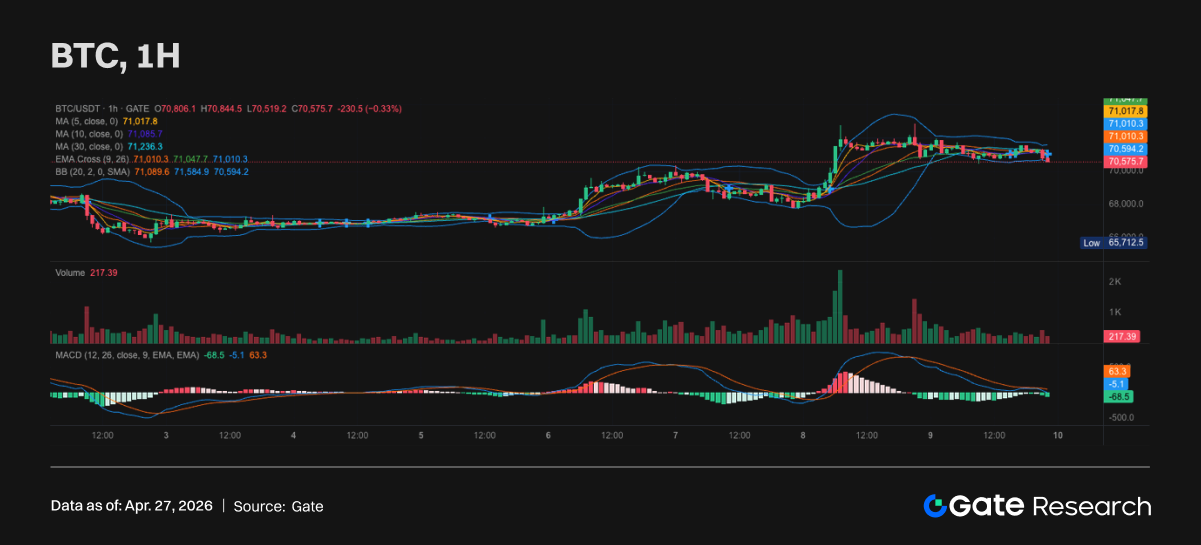
Bollinger Bands, proposed by John Bollinger, are a technical analysis indicator that combines trend and volatility information. The indicator constructs a dynamic price channel using a moving average and the standard deviation of price, and is used to measure relative price position, market volatility, and potential trend changes.
In traditional financial markets, Bollinger Bands are usually used to identify:
-
Changes in market volatility
-
Trend formation or strengthening
-
Extreme prices and potential reversals
However, the crypto asset market features higher volatility and fatter-tailed distributions, so whether traditional parameter settings, such as SMA(20), are still effective remains worthy of further research. This report will conduct a systematic analysis of the Bollinger Band indicator and, on that basis, build a mean reversion trading strategy to evaluate its actual performance in crypto markets through historical backtesting.
Structure of the Bollinger Band Indicator
The classic calculation formula for Bollinger Bands is as follows: • Middle Band = n-period simple moving average (SMA) • Upper Band = SMA + k × standard deviation • Lower Band = SMA − k × standard deviation
Among them, the middle band is the average closing price over the past n periods, while the standard deviation σ is used to measure the degree of price volatility. By adding and subtracting the standard deviation on both sides of the moving average, a price fluctuation range can be constructed.
Under ideal normal distribution conditions:
• ±1σ: about 68% of data
• ±2σ: about 95% of data
• ±3σ: about 99.7% of data
Therefore, when price touches or breaks through the Bollinger Band boundary, it usually means that price is at a relatively extreme position, and the market may enter one of two situations: mean reversion or trend continuation. It should be noted that the price distribution of financial assets usually exhibits fat-tail characteristics. In actual statistics, about 85%–90% of prices lie within the Bollinger Band range, rather than the theoretical 95%.
Functions of Bollinger Bands
Because Bollinger Bands integrate both trend information and volatility information at the same time, they possess strong comprehensiveness within a technical analysis framework:
-
Trend information: the middle band, usually a moving average, reflects the medium-term direction and strength of price movement
-
Volatility information: the upper and lower bands, calculated based on standard deviation, depict the degree of expansion and contraction in price volatility
Based on this structure, Bollinger Bands can not only describe the "direction" of price, but also measure the market's "degree of activity." Therefore, compared with ATR, which reflects only volatility, ADX, which measures only trend strength, or a single moving average indicator that provides only directional reference, Bollinger Bands can provide a more complete depiction of market conditions.
In practical trading and quantitative research, Bollinger Bands are usually used to identify the following three core market characteristics:
3.1 Changes in Volatility
Changes in Bollinger Band width can directly reflect the dynamic evolution of market volatility:
-
When the upper and lower bands narrow ("contraction" or "squeeze"), it indicates that market volatility is low and price has entered a consolidation phase
-
When the upper and lower bands expand, it usually means volatility is rising and the market may be entering a trending phase
This cyclical "contraction-expansion" pattern makes Bollinger Bands one of the important tools for identifying potential breakout moves.
3.2 Trend Direction Identification
In trending markets, price often exhibits the characteristic of "walking along the band":
-
In an uptrend, price more frequently approaches or moves along the upper band, while the middle band acts as dynamic support
-
In a downtrend, price tends to stay close to the lower band, while the middle band turns into resistance
Therefore, Bollinger Bands can be used not only to determine trend direction, but also to help judge whether a trend is continuing or weakening.
3.3 Price Reversal Signals
Bollinger Bands are also commonly used to identify reversion behavior after price deviates from the mean:
• When price clearly breaks above the upper band, it may indicate short-term "overbought" conditions and the existence of pullback pressure
• When price falls below the lower band, it may indicate "oversold" conditions and the possibility of a rebound
However, it should be noted that in strong trending markets, "touching the band" does not necessarily imply reversal, and may instead reflect trend continuation. Therefore, confirmation is usually needed in combination with volume, momentum indicators, or price structure.
Common Bollinger Band Patterns and Signals
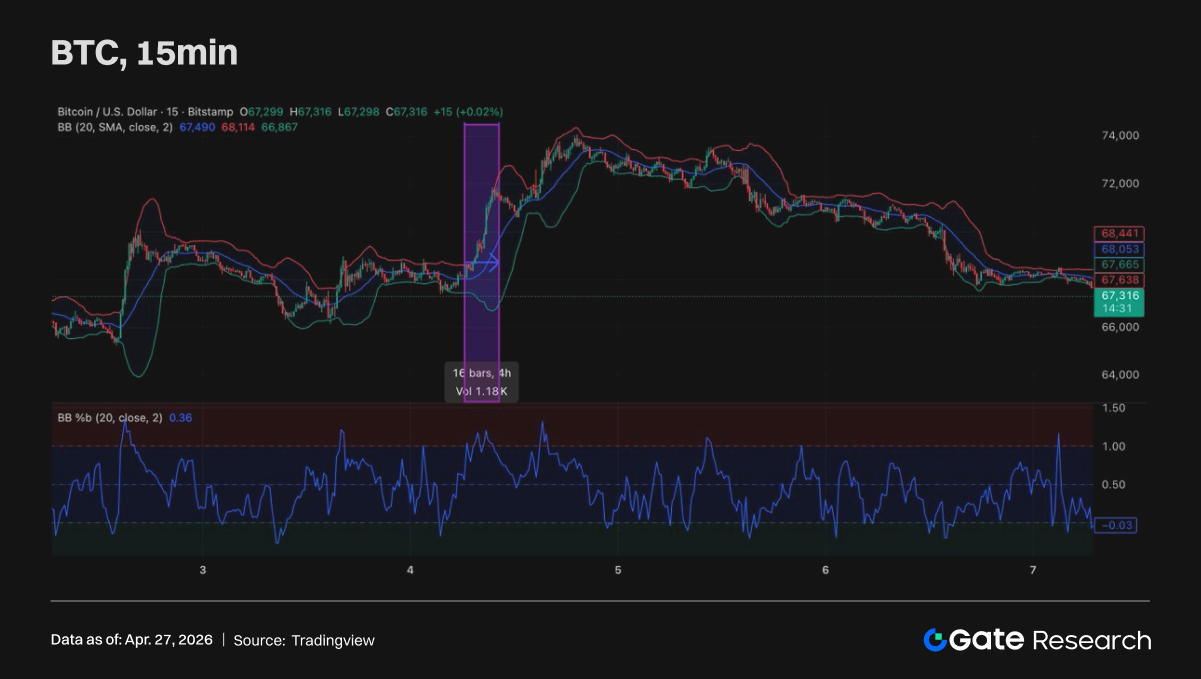
4.1 Squeeze
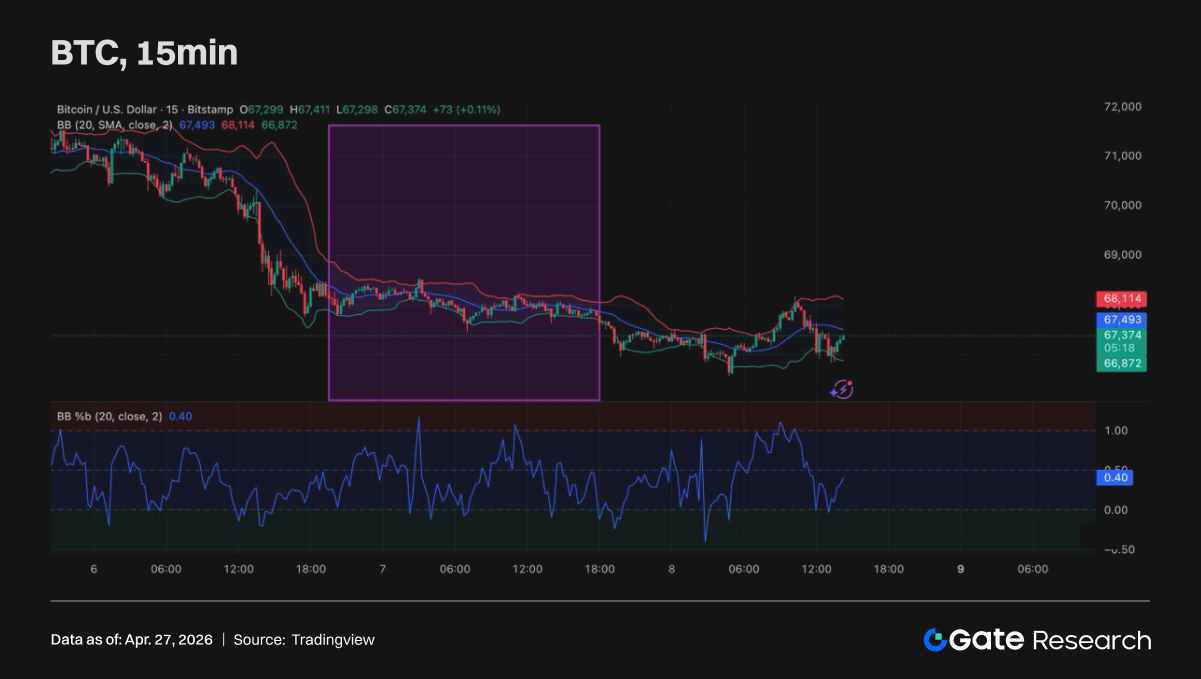
When the width of the Bollinger Bands stays at a relatively low level for an extended period, the market usually enters a squeeze state. The typical feature of this phase is a significant decline in volatility, while market direction remains unclear. If trading volume is also at a relatively low level at this time, price often presents a range-bound structure.
In trading practice, some market participants believe that a Bollinger Band squeeze often signals that a major move is about to occur, because low-volatility environments are usually difficult to sustain for long and may subsequently transition into a new volatility cycle. However, from actual trading experience, this relationship does not always hold consistently. In many cases, what is more common during the Bollinger Band squeeze phase is repeated price oscillation within the range. Therefore, in this type of market environment, short-cycle range trading or scalping strategies often have relatively high applicability.
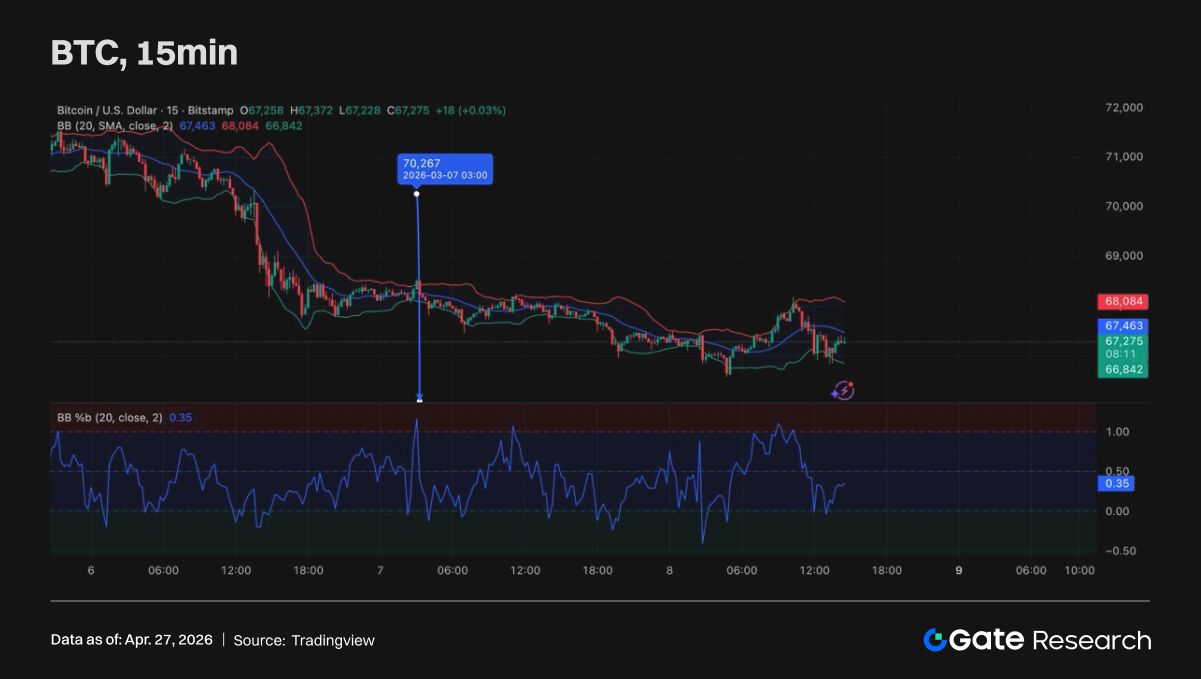
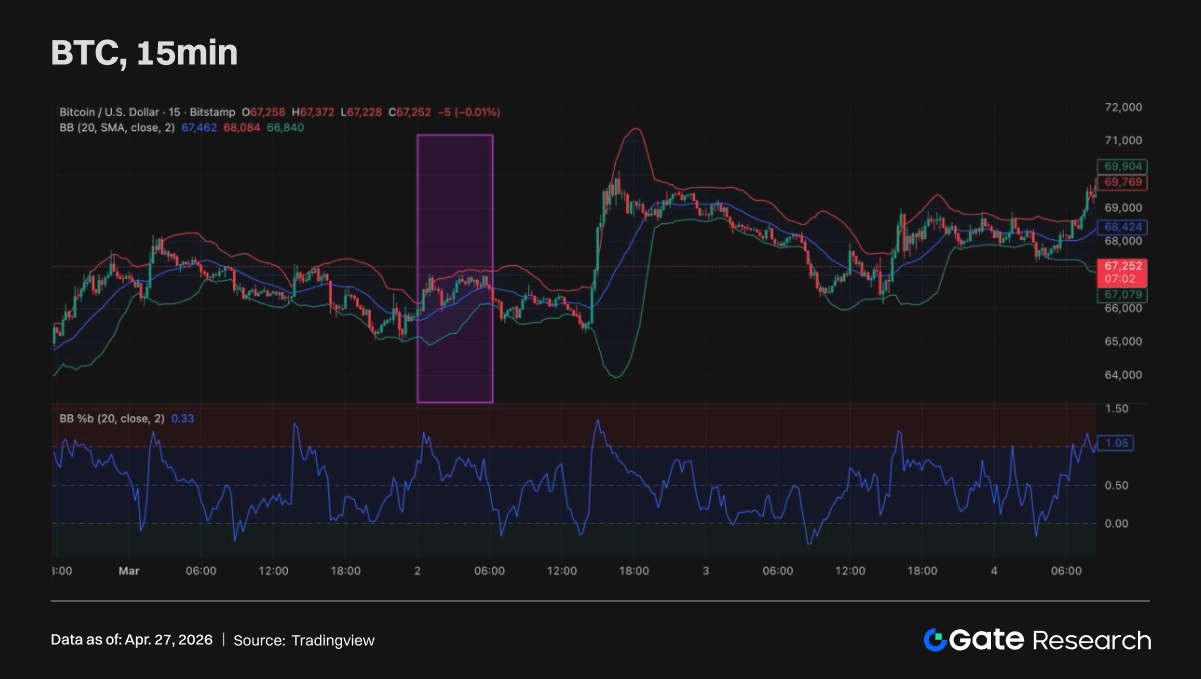
4.2 Breakout
When price breaks above the upper Bollinger Band or below the lower Bollinger Band, it is usually regarded as a breakout structure. From the indicator perspective, %b can be used to determine whether price has left the Bollinger Band range. When %b is greater than 1, it means price has broken above the upper band; when %b is less than 0, it means price has broken below the lower band.
Around Bollinger Band breakouts, there are usually two different trading approaches in the market. One is reversal trading based on mean reversion logic, which assumes that price may revert to the mean after an extreme deviation occurs. The other is a trend-following strategy, which assumes that a breakout may signal the start of a new trend move and therefore participates in the market in the direction of the move.
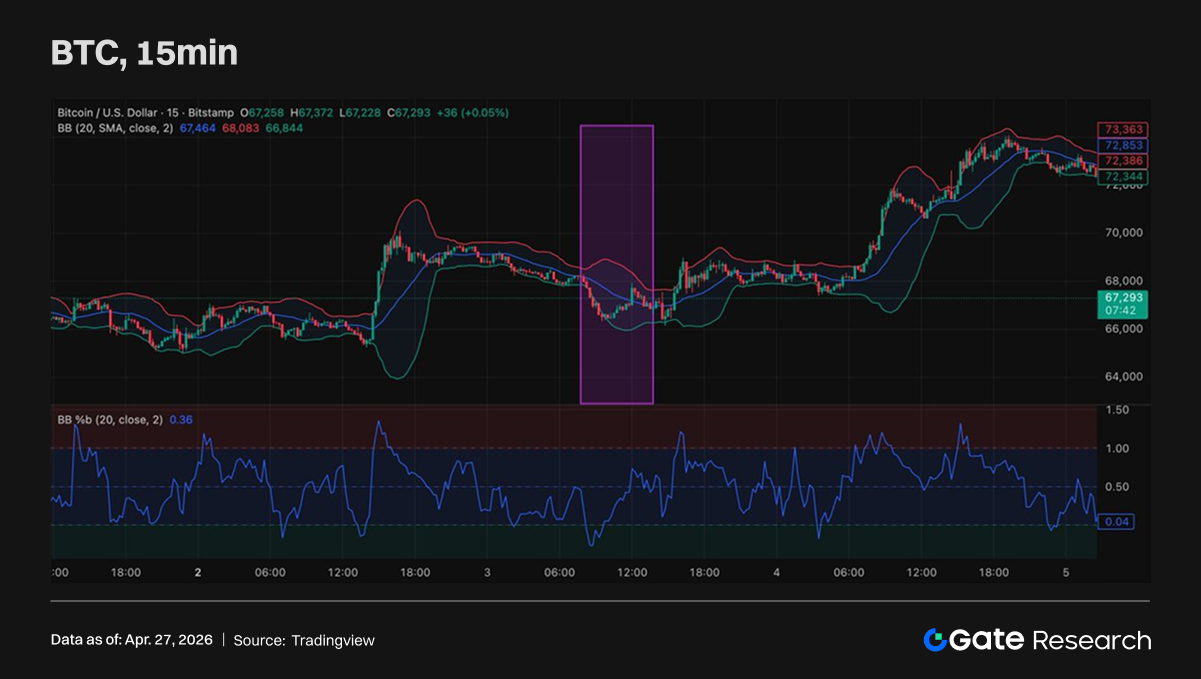
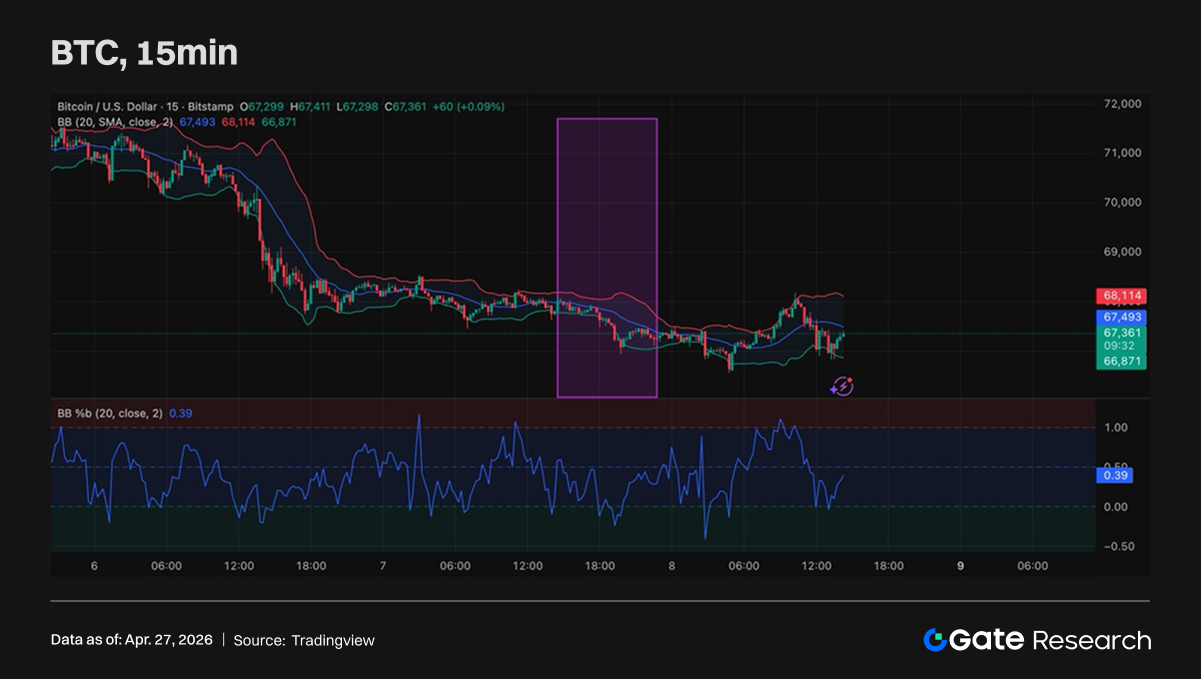
4.3 Expansion
Expansion usually appears as a gradual increase in Bollinger Band width, with the upper and lower bands beginning to open outward. From the perspective of market structure, this pattern reflects rising volatility and indicates that the market is entering a more active phase.
Expansion often occurs after a breakout or during the stage when a trend is gradually forming. As the amplitude of price fluctuations expands and market participation increases, trending moves also become more likely to appear. It should be noted that expansion itself is not a clear buy or sell signal, but it usually means that the market has already moved from a low-volatility environment into a trending phase, or that the trend is continuing to strengthen.
4.4 Band Walk
In strong trending conditions, price may sometimes continue moving along the upper or lower Bollinger Band, and this phenomenon is usually referred to as a Band Walk. In an uptrend, price may repeatedly approach or even touch the upper band, while the overall trend continues upward; in a downtrend, price may continue to decline along the lower band.
This structure usually indicates strong trend momentum. Therefore, in a Band Walk environment, entering a countertrend trade merely because price touches the Bollinger Band boundary often carries high risk, because price may continue walking along the band for a long period.
4.5 M Top and W Bottom
M Top and W Bottom are methods of using Bollinger Bands to identify potential reversal structures. An M Top is similar to a double-top structure: the first high usually touches or breaks above the upper band, while the second high fails to touch the upper band again, showing that upward momentum has weakened. If price subsequently breaks below the middle band, it may further confirm a downward trend.
A W Bottom is similar to a double-bottom structure. The first low may fall below the lower band, while the second low does not break below the lower band again, indicating that selling pressure is gradually weakening. If price subsequently breaks above the middle band or a key resistance level, an upward reversal structure may form.
4.6 Head Fake
Head Fake refers to a false breakout structure that appears after a Bollinger Band squeeze. Its typical manifestation is that price first breaks the Bollinger Band in one direction, but quickly returns inside the range and then moves in the opposite direction.
This type of movement often forms a bull trap or bear trap. Therefore, in actual trading, some traders do not enter immediately on the first breakout, but instead wait for confirmation signals or a retest structure after the breakout before judging whether the trend has truly formed. If Bollinger Bands are used for trend trading or reversal trading, identifying false breakout structures is particularly important.
Strategy Idea: Mean Reversion Under Bollinger Band Squeeze Conditions
From the previous analysis of Bollinger Band structure, it can be seen that when Bollinger Band width continues to narrow, the market is usually in a low-volatility phase. In this environment, price is more likely to fluctuate repeatedly within the range rather than immediately form a one-sided trend. Therefore, a natural strategy idea is to build a mean reversion strategy based on the Bollinger Band squeeze phase.
The core assumption of this strategy is that when market volatility is at a relatively low level and price touches the Bollinger Band boundary, price is more likely to revert to the mean rather than continue developing in the breakout direction. Under this assumption, the trading logic can be summarized as follows: in a narrow-band environment, short when price touches the upper Bollinger Band, go long when price touches the lower Bollinger Band, and use the Bollinger middle band as the main take-profit target. Once price effectively breaks through the Bollinger Band range, the mean reversion assumption is considered invalid, and the position is stopped out and exited in time.
Next, the narrow-band distribution of Bollinger Bands is statistically analyzed, with the following parameter settings:
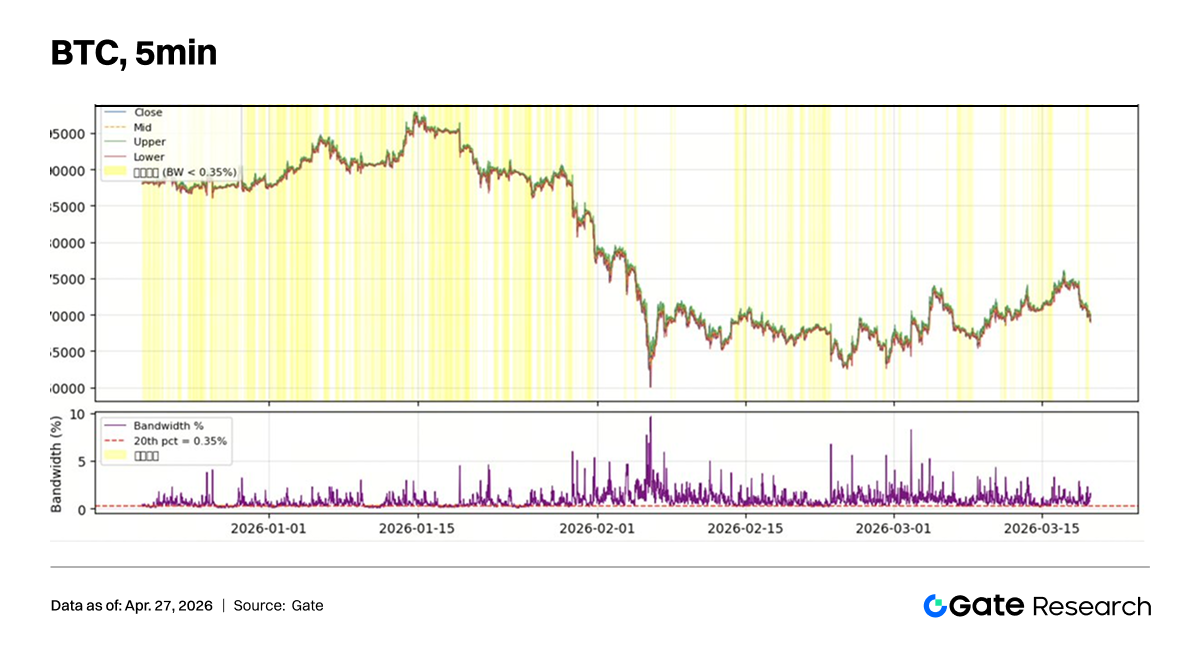
From the statistical results, the narrow-band state of Bollinger Bands appears in about 20% of the sample data. This means that, in theory, the strategy has relatively sufficient trading opportunities, while also concentrating trading activity in low-volatility range environments, thereby reducing the adverse impact of trending conditions on a mean reversion strategy.
It should be pointed out that a Bollinger Band squeeze does not necessarily mean that price will oscillate stably. In some cases, trends may become more likely to emerge after the squeeze. Therefore, in strategy design, additional filtering mechanisms are still required to identify market regimes, so as to avoid frequent trading in environments that are unsuitable for mean reversion.
Backtest Results and Strategy Optimization
To verify the above strategy idea, a historical backtest was conducted on the BTC/USDT market. The backtest used 5-minute candlestick data over the sample period from March 9, 2025 to March 19, 2026, with data sourced from Binance. Initial capital was set at USD 100,000, and transaction fees were calculated at the Futures Maker fee rate of 0.018%.
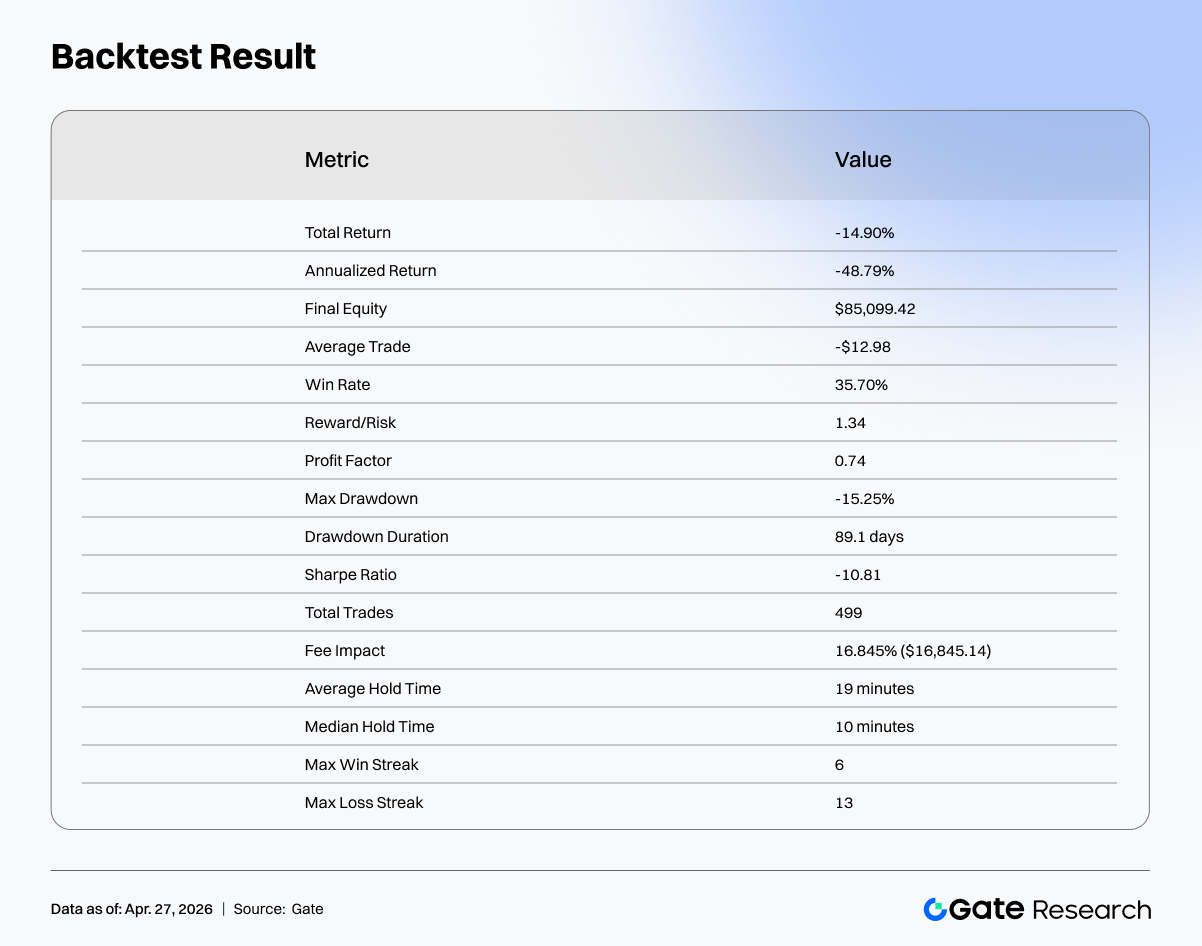
The backtest results of the initial version of the strategy were poor, showing an overall state of continuous losses. Further analysis of the trade data shows that the main problems were concentrated in three aspects:
-
The strategy traded too frequently. Because the initial logic traded only according to price touching the Bollinger Band boundary, the system generated a large number of trading signals within a short period, with an average holding time of only about 19 minutes. In a high-frequency trading environment, random price fluctuations can interfere significantly with the strategy, causing a large number of trades to be triggered by short-term market noise.
-
Trading costs produced obvious erosion of returns. Due to the excessive number of trades, cumulative fees accounted for nearly 16.8% of total capital. Even if the strategy itself was not significantly loss-making, it could still be consumed by persistent trading costs.
-
During the Bollinger Band squeeze phase, the market did not oscillate stably as expected, but instead frequently produced false breakouts and even trend initiation. This caused some mean reversion trades to experience rapid adverse movement after entry, resulting in consecutive stop-losses.
In response to the above issues, the strategy underwent multiple rounds of optimization. The optimization direction was mainly concentrated in three aspects.
-
Reduce trading frequency through volatility filtering and trade cooldown mechanisms. By introducing volatility indicators such as ATR, extremely low-volatility environments can be filtered out, and repeated trades within a short time can be reduced, thereby lowering the impact of noise trades.
-
Increase the profit potential of individual trades. By widening the take-profit range and introducing a staggered take-profit structure, part of the position can capture additional profit when price extends further, thereby improving the overall profit-loss ratio.
-
Further distinguish market regimes. The research found that under extremely narrow-band conditions, breakout moves are more likely to occur. Therefore, the strategy excludes extremely narrow-band ranges and executes mean reversion trades only in medium-bandwidth ranges.
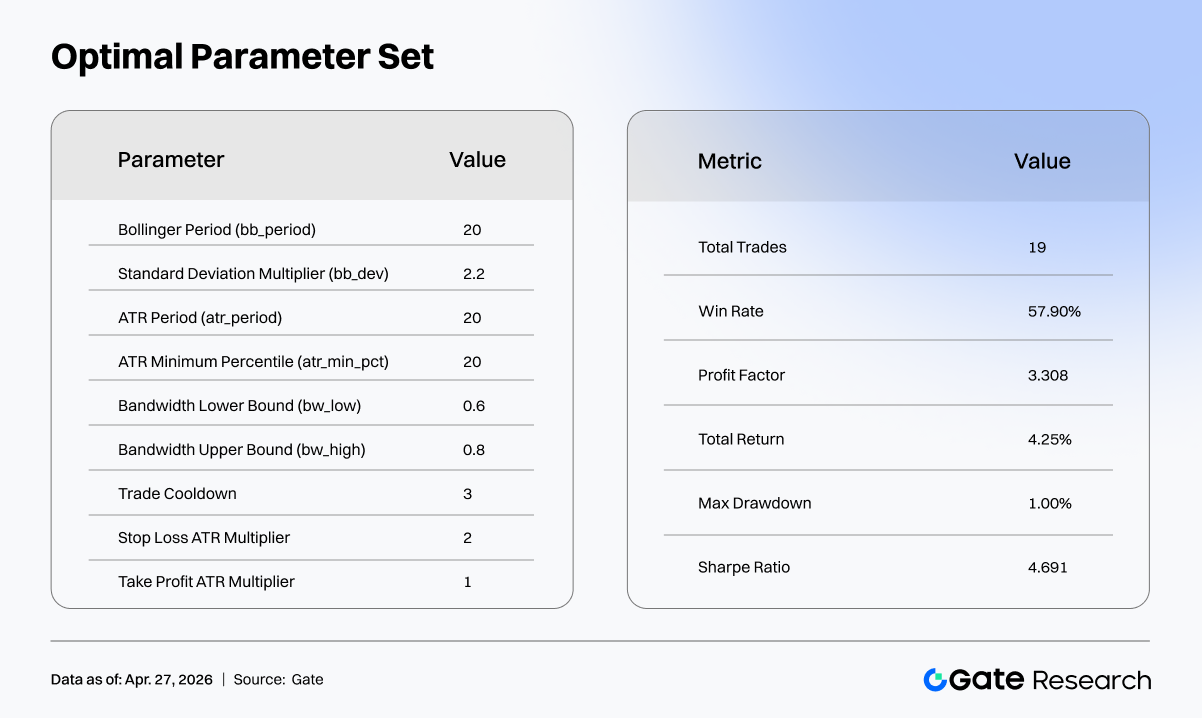
After the above optimizations, the performance of the strategy improved significantly. The number of trades declined sharply, the fee ratio dropped substantially, and overall strategy performance moved from sustained losses to near break-even, gradually entering a stable state. Strategy performance continued to improve. Trading frequency was further reduced, and the overall trade structure became cleaner, no longer being frequently disturbed by market noise. The strategy's win rate increased to about 76%, maximum drawdown was controlled at around -0.5%, and the equity curve also began to show a relatively stable upward structure.
Parameter Optimization and Research Conclusions
After the strategy structure became basically stable, key parameters were further optimized systematically. To avoid bias arising from subjective parameter selection, a grid search method was used for batch testing of strategy parameters, with a total of about 19,683 parameter combinations tested.
During the screening process, strategy combinations with obviously poor performance were first eliminated, including parameter combinations with Profit Factor less than or equal to 1, maximum drawdown greater than 20%, or too few trades. Among the remaining combinations, a composite scoring method was used for ranking, with scoring metrics including the Sharpe ratio, profit factor, total return, and maximum drawdown.
The scoring function was designed to balance risk and return, with relatively high weight assigned to the Sharpe ratio and profit factor, while also imposing a certain degree of penalty on drawdown. Through this screening process, strategy configurations with relatively reasonable risk-return structures could be identified from a large number of parameter combinations.
Within the sample period, the Sharpe ratio of some parameter combinations could reach about 4.6. Judging from the results, the strategy has already achieved a certain degree of stability. However, it must be emphasized that this backtest covers only about three months of time, so there is still a risk of overfitting. A more robust approach is to use a longer period of historical data, such as more than four years of data, and cover complete market cycles, so as to further verify the stability of the strategy.
In addition, this research did not systematically optimize the period parameter of Bollinger Bands. Traditional markets usually use SMA(20) as the default parameter, but in the crypto market environment, this parameter is not necessarily optimal. Different period parameters may produce completely different strategy performance, and therefore this part still deserves further research.
References:
Gate Research is a comprehensive blockchain and cryptocurrency research platform that provides deep content for readers, including technical analysis, market insights, industry research, trend forecasting, and macroeconomic policy analysis. Disclaimer Investing in cryptocurrency markets involves high risk. Users are advised to conduct their own research and fully understand the nature of the assets and products before making any investment decisions. Gate is not responsible for any losses or damages arising from such decisions.