Mining_sLittleSheep

vip
Age 3.4 Year
Peak Tier 2
Don't be fooled by the many hundredfold coins in the crypto world; very few actually achieve tenfold gains. If you don't understand it, you won't be able to hold it. Even if you do understand it, you still might not be able to hold it. So don't listen to too many myths. Really, if you make ten times on a coin, you should be satisfied. Just listen to the stories. Follow me; here you'll find not just the crypto world, but many other interesting things as well!
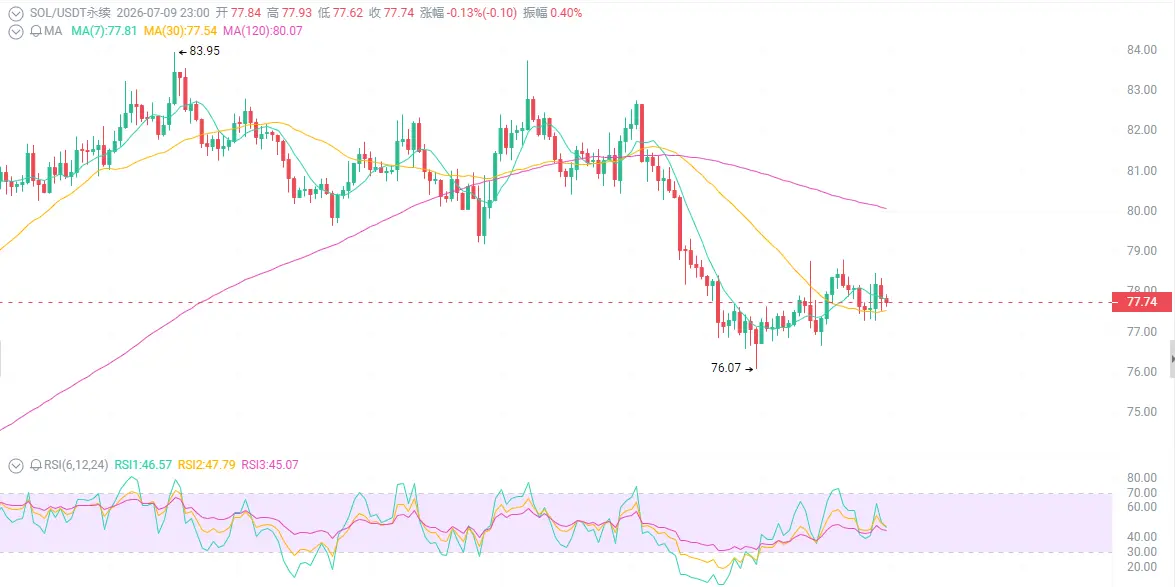
SOL at $77, can't hold on?
First look at the surface: down 74%, retail screams "Solana is dead."
Up 0.5% in the past 24 hours, up 1% in a week, up 17% in 30 days, volume $1.8 billion, market cap $45.3 billion, firmly ranking 7th. The K-line tells you: $76 has held five times, the 4-hour chart stands above the moving average, MACD is slightly turning bullish. The inflection point is here, whoever moves first wins.
First thing: ETF is coming, institutions want to buy the "king of altcoins."
On July 8, Bitwise officially filed a Solana ETF application.
You read that right—after BTC and ETH, Wall
BTC1.38%
ETH0.40%
SOL0.74%
View Original
post-image
  • Reward
  • Comment
  • Repost
  • Share
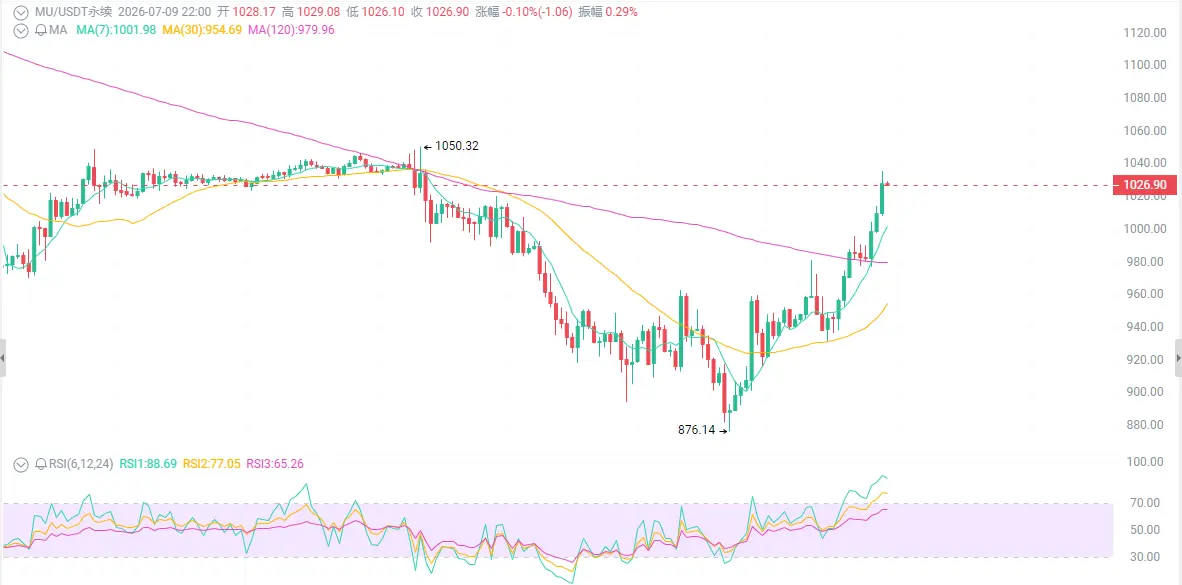
MU at $1027—did you get shaken out of the car?
First, look at the surface: it fell from $1255 to $900, a 25% drop—scary enough, right?
But look again today—pre-market continued to rise another 4%, reaching $1010. Bank of America five-star analyst Vivek Arya directly said, “The market is undervaluing Micron,” with a target price of $1550. The Wall Street average target is $1563, implying another 64% upside.
First thing: Is the 25% pullback a “golden pit,” or a “burial pit”?
Over the past 12 months, MU is up 700%, and up 229% year-to-date this year. Q2 revenue was $23.86 billion, up 196% year ov
BTC1.38%
ETH0.40%
MU7.70%
View Original
post-image
  • Reward
  • Comment
  • Repost
  • Share
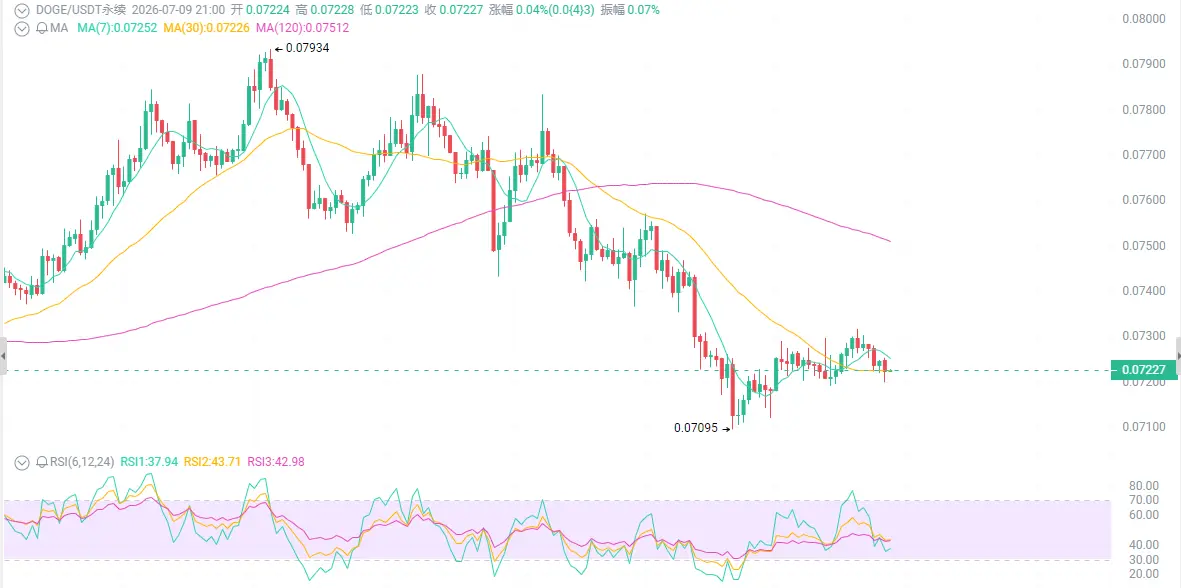
DOGE at $0.072—are you despairing?
First, the surface: a relentless slide, teetering at $0.07.
In the past 24 hours alone, it’s down 2.5%; in a month, down 16%; over six months, down 49%; and down 38% YTD. From the May high of $0.118 all the way rolling down to $0.072, nearly half the market value has evaporated, with trading volume of 400 million DOGE—lukewarm, neither here nor there. $0.07 is a monthly-level trend line that has held for three years—once it breaks, the next target is $0.066. Either it goes to zero, or you get a double-bottom reversal. Which side are you betting on?
First thin
BTC1.38%
ETH0.40%
DOGE0.66%
View Original
post-image
  • Reward
  • 1
  • Repost
  • Share
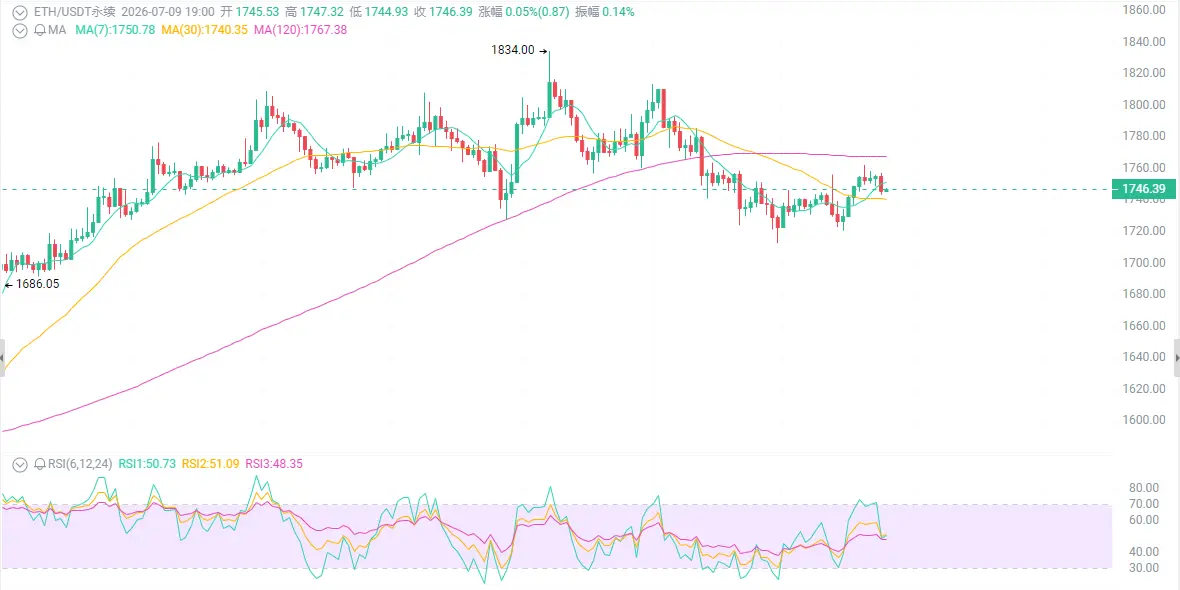
$1,745 ETH, are you still holding?
First, the surface: the price has dropped, but someone is secretly accumulating.
Up 9% in the past 7 days, up 3.8% in 30 days, but if you have been holding from $2,000, you are still down 12%. Market cap $21.1 billion, volume $10 billion — indicating bulls and bears are fighting fiercely in the 1720-1800 range. 1720 has held twice, forming a 'double bottom pattern'. If you sell at a loss at this level, you might slap your thigh in regret.
First thing: ETFs are seeing crazy inflows, but the price isn't rising?
Net inflow of $162 million in 5 days, with $70 mil
BTC1.38%
ETH0.40%
SOL0.74%
View Original
post-image
  • Reward
  • Comment
  • Repost
  • Share
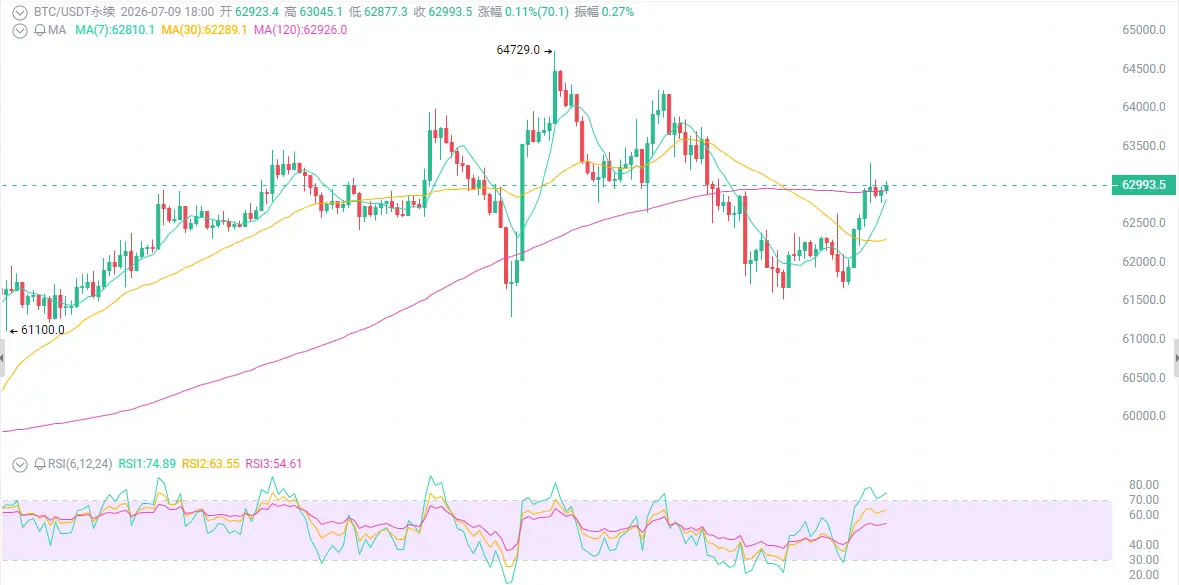
BTC at $63,000—are you panicking?
First, look at the surface: it’s bouncing, but it hasn’t fully bounced back.
Over the past 24 hours, it’s up 1.2%, bouncing from the late-June low of $58,000–$59,000 back to around $63,000. Market cap is $1.26 trillion, and trading volume is 26 billion (as stated). Price has moved above some short-term moving averages, but it’s still being pinned down hard by the 50-day EMA and the 200-day EMA. A typical technical rebound—not a trend reversal.
Either it breaks out to $65,000 and then heads for $70,000, or it gets smashed back down to $58,000. Which side are yo
BTC1.38%
ETH0.40%
SOL0.74%
View Original
post-image
  • Reward
  • 2
  • Repost
  • Share
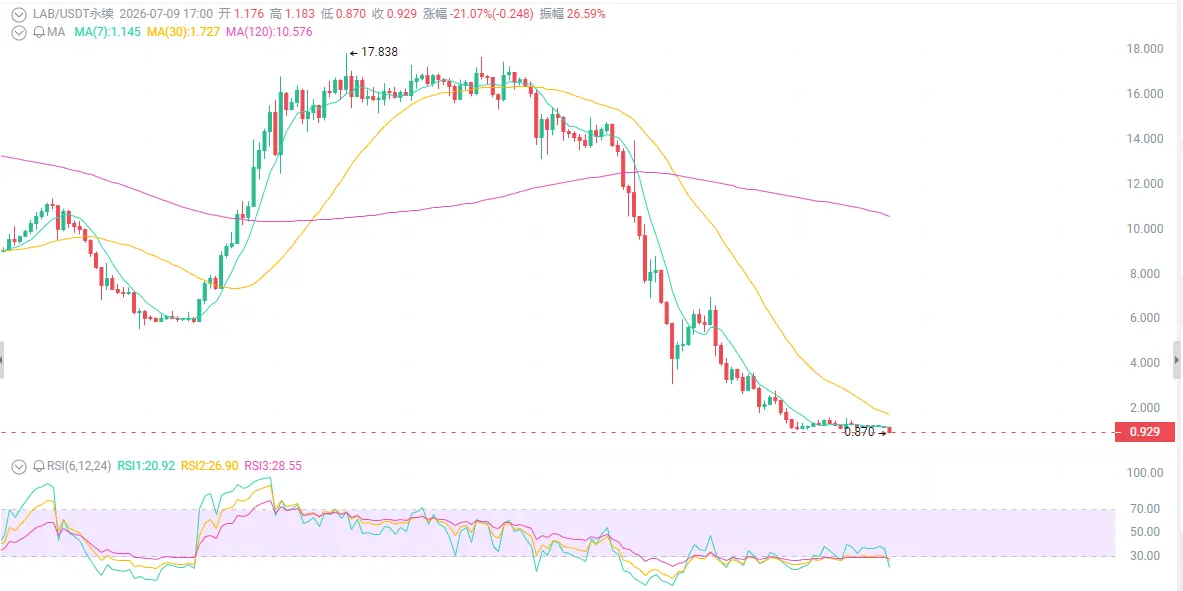
$1 LAB, are you brave enough to buy the dip?
First, look at the surface: from $20 to $1, retail investors cry, "Never touch altcoins again."
In early June it was still standing proudly at $20, but in July it was cut in half again and again, bottoming below $1, market cap evaporating from $5 billion to less than $1 billion. Weekly chart down 86%, monthly chart down 90%, all moving averages broken.
First thing: Unlock crash, but whales have already dumped.
Token unlocks. Starting in July, locked tokens for investors, airdrop participants, and team were gradually released. On-chain data shows wha
BTC1.38%
ETH0.40%
LAB3.58%
View Original
post-image
  • Reward
  • 1
  • Repost
  • Share
GateUser-0a13b2fa:
The review is very objective 👍👍
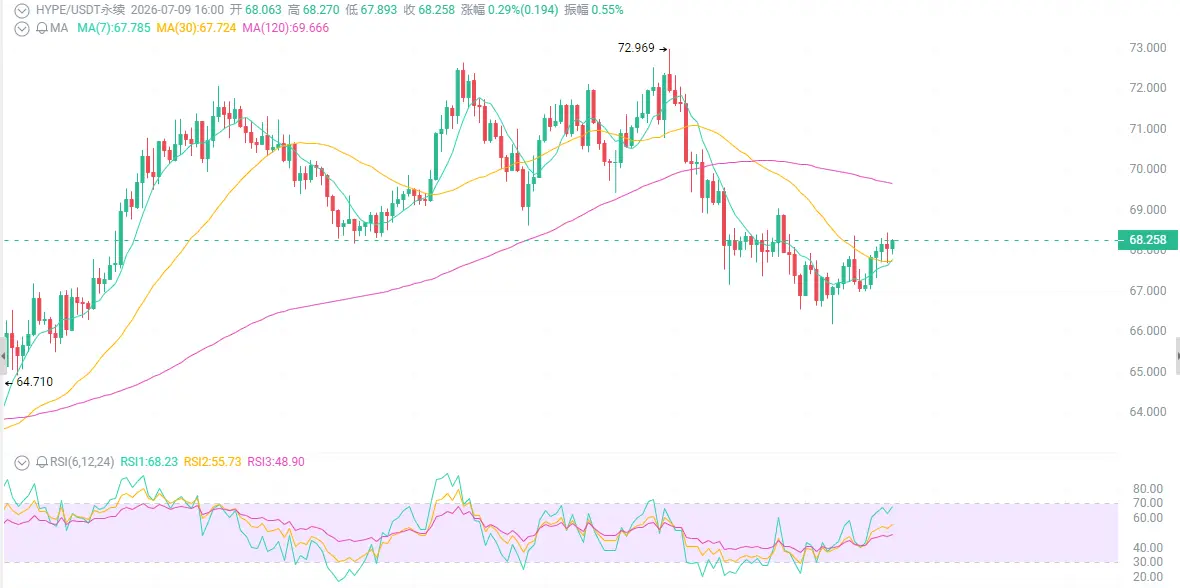
$67 HYPE—dare you to catch it?
First, look at the surface: the broader market is crashing, but it’s holding sideways without dropping.
Over the past 7 days, it has risen 7% against the trend, with a year-to-date gain of 165%. Its market cap has surged to $17 billion, firmly keeping it in the top 10, and its 24-hour trading volume is $400 million. The candlestick chart tells you this: the $66–68 range has been defended multiple times. On pullbacks, volume shrinks; on rebounds, volume expands. In a strong coin, a pullback is basically handing out money—don’t get scared out and left behind.
First
BTC1.38%
ETH0.40%
HYPE-0.06%
View Original
post-image
  • Reward
  • Comment
  • Repost
  • Share
ETF sees net inflows for 3 consecutive days, yet Bitcoin is falling? Institutions are entering while you are trapped — where is the problem?
U.S. spot Bitcoin ETFs have seen net inflows for three consecutive days.
On July 6, a single-day net inflow of $266 million ended an eight-week outflow streak.
BlackRock's IBIT raked in $209 million in a single day, buying approximately $250 million worth of BTC over two trading days. In previous weeks, BlackRock had a cumulative net outflow of $2.7 billion.
Ethereum ETFs have also been active, with net inflows of $26.93 million over four consecutive days
BTC1.38%
ETH0.40%
SOL0.74%
View Original
  • Reward
  • Comment
  • Repost
  • Share
Retail investors in South Korea are cutting losses, while Wall Street is going on a frantic buying spree—same SK Hynix, two different worlds.
South Korea’s stock market is plunging.
On July 8, the KOSPI crashed 5.35%, triggering a circuit breaker during the trading session. From its June peak, the South Korean market has pulled back more than 20%, officially entering a technical bear market.
So what about SK Hynix?
In just nine trading days, its share price slid from nearly 3 million won to 2.07 million won, and its market value evaporated by more than $260 billion. On July 8 alone, it dropped
BTC1.38%
SKHY8.32%
MU7.70%
View Original
post-image
  • Reward
  • Comment
  • Repost
  • Share
Saylor Says BTC Annual Gains of 3.3% Can Pay Dividends Forever
—I couldn’t even laugh after hearing that
3.3%.
You read that right—not 33%, not 13%.
Yesterday, Strategy’s Michael Saylor told the whole world: as long as Bitcoin’s annualized growth exceeds 3.3%, capital appreciation can cover STRC preferred stock dividends indefinitely.
Even if Bitcoin’s annual growth is 0%, the company still has 31 years of dividend funds.
But there’s one detail Saylor didn’t mention.
First, the facts: what does 3.3% actually mean?
Strategy currently holds 843,775 Bitcoin, with $2.55 billion in cash reserves.
P
BTC1.38%
ETH0.40%
SOL0.74%
View Original
  • Reward
  • Comment
  • Repost
  • Share
Bombs are flying, but BTC only dropped 2%? The market is numb—that's the most dangerous thing.
The U.S. military bombed Iran for two consecutive days.
Over 80 targets were destroyed—air defense systems, command networks, coastal radar, and over 60 speedboats.
Oil tanker traffic through the Strait of Hormuz has "basically stopped." Brent crude briefly broke $80 intraday, surging over 7% in a single day.
So what happened?
Bitcoin dropped 2%, hovering around $62,000.
The three major U.S. stock indexes—the Dow fell 1%, the S&P 500 fell 0.3%, and the Nasdaq actually rose 0.2%.
Gold? Also falling. F
BTC1.38%
ETH0.40%
SOL0.74%
View Original
post-image
  • Reward
  • Comment
  • Repost
  • Share
The Fed says, “We are united,” but when you turn to page X of the minutes, it says, “Some people want to raise rates”
—Which one do you believe?
At 2:00 a.m. on July 9, the Fed told the whole world:
“All participants unanimously supported keeping interest rates unchanged.”
United in one spirit, determined like a solid force, with peaceful days ahead.
But if you really believe it, then you’re the greenest leek of all.
Flip open these freshly released meeting minutes—on which page does it say: “A few participants believed there were reasons to raise rates at the June meeting.”
Didn’t they say “a
BTC1.38%
ETH0.40%
SOL0.74%
View Original
  • Reward
  • Comment
  • Repost
  • Share
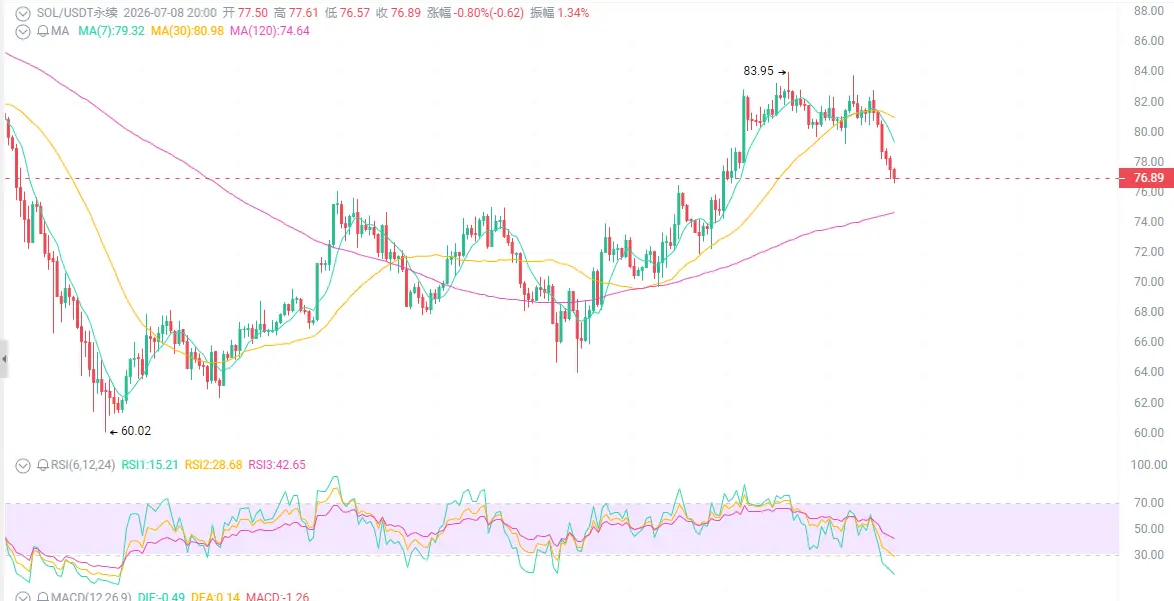
$77 SOL, did you sell at a loss?
Let's look at the surface: heavy negative pressure, retail investors panic-sold everything.
Down 4% in the past 24 hours, hitting a low of $76.64. It's still up 4.89% over 7 days, but today's big red candle is glaring. The K-line tells you: it hit the $82 wall three times and got pushed back again.
But the weekly chart is up 19%, the monthly chart up 16%, and it has already rebounded 38% from the $60 bottom. Do you trust today's red candle or the trend of the past month?
First thing: Pump.fun is dumping, but the market has become "immune."
Pump.fun sold another
BTC1.38%
ETH0.40%
SOL0.74%
View Original
post-image
  • Reward
  • Comment
  • Repost
  • Share
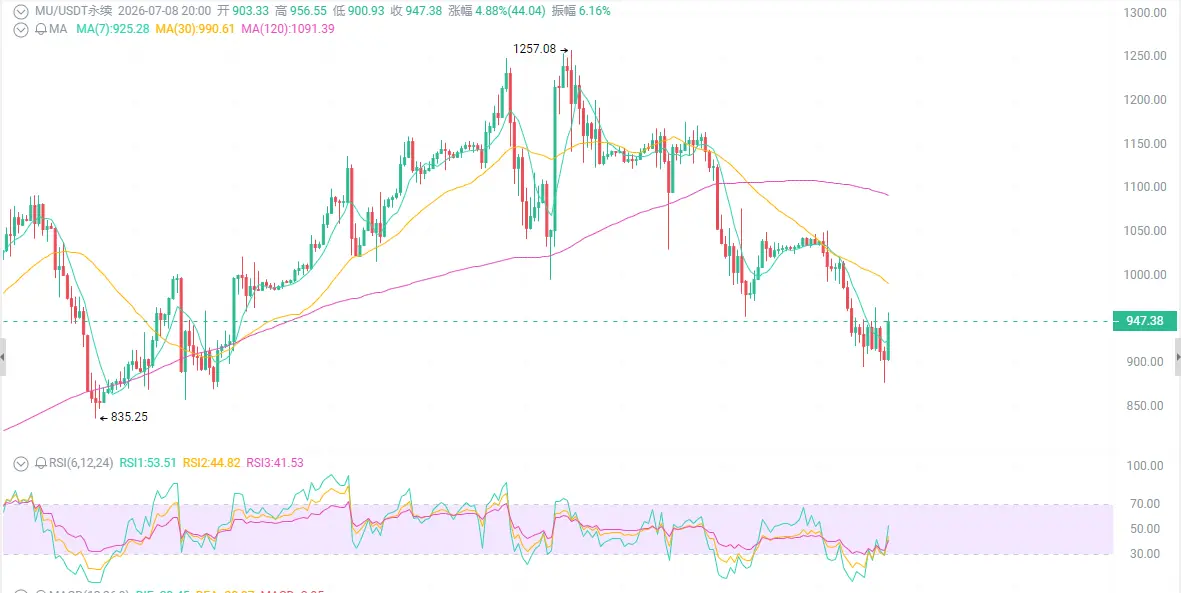
$950 MU, did you get cut?
First, the surface: semiconductor sector bleeding, retail panic shouting "top."
The Philadelphia Semiconductor Index fell over 7% intraday, MU closed down 4.71% at $938.38, its lowest close since June 10. The candlestick tells you: from the all-time high of $1,255 on June 25, it's dropped over 25% — but don't forget, this stock is still up 230% year-to-date, and over 650% in the past 12 months.
Thing one: earnings were absurdly strong, but the stock fell.
Q3 revenue of $41.5 billion, up 346% YoY, up 74% sequentially. Non-GAAP EPS of $25.11, 17% above market expectatio
BTC1.38%
MU7.70%
SNDK14.92%
View Original
post-image
  • Reward
  • 1
  • Repost
  • Share
SoominStar:
1000x VIbes 🤑
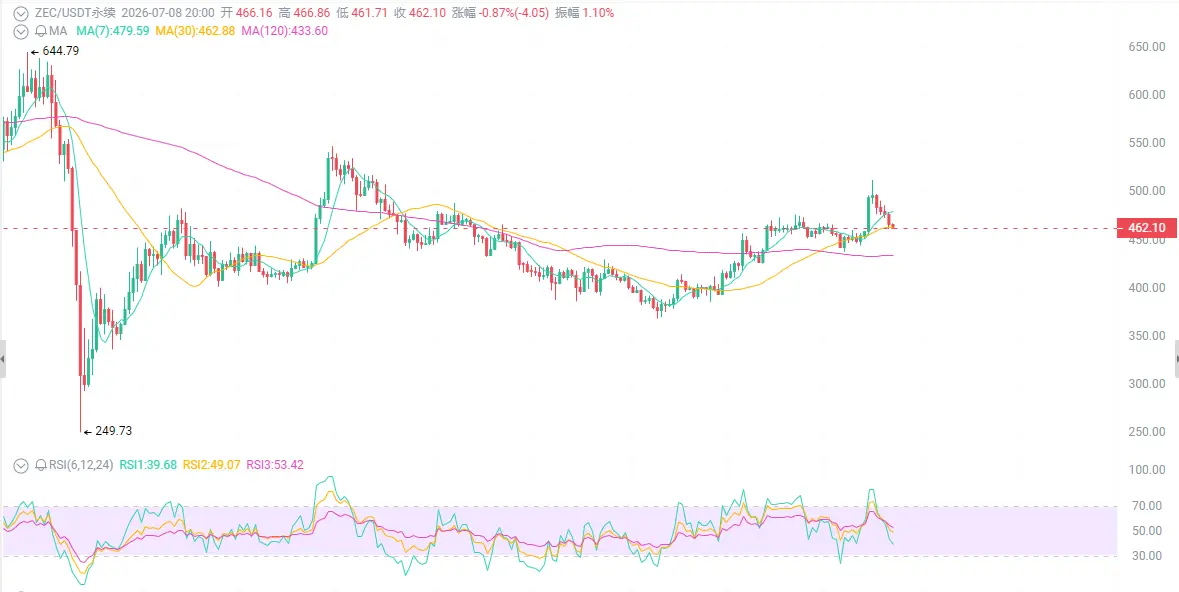
ZEC at $462, still afraid?
Let's look at the surface: daily pullback of 4%, retail shouting "crash again."
Up 16% in the past 7 days, from a June low of $250 to nearly $500 at the peak, market cap of $7.8 billion firmly in the top 15. The K-line tells you: the 440-450 support zone held three times, MACD buy signal confirmed, pre-upgrade — don't get shaken out.
First thing: the Ironwood upgrade is coming, a critical vulnerability is plugged.
At the end of May, the Orchard pool vulnerability was exposed, ZEC plunged 40% in a single day, everyone shouting "privacy coins are finished." What happen
BTC1.38%
ETH0.40%
ZEC1.92%
View Original
post-image
post-image
  • Reward
  • Comment
  • Repost
  • Share
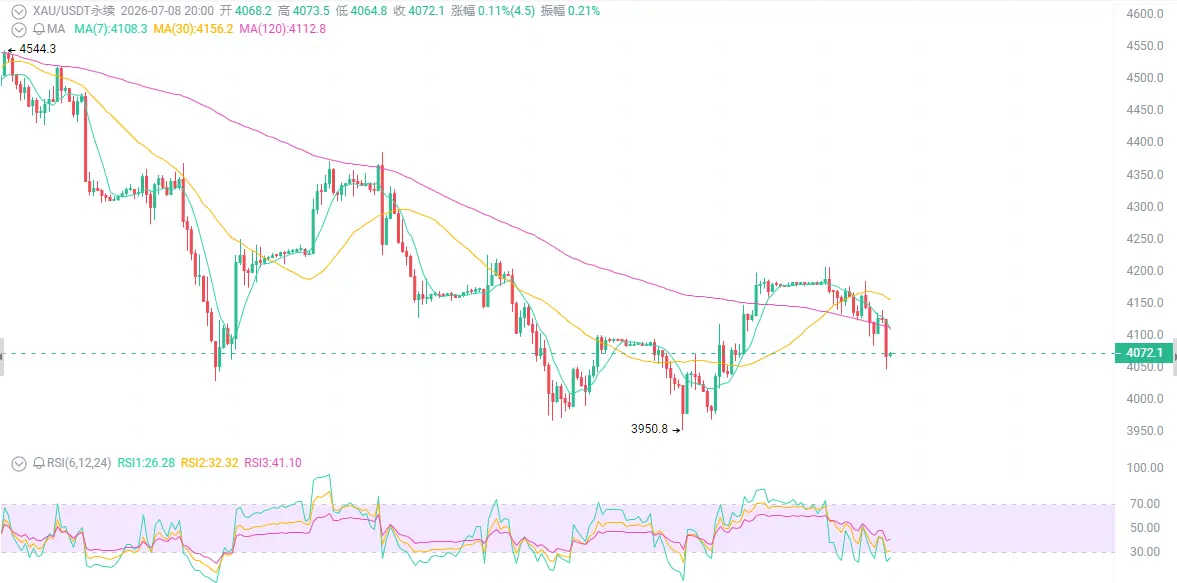
$4,065 gold—do you dare to buy the dip?
First, the surface picture: a barrage of negative news—yet safe-haven assets are kneeling instead.
Today spot gold opened below $4,100, with a low of $4,040; at one point during the day, it was down more than 1.5%. From the January historical high of $5,602, gold has now retraced a total of nearly 27-30%. The news flow is all “reasons it should be going up”—war in the Middle East, the rupture between the US and Iran, and a surge in oil prices—but gold keeps falling.
First thing: a surge in oil prices, instead, becomes gold’s “death warrant.”
On Tuesday,
BTC1.38%
ETH0.40%
XAU2.18%
View Original
post-image
  • Reward
  • Comment
  • Repost
  • Share
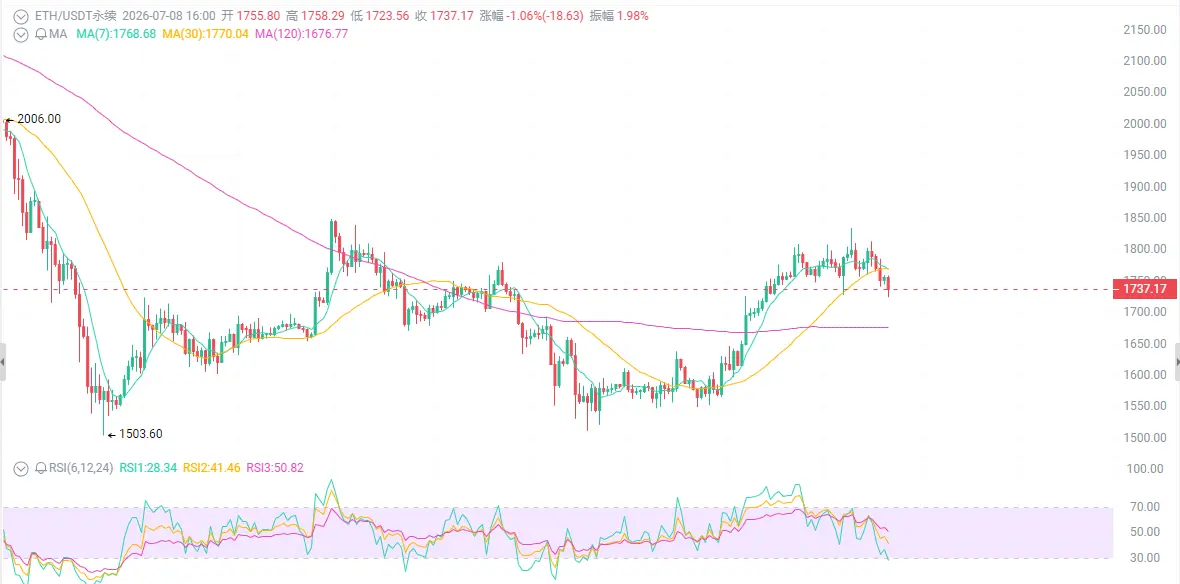
$1,737 ETH, are you still holding?
BTC is still consolidating at 60k, while ETH has nearly dropped back to 1,600. The foundation is restructuring, Vitalik is cutting the budget, and the upgrade is delayed—everyone is cursing that "Ethereum is done." But every time despair is deepest, the bottom quietly appears.
First thing: Vitalik cuts the budget, and you think it's bearish?
In early July, the Ethereum Foundation restructured, and Vitalik announced a roughly 40% cut to the foundation's budget.
As soon as the news broke, the market's first reaction was—"The foundation is out of money? Is the p
BTC1.38%
ETH0.40%
SOL0.74%
View Original
post-image
  • Reward
  • Comment
  • Repost
  • Share
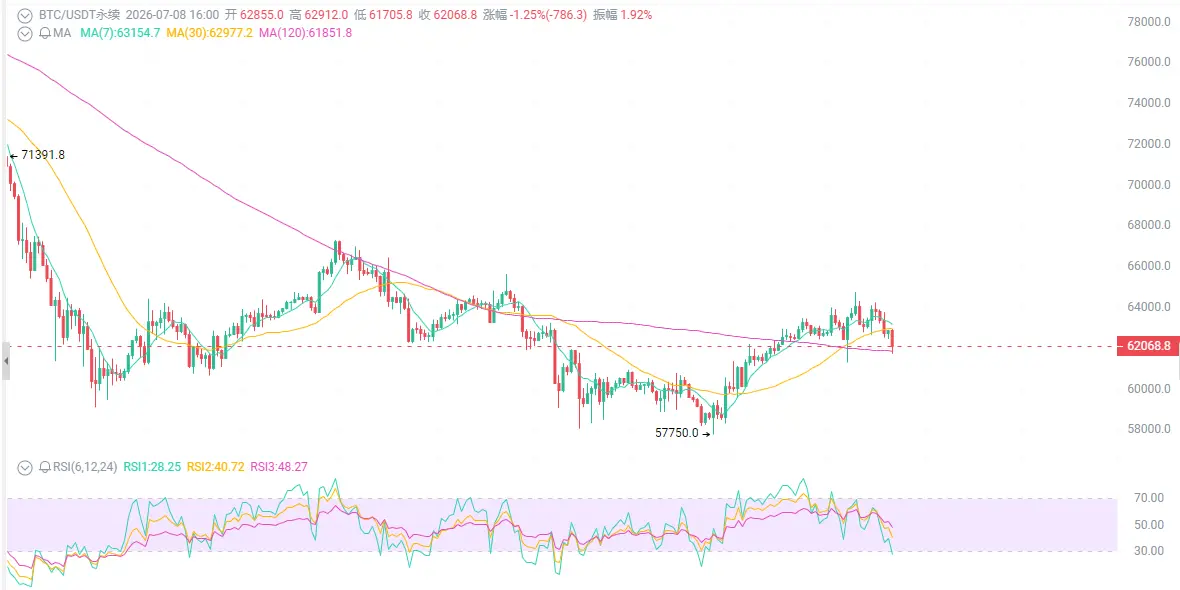
Bitcoin at $62k – are you panicking?
On July 8, Bitcoin fell to $62,000. It dropped 1.6% in 24 hours, with over 100k people liquidated across the market.
Just last week, it had surged to $64,500, reigniting hope that "the bull is back." But then the U.S. military struck over 80 targets in Iran, and Iranian missiles slammed directly into American military facilities in the Gulf region.
Oil prices skyrocketed, and risk assets plunged across the board.
First: Geopolitical conflict is bearish, but institutions haven't run.
On July 8, Bitcoin spot ETFs saw net inflows for the third consecutive day,
BTC1.38%
ETH0.40%
SOL0.74%
View Original
post-image
  • Reward
  • Comment
  • Repost
  • Share
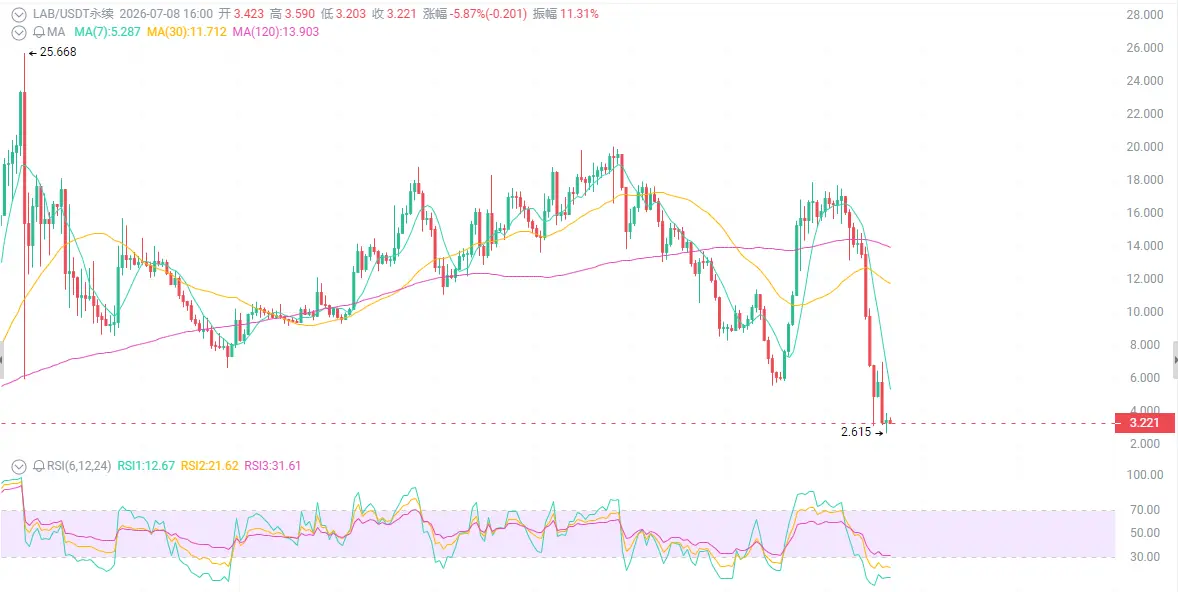
3.4 USD LAB, dare you buy the dip?
A week ago, LAB was at 18.42 USD. Three days ago, it crashed from 13 USD straight through 7.5 USD. Today, it hit a low near 2.6 USD. Current price is 3.4 USD, down 82% in a week.
Market cap evaporated from 4.7 billion USD to just over 1 billion. 24-hour trading volume is 180 million tokens, 14 times the 15-day average volume.
This isn't a pullback. This is a crash.
First thing: ZachXBT warned you back in May.
On-chain detective ZachXBT publicly accused in May: LAB insiders control over 95% of effective circulating supply.
You think you're trading against the
BTC1.38%
SOL0.74%
LAB3.58%
View Original
post-image
  • Reward
  • 9
  • Repost
  • Share
OwnFlight:
If you can't even buy the dip at 0.2, you think you're bottom-fishing him, but he's bottom-fishing your house.
View More
  • Pinned