Greg Miller
已验证的内容创作者 | 教育内容 | 自行研究

- 赞赏
- 点赞
- 评论
- 转发
- 分享
People always frame it as a battle. Crypto vs banks. DeFi vs TradFi. The future vs the past.
I think that framing misses what's actually happening.
Let me explain both simply, because most people have a clearer picture of one than the other.
Traditional finance, what people in the space call TradFi, is the system most of us grew up with. Banks, stock markets, ETFs, commodities, bonds. It's regulated, established, and has been the backbone of how money moves globally for decades. It has its limitations, accessibility barriers, slow settlement times, heavy intermediaries, but it also has infrast

- 赞赏
- 点赞
- 评论
- 转发
- 分享
- 赞赏
- 点赞
- 评论
- 转发
- 分享
The No. 9 jersey isn't just a number it's a symbol of responsibility, courage, and believing when others don't.
I'd wear it with pride, give everything on the field, and let my actions tell the story.
Ready for the next kickoff.
@Binance #WhoIsNumber9
I'd wear it with pride, give everything on the field, and let my actions tell the story.
Ready for the next kickoff.
@Binance #WhoIsNumber9

- 赞赏
- 点赞
- 评论
- 转发
- 分享

- 赞赏
- 点赞
- 评论
- 转发
- 分享
- 赞赏
- 点赞
- 评论
- 转发
- 分享
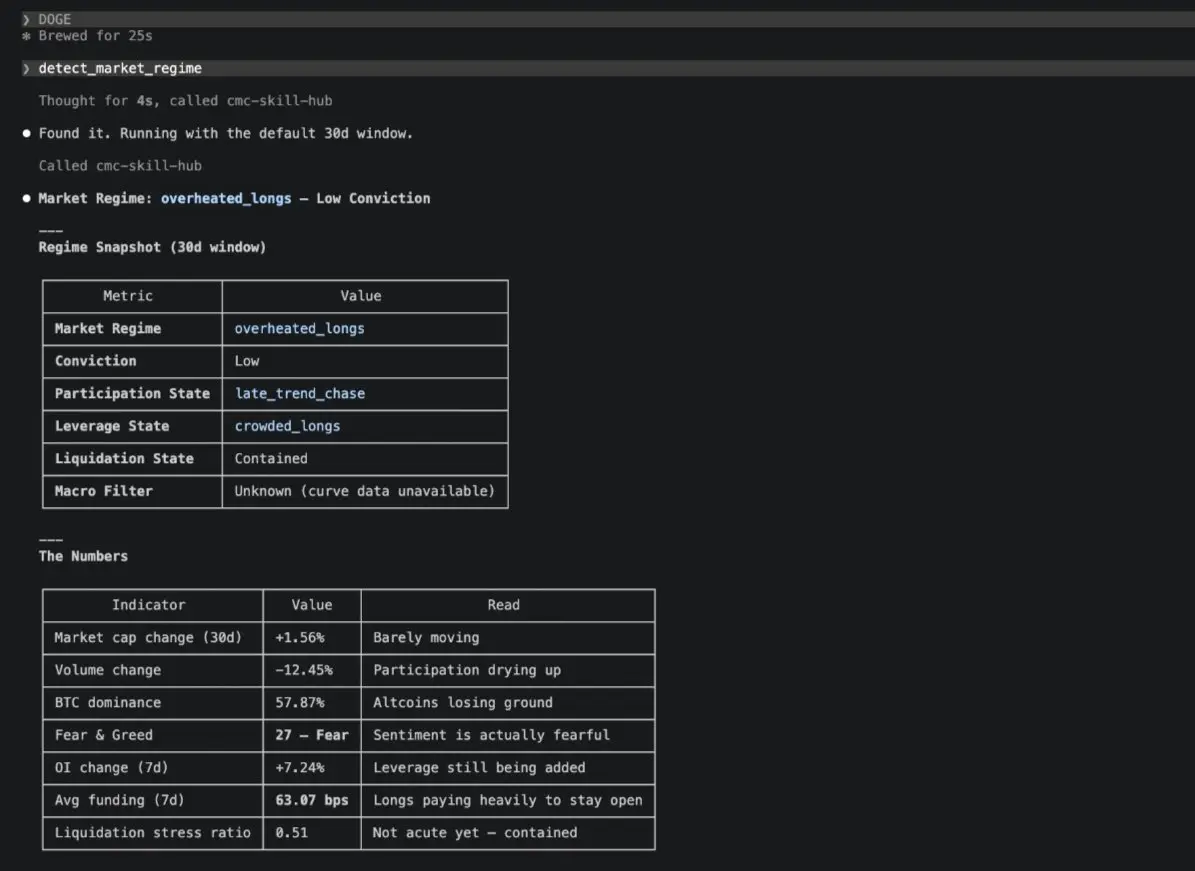
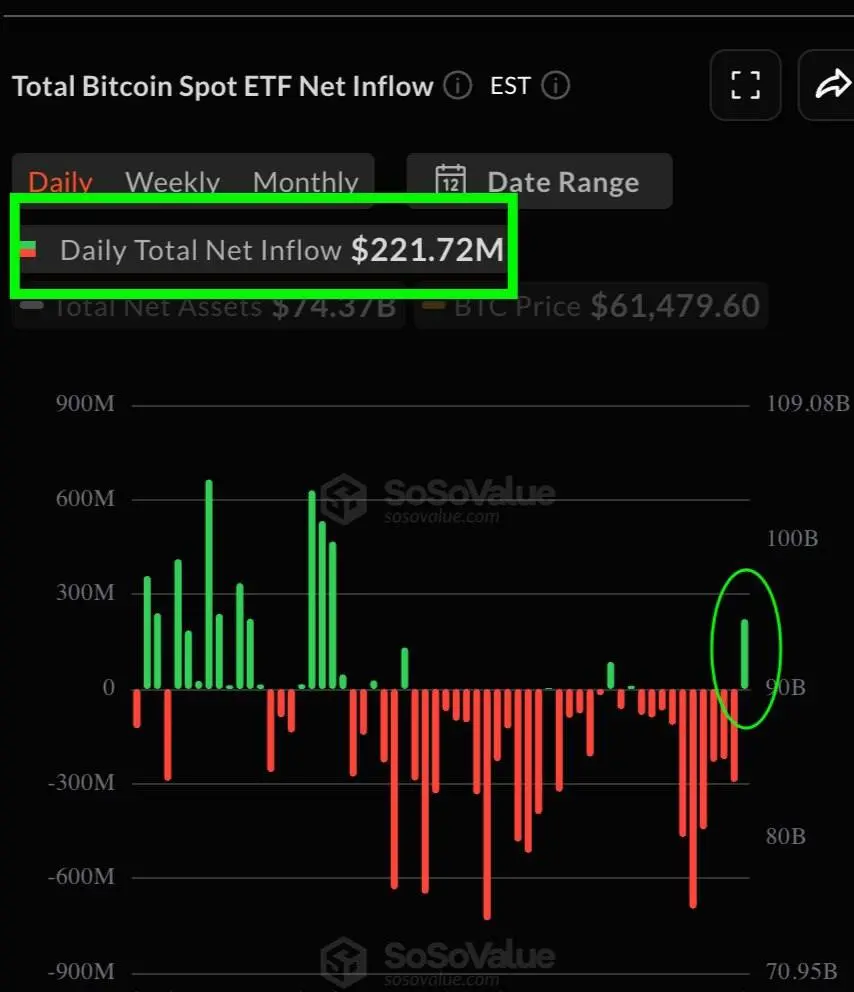
市场看起来平静……但数据却讲述了另一个故事。
今天,我使用了 CoinMarketCap Agent Hub 的 detect_market_regime 技能,来了解当前加密货币市场真正在告诉我们什么。
以下是我注意到的情况:
🔹 市场目前处于“过热多头”状态,且信心不足。这意味着许多交易者正在开设多头仓位,但总体信心并不很强。
🔹 未平仓合约上涨了 7.24%,表明更多杠杆仓位正在进入市场。
🔹 交易量下降了 12.45%,而市场在过去 30 天内仅上涨了 1.56%。买家似乎并不活跃。
🔹 恐惧与贪婪指数为 27(恐惧状态),因此许多投资者仍在保持谨慎。
🔹 $BTC 比特币主导率已达 57.87%,显示比特币依然强于大多数山寨币。
最大的教训是什么?
价格并不能反映全部情况。
当杠杆不断增加而交易活动却减弱时,市场会变得更加危险。这并不意味着下跌是必然的,但提醒我们要保持谨慎,而不是盲目跟风。
这就是我喜欢使用 Agent Hub 的原因。
它帮助我超越价格,了解幕后的动态,再做出决策。
使用的技能:detect_market_regime
技能市场:
@CoinMarketCap #CMCAgentHub
BTC-1.74%
- 赞赏
- 点赞
- 评论
- 转发
- 分享
The market looks calm... but the data tells a different story.
Today I used the detect_market_regime skill from CoinMarketCap Agent Hub to understand what the current crypto market is really telling us.
Here's what caught my attention:
🔹 The market is currently in "Overheated Longs" with low conviction. This means many traders are opening long positions, but the overall confidence isn't very strong.
🔹 Open Interest is up 7.24%, showing that more leveraged positions are entering the market.
🔹 Trading volume is down 12.45%, while the market has only gained 1.56% over the last 30 days. Buyers

- 赞赏
- 点赞
- 评论
- 转发
- 分享
- 赞赏
- 点赞
- 2
- 转发
- 分享
敢飞就有天空那样:
反弹差不多就流出了查看更多

- 赞赏
- 点赞
- 评论
- 转发
- 分享

- 赞赏
- 2
- 3
- 1
- 分享
GateUser-378c4af2:
感谢有用的信息 🤠查看更多
- 赞赏
- 1
- 1
- 转发
- 分享
BcryptexBTC:
宏观条件正在改善,但价格仍需确认趋势。耐心通常比预测更有回报。
- 赞赏
- 点赞
- 评论
- 转发
- 分享