BabaJi

vip
Age 1.1 Year
Peak Tier 5
No content yet
📢 Gate Square | 5/29 Hot Topics: #WTI原油失守90美元
As of late May 2026, WTI crude oil futures have experienced significant volatility, recently falling below the $90 per barrel mark to settle around $87.36, while Brent crude trades near $92.05. This represents a sharp monthly decline for both benchmarks. The current price action reflects a complex interplay between geopolitical developments, supply constraints, and demand concerns driven by macroeconomic headwinds.
The recent price weakness comes after a period of elevated levels where Brent had reached 14-month highs above $100 per barrel follow
HighAmbition
📢 Gate Square | 5/29 Hot Topics: #WTI原油失守90美元
As of late May 2026, WTI crude oil futures have experienced significant volatility, recently falling below the $90 per barrel mark to settle around $87.36, while Brent crude trades near $92.05. This represents a sharp monthly decline for both benchmarks. The current price action reflects a complex interplay between geopolitical developments, supply constraints, and demand concerns driven by macroeconomic headwinds.
The recent price weakness comes after a period of elevated levels where Brent had reached 14-month highs above $100 per barrel following the Iran conflict that began on February 28, 2026. The market has been in a state of price discovery as traders weigh the competing forces of supply disruptions against potential demand destruction from high interest rates.
Geopolitical Developments: US-Iran Negotiations
The Middle East situation remains the primary driver of oil market sentiment. Recent developments indicate that US and Iranian negotiators have reached a tentative agreement to extend the ceasefire by 60 days and initiate new talks regarding Iran's nuclear program. This framework would give negotiators time to work out a longer-term settlement. However, significant uncertainties persist as the proposed memorandum of understanding still awaits approval from US President Donald Trump.
The negotiations have addressed several critical issues including Iran's stockpile of highly enriched uranium, which Washington demands must be disposed of before meeting Tehran's financial demands. The framework also includes provisions for ending the war between Israel and Hezbollah and commitments regarding non-interference in regional affairs.
Vice President JD Vance has indicated that the conflict has substantially weakened Iran's nuclear capabilities, claiming Washington managed to set back Tehran's program for the long term. Secretary of State Marco Rubio has acknowledged some progress in talks while maintaining that Washington prefers a diplomatic route but has other options available if negotiations fail.
The Strait of Hormuz remains a critical focal point. This waterway handles approximately 20% of global oil shipments, and its closure has created the largest supply disruption in history according to IEA data. Global oil supply plummeted by 10.1 million barrels per day to 97 mb/d in March 2026 due to attacks on energy infrastructure and restrictions on tanker movements.
Supply and Demand Fundamentals
The supply side of the equation presents a tight market environment despite recent price declines. OPEC has cut its 2026 global oil demand growth forecast to 1.17 million barrels per day, down from 1.38 million barrels per day estimated a month earlier. The organization now expects non-OPEC supply growth of 600,000 barrels per day for 2026.
Global oil inventories have been drawn down significantly, approaching record low levels according to ExxonMobil senior vice president Neil Chapman. The IEA reports that while inventories appear to stand at around 8 billion barrels on paper, a substantial portion consists of pipeline fill and operational inventories required to keep systems running, meaning those barrels are not truly available to the market.
Industry experts warn that the buffers and shock absorbers are being steadily drawn down, with physical prices expected to tighten further as summer demand peaks. The industry reinvestment ratio stood at 61% in 2025, recovering from a trough of 36% in 2022 but remaining well below the historical 80% to 90% range, reflecting a more cautious outlook on long-term demand.
On the demand side, concerns about high interest rates suppressing economic activity have weighed on prices. However, UBS commodity analyst Giovanni Staunovo notes that demand has not come down enough to push oil prices lower significantly, suggesting the market may not be accurately pricing in the energy supply shortage.
Technical Analysis and Price Levels
From a technical perspective, WTI has found support following the stalled negotiations. Key support levels to watch include the $85 to $87 range, which has held during recent selling pressure. Resistance levels are established at $95, $100, and $105 per barrel. The equal target of the wave down from $107.46 at $100.8 and the 78% retracement of the rise from $99.11 have provided support during recent sessions.
Overcoming the 38% retracement at $103.5 would call for a test of the 62% retracement and smaller target of the wave up from $99.11 at $105.3. The technical outlook remains tight, with price action indicating indecision as markets await clearer direction from geopolitical developments.
Bullish Scenario Analysis
In a bullish scenario, several factors could drive prices higher. If US-Iran negotiations break down and military tensions escalate, the Strait of Hormuz could remain closed or face renewed restrictions, maintaining the severe supply shock. Under this scenario, WTI could retest $100 per barrel and potentially move toward $105 to $110 levels.
Analysts at Barclays maintain their 2026 Brent crude oil price target at $100 per barrel, noting upside risks to this forecast. The ongoing global supply tightening, sluggish growth in US shale oil production, and supply disruptions from Middle East conflicts provide long-term support for oil prices. Bernstein expects prices to climb to $77 per barrel in 2026 as higher spot prices and a tighter physical market push cost inflation through the supply chain.
If the ceasefire extension leads to a temporary stabilization but the Strait of Hormuz reopening faces delays beyond current expectations, prices could remain elevated in the $95 to $105 range through the third quarter of 2026.
Bearish Scenario Analysis
The bearish case centers on successful completion of the US-Iran deal and reopening of the Strait of Hormuz. Reports of a potential deal triggered a sell-off with WTI down around 6% at one point, demonstrating how sensitive prices are to diplomatic progress. Should negotiations succeed and the waterway reopen, prices could decline toward $75 to $80 per barrel as supply normalizes.
OPEC's reduced demand growth forecast reflects concerns about macroeconomic headwinds from elevated interest rates. If global economic growth slows more than expected, demand destruction could become a more significant factor. The Federal Reserve's stance on interest rates will be crucial, as higher rates for longer could further suppress oil demand.
Additionally, if US shale production responds to higher prices more quickly than anticipated, this could add supply to the market and cap price gains. However, current industry reinvestment ratios suggest this response may be limited in the near term.
Timeline and Key Events
The immediate timeline centers on the 60-day ceasefire extension period. During this window, negotiators will attempt to reach a comprehensive agreement. Key milestones include potential approval of the memorandum of understanding by President Trump and subsequent technical discussions on nuclear program details.
Looking ahead to the third quarter of 2026, the IEA presents a forecast assuming resumption of regular deliveries from the Middle East by mid-year, although not back to pre-conflict levels. This suggests a gradual normalization process rather than an immediate return to full supply.
Summer driving season in the Northern Hemisphere will provide a demand test, with inventory levels likely to draw down further. The market will also monitor OPEC+ production decisions and compliance with existing output cuts.
Market Outlook and Trading Considerations
The current market environment presents a challenging trading landscape characterized by high volatility and binary outcomes based on geopolitical developments. Traders should monitor diplomatic announcements closely, as sudden shifts in negotiation status have demonstrated immediate price impact.
Risk management remains essential given the wide range of potential outcomes. Position sizing should account for the possibility of sharp moves in either direction. The technical levels outlined provide reference points for entry and exit decisions, with particular attention to the $85 support and $105 resistance zones.
For longer-term positioning, the structural supply constraints suggest that even in a bearish scenario, prices may find support above pre-conflict levels. The combination of low inventories, limited spare production capacity, and geopolitical risk premiums creates a floor under prices that did not exist in previous years.
The crude oil market stands at a critical juncture as geopolitical negotiations and supply constraints compete for dominance in price determination. The tentative US-Iran ceasefire extension offers hope for reduced tensions, but significant uncertainties remain regarding implementation and long-term stability.
Current prices around $87 for WTI and $92 for Brent reflect a market caught between the fear of supply disruptions and hope for diplomatic resolution. The low inventory environment provides underlying support, while demand concerns from high interest rates cap upside potential.
Traders and investors should prepare for continued volatility as the 60-day negotiation period unfolds. The outcome of these talks will likely determine whether prices return to triple-digit territory or retreat to more moderate levels. Regardless of the near-term direction, the structural tightness in global oil markets suggests that prices will remain elevated by historical standards through the remainder of 2026.
The key levels to watch remain $85 and $80 on the downside as critical support zones, with $95, $100, and $105 serving as resistance targets on any move higher. The timeline through July will be decisive in establishing the medium-term trajectory for crude oil prices.
repost-content-media
  • Reward
  • Comment
  • Repost
  • Share
📢 Gate Plaza | 5/28 Hot Topics: #24h加密合约清算破4亿美元
The cryptocurrency market experienced one of its sharpest selloffs in recent months during the final hours of May 28, 2026, as geopolitical tensions between the United States and Iran escalated suddenly. The move triggered widespread volatility across digital assets, commodities, and global financial markets, while forcing thousands of leveraged traders out of positions. This analysis explores the key market developments, liquidation data, price action, and the two major discussion topics currently trending on Gate Plaza.
The Geopolitical Trigg
BTC-0.54%
ETH-1.26%
SOL-1.57%
XRP-1.88%
HighAmbition
📢 Gate Plaza | 5/28 Hot Topics: #24h加密合约清算破4亿美元
The cryptocurrency market experienced one of its sharpest selloffs in recent months during the final hours of May 28, 2026, as geopolitical tensions between the United States and Iran escalated suddenly. The move triggered widespread volatility across digital assets, commodities, and global financial markets, while forcing thousands of leveraged traders out of positions. This analysis explores the key market developments, liquidation data, price action, and the two major discussion topics currently trending on Gate Plaza.
The Geopolitical Trigger That Shook Markets
The market shock began after U.S. Central Command conducted airstrikes targeting an Iranian military site near the Strait of Hormuz, one of the world's most important energy transit routes handling roughly twenty percent of global oil and LNG flows. The White House also rejected reports suggesting that Washington and Tehran had reached a memorandum of understanding, damaging expectations for a near-term diplomatic resolution.
Market participants had increasingly priced in a potential easing of tensions after months of conflict. The renewed military escalation therefore produced a rapid shift from optimism to risk aversion, catching many traders positioned for recovery completely off guard.
Bitcoin Price Action and Technical Breakdown
Bitcoin recorded its steepest decline in months, breaking below the important seventy-three thousand dollar support level for the first time since April. During the Asian session on May 28, BTC fell to an intraday low of $72,609 before recovering toward $73,258. The asset later stabilized around $72,978, marking a 3.4% daily decline and a 6.3% loss over seven days.
The breakdown was technically significant because Bitcoin had maintained strength above $74,000 despite weeks of geopolitical uncertainty. Losing this support shifted market structure from consolidation toward renewed bearish pressure.
Analysts identified a major support zone between $73,000 and $71,300. A decisive break below $71,300 could trigger another wave of liquidations and potentially expose lower support zones near $60,000. Technical observers also highlighted a developing bear-flag pattern, suggesting that sellers remain in control unless Bitcoin reclaims key resistance levels.
Ethereum and Altcoin Performance
Ethereum underperformed Bitcoin during the selloff, falling below the psychological $2,000 level and reaching a session low of $1,964 before recovering toward $1,983. ETH declined 4.7% on the day and 7.7% over the week, while technical indicators suggested continued weakness if broader market conditions fail to improve.
Major altcoins also suffered losses. Solana fell 3.5% to $80.57, XRP dropped 3.6% to $1.28, and Dogecoin declined 3.2% to $0.0979. Hyperliquid showed relative resilience, remaining one of the few major assets still holding a positive weekly return despite daily weakness. Tron also maintained a modest weekly gain while the broader market moved lower.
The Liquidation Crisis: Scale and Impact
The decline triggered one of the largest liquidation events of the current cycle. CoinGlass data showed approximately $958.8 million in total liquidations across 167,706 traders within twenty-four hours.
Long positions accounted for roughly $897 million, representing 93% of all liquidations, while short positions contributed only $61 million. Bitcoin led the wipeout with $386 million in liquidated positions, followed by Ethereum with $246 million.
The largest single liquidation order was a $15.34 million Bitcoin position on Hyperliquid. The event demonstrated how quickly excessive leverage can become a liability when market sentiment shifts unexpectedly. Positions built during weeks of range-bound trading were erased in a matter of hours as forced selling accelerated downside momentum.
Broader Market Context and Risk-Off Dynamics
The crypto decline occurred alongside broader risk-off behavior across global markets. The MSCI All Country World Index slipped 0.4% from record levels, while major Asian equity benchmarks fell 1.7%.
Oil markets moved sharply higher following the escalation. Brent crude climbed 3.75% to $97.83 per barrel, while WTI crude advanced 4% to $92.22. Rising energy prices intensified inflation concerns and added pressure to risk assets.
Meanwhile, gold unexpectedly weakened to approximately $4,377 per ounce as dollar strength and inflation concerns outweighed traditional safe-haven demand. Silver declined 3% to $72.37, while platinum lost 1.4% to $1,890.81.
Additional uncertainty emerged after new U.S. sanctions targeting Iran-linked maritime entities and reports of missile and drone activity across the region.
Gate Plaza Discussion Question One: How Have Your Recent Trades Been?
Recent market conditions have been exceptionally challenging for leveraged traders. With ninety-three percent of liquidations coming from long positions, the data clearly shows that aggressive bullish positioning proved costly during the sudden reversal.
The event serves as a reminder that geopolitical developments can overwhelm technical setups and rapidly change market direction. Traders who maintained disciplined risk management, conservative leverage, and appropriate position sizing were significantly better positioned to navigate the volatility.
Gate Plaza Discussion Question Two: Should You Buy the Dip or Hold Your Position at This Stage?
This remains the most important question facing market participants today.
From a technical perspective, Bitcoin is trading within a critical support region between $73,000 and $71,300. Holding this zone could allow a relief rally toward the $74,000–$75,000 region. However, a confirmed breakdown below support could increase the probability of a deeper correction.
At the same time, several indicators suggest short-term oversold conditions. Such readings often create temporary rebounds, although they do not necessarily signal the start of a sustainable uptrend.
The geopolitical backdrop remains the dominant variable. Any progress toward diplomacy or reduced military tensions could quickly improve market sentiment. Conversely, further escalation could extend risk-off flows across crypto and traditional markets.
For dip buyers, gradual accumulation and strict risk management remain essential. Deploying capital in stages rather than entering aggressively can reduce exposure to continued downside volatility.
Strategic Considerations for Various Market Scenarios
If Bitcoin successfully defends the $71,300 support region, traders may see a recovery attempt toward $74,000–$75,000 resistance. Momentum confirmation would be more important than attempting to predict an exact bottom.
If support fails, downside pressure could intensify and shift focus toward significantly lower price zones. In that environment, patience, cash preservation, and disciplined entries become increasingly important.
Ethereum and many altcoins remain more vulnerable than Bitcoin, meaning traders should exercise additional caution when managing high-beta crypto positions.
The recent selloff highlights how quickly geopolitical developments can reshape financial markets. Bitcoin's fall below $73,000 triggered nearly $1 billion in liquidations, while Ethereum and major altcoins experienced broad weakness across the board.
Although oversold conditions may support short-term rebounds, technical damage remains significant and uncertainty surrounding the Iran-US conflict continues to influence sentiment. Traders should prioritize disciplined risk management, avoid excessive leverage, and remain focused on key support levels until clearer signs of market stabilization emerge.
The discussions taking place on Gate Plaza provide valuable insight into how traders are adapting to rapidly changing conditions, offering important lessons in risk control, position management, and market psychology during periods of extreme volatility.
repost-content-media
  • Reward
  • Comment
  • Repost
  • Share
#TradeCFDWinGold
#SOL
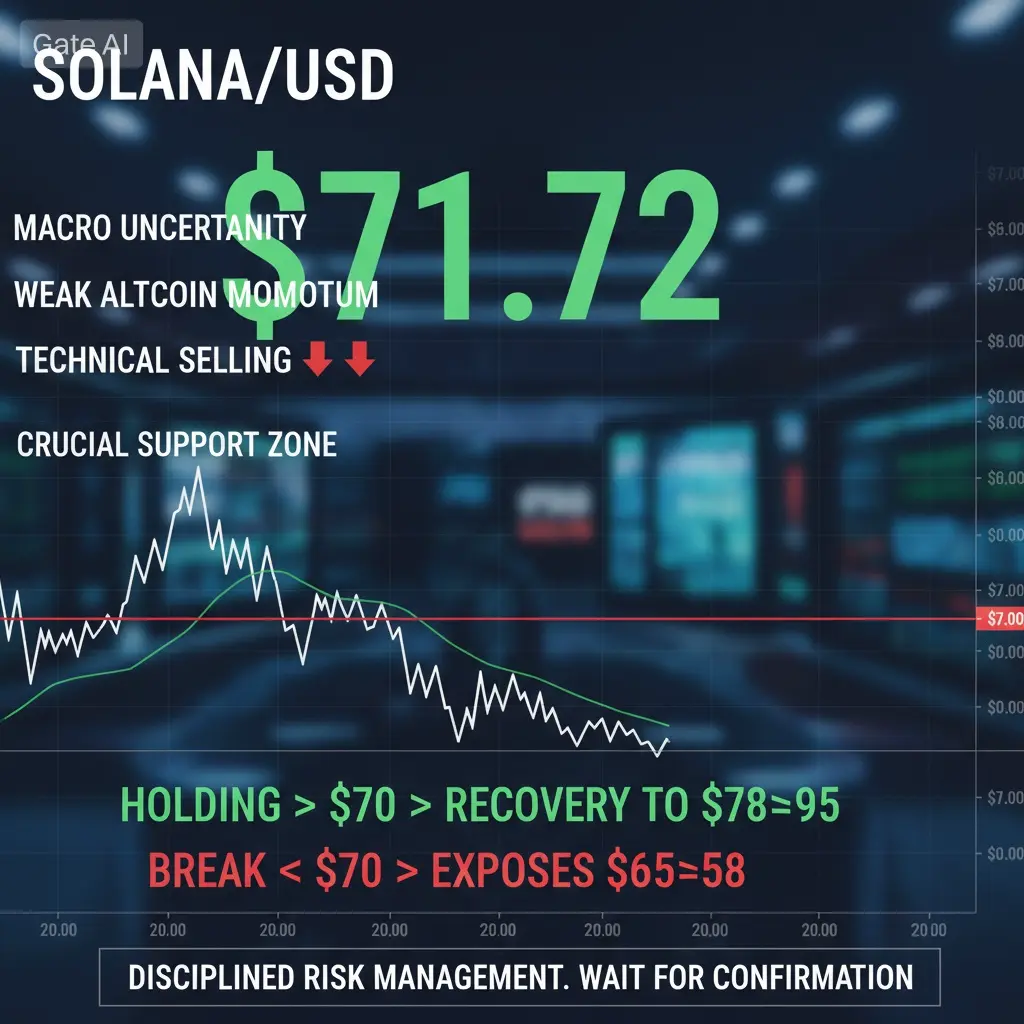
Solana is currently trading around $82.37–$82.71, struggling to regain momentum after collapsing from its all-time high of $294.27 in June 2025. The token remains roughly 72% below its peak, keeping SOL firmly inside a long-term bear market despite recent stabilization. Throughout May 2026, price action has remained trapped between $77 and $90, showing neither a decisive breakdown nor a convincing recovery. The broader crypto Fear & Greed Index remains near 23, reflecting extreme fear across digital asset markets.
Key support sits around $83, followed by the psychologic
HighAmbition
#TradeCFDWinGold
#SOL
Solana is currently trading around $82.37–$82.71, struggling to regain momentum after collapsing from its all-time high of $294.27 in June 2025. The token remains roughly 72% below its peak, keeping SOL firmly inside a long-term bear market despite recent stabilization. Throughout May 2026, price action has remained trapped between $77 and $90, showing neither a decisive breakdown nor a convincing recovery. The broader crypto Fear & Greed Index remains near 23, reflecting extreme fear across digital asset markets.
Key support sits around $83, followed by the psychological $80 zone and major structural support near $77. A breakdown below $77 could expose the year-to-date low of $68.54 and potentially open the path toward $50. On the upside, immediate resistance stands at $85.13, followed by $87.90 and the critical $90 barrier. Beyond that, the $97–$100 area becomes the next major target zone where bullish momentum could accelerate.
TECHNICAL INDICATORS DEEP DIVE
RSI currently fluctuates between 46 and 49, placing SOL in neutral territory. This indicates that the market is waiting for a catalyst rather than showing extreme bullish or bearish conditions. The 7-day and 20-day moving averages both sit near $83.40 and continue acting as immediate resistance levels.
The 50-day moving average remains near $85.44, while the 200-day moving average sits far above current prices, confirming that the broader trend remains bearish despite short-term stabilization. The bearish alignment between major moving averages continues to create overhead selling pressure.
MACD remains weak with little directional conviction, while the Stochastic oscillator shows a mild bullish crossover. Bollinger Bands place SOL near the middle band around $83.41, with an upper boundary near $89.81 and lower support near $77.01. The daily ATR of approximately $4 highlights moderate volatility, creating opportunities for active traders while still reflecting uncertainty.
Lower timeframe charts continue to show a modest bullish bias as long as support between $80 and $82 remains intact. Short-term targets include $83.85, $84.84, and eventually $86–$87 if momentum improves.
WHY IS SOL'S PRICE STUCK BELOW?
Several factors continue weighing on Solana's recovery.
First, the broader cryptocurrency market remains under pressure as investors reduce risk exposure. Bitcoin dominance remains elevated while altcoins continue struggling to attract fresh capital.
Second, institutional demand has not fully recovered despite recent improvements. Open interest remains stable rather than expanding aggressively, suggesting that speculative money has not returned at the scale seen during previous bull cycles.
Third, stablecoin liquidity has declined compared to late 2025 levels, reducing overall trading activity across crypto markets. Solana's memecoin and DEX sectors have also cooled significantly from their 2025 highs, reducing transaction fees and ecosystem-driven demand.
Finally, SOL remains below major long-term moving averages, meaning every rally encounters technical resistance from traders looking to exit positions at higher prices.
IS ANY STRATEGY BEING APPLIED TO PUSH SOL UP?
Yes. Several major initiatives are actively supporting Solana's long-term recovery narrative.
The most important catalyst is the Alpenglow consensus upgrade scheduled for Q3 2026. This upgrade replaces portions of Solana's existing architecture and is expected to reduce transaction finality from roughly 12.8 seconds to around 150 milliseconds. Community support has been overwhelming, with over 98% of staked SOL voting in favor.
Institutional interest has also begun improving. Spot Solana ETF flows have turned positive after months of weakness, while several large investors have resumed accumulation. A dormant whale recently acquired more than 67,000 SOL, signaling renewed confidence among larger market participants.
Goldman Sachs reportedly maintains exposure to Solana-linked products, while Firedancer continues progressing toward deployment, strengthening Solana's decentralization and network resilience.
Additionally, Solana surpassed Ethereum in new developer signups during 2026 and continues maintaining nearly $10 billion in DeFi TVL. The ecosystem generated billions in application revenue during 2025, demonstrating that underlying network activity remains substantial despite weak token performance.
BULLISH SCENARIO — HOW HIGH CAN SOL GO?
In the bullish case, SOL must first reclaim $85.13. A confirmed breakout above that level could target $87.90 and then the upper Bollinger Band near $89.81.
A sustained move above $90 would represent a major technical victory and could trigger momentum buying toward $97 and eventually the psychological $100 mark. If broader crypto sentiment improves and institutional inflows continue accelerating, stronger upside targets become achievable.
Several analysts maintain highly optimistic long-term projections. Standard Chartered forecasts approximately $250 by the end of 2026 and potentially $2,000 by 2030. VanEck's most aggressive outlook projects values above $3,000 by the end of the decade, while other firms estimate $140–$240 as realistic 2026 targets depending on ETF adoption and ecosystem growth.
For bulls, the roadmap remains straightforward: hold $83, reclaim $85, break $90, challenge $100, and then target higher expansion zones.
The Alpenglow launch, continued ETF inflows, whale accumulation, and improving crypto sentiment would all act as major fuel for this scenario.
BEARISH SCENARIO — HOW LOW CAN SOL FALL?
The bearish case remains equally important.
If SOL loses support near $80.71, downside pressure could accelerate toward $79.06 and eventually the lower Bollinger Band near $77.01. A decisive break below $77 would significantly weaken market structure and expose the year-to-date low at $68.54.
Should broader crypto markets experience another capitulation event, SOL could potentially revisit the psychological $50 area. Several analysts continue describing the longer-term technical structure as bearish due to weak momentum, declining altcoin dominance, and insufficient institutional demand.
The current Fear & Greed Index near extreme fear also suggests investor confidence remains fragile. Without a major catalyst, sideways-to-lower price action could continue for months.
TRADING STRATEGY AND PLAN FOR TRADERS
For traders considering new positions, the current $82–$83 zone offers an interesting risk-reward profile but requires disciplined execution.
Conservative traders may prefer waiting for pullbacks toward $80 support before entering. Stop-loss placement below $79 helps limit downside risk if support fails.
More aggressive traders can watch for a breakout above $85.13 accompanied by increasing volume. Initial targets would be $87.90 and $90, with higher targets activated if momentum remains strong.
Swing traders can continue exploiting the current $77–$90 range. Buying near support and reducing exposure near resistance remains the most practical strategy until a decisive trend emerges.
Long-term investors may prefer gradual accumulation rather than attempting to time the exact bottom. Staggered purchases around $83, $77, and potentially lower support levels help balance opportunity with risk management.
Regardless of strategy, position sizing remains critical. Given Solana's volatility, no single position should risk a significant percentage of total portfolio capital.
WHAT TO WATCH NEXT — CATALYSTS AND TRIGGERS
The most important catalyst remains the Alpenglow mainnet activation expected during Q3 2026. Successful deployment could dramatically strengthen investor confidence and improve Solana's competitive position among Layer-1 blockchains.
Additional catalysts include:
Weekly spot ETF net inflows
Bitcoin's overall market direction
Recovery in Solana DEX and memecoin activity
Firedancer rollout progress
Regulatory developments in the United States
Institutional adoption trends
Developer ecosystem growth
From a technical perspective, losing $83 support would increase downside risk significantly. Conversely, reclaiming $85 and breaking above $90 with strong volume would activate the bullish scenario and potentially mark the beginning of a larger recovery phase.
FINAL ASSESSMENT
Solana remains one of the strongest blockchain ecosystems fundamentally, yet its token price continues reflecting broader market weakness rather than network progress. The combination of Alpenglow, ETF inflows, whale accumulation, Firedancer development, and ecosystem growth creates a compelling long-term narrative.
However, the technical structure remains fragile. Bulls need a decisive move above $90 to confirm a meaningful trend reversal, while bears remain in control as long as SOL trades below major long-term moving averages.
For now, SOL sits at a critical crossroads where the next few months may determine whether it begins a sustainable recovery toward $140–$250 or experiences another leg lower toward $68 and beyond.@Gate_Square @Gate广场_Official
repost-content-media
  • Reward
  • Comment
  • Repost
  • Share
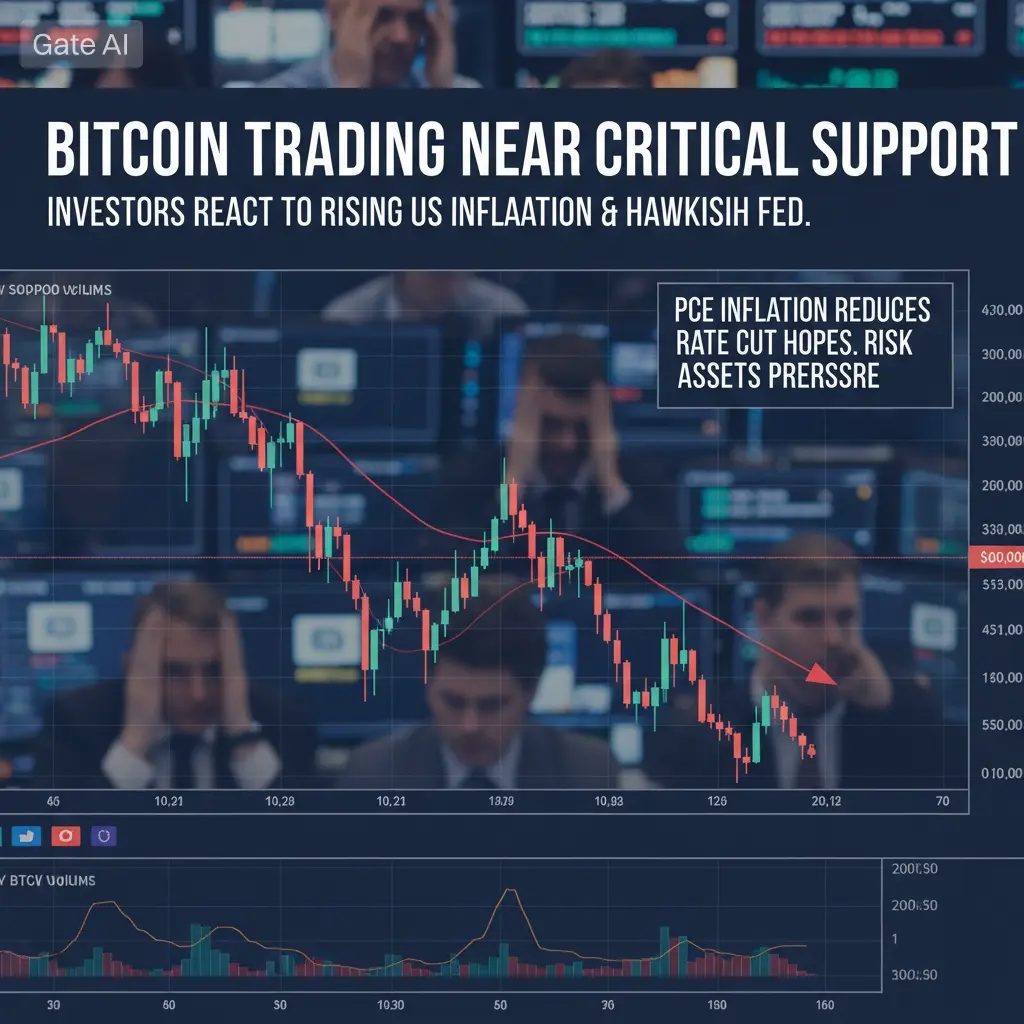
#BTCMarketAnalysis
Bitcoin is currently trading in a challenging environment with significant volatility driven by multiple macroeconomic factors. Recent data indicates BTC has been fluctuating between approximately $72,895 and $75,064, with the price experiencing downward pressure amid geopolitical tensions and macroeconomic uncertainty. The cryptocurrency has broken below critical support levels, with the $96,000 mark now acting as a distant resistance zone that was breached earlier, wiping out gains accumulated throughout 2025.
Support and Resistance Levels
Support Levels Analysis
Immediat
HighAmbition
#BTCMarketAnalysis
Bitcoin is currently trading in a challenging environment with significant volatility driven by multiple macroeconomic factors. Recent data indicates BTC has been fluctuating between approximately $72,895 and $75,064, with the price experiencing downward pressure amid geopolitical tensions and macroeconomic uncertainty. The cryptocurrency has broken below critical support levels, with the $96,000 mark now acting as a distant resistance zone that was breached earlier, wiping out gains accumulated throughout 2025.
Support and Resistance Levels
Support Levels Analysis
Immediate support for Bitcoin is established around the $71,000 to $72,000 range, which has historically provided a floor during previous corrections. A more substantial support zone exists at approximately $68,000 to $70,000, representing a critical accumulation area where institutional buyers have previously entered the market. The psychological support at $70,000 remains crucial, as a sustained break below this level could trigger accelerated selling pressure toward the $65,000 to $68,000 range. The $60,000 level represents the final major support, which was tested in February 2025 when Bitcoin bottomed near this price point.
Resistance Levels Analysis
Immediate resistance is positioned around $80,000, which analysts maintain as a key threshold for Bitcoin to reclaim bullish momentum. The next significant resistance zone lies between $85,000 and $95,000, with $95,000 to $96,000 representing a major supply wall where over 1.66 million addresses purchased Bitcoin at approximately $95,620. This concentration of underwater positions creates substantial selling pressure when price approaches this zone. The $100,000 psychological barrier remains the ultimate resistance target, with a decisive break above $95,000 to $96,000 potentially triggering a surge toward this milestone.
Iran Conflict Impact on Bitcoin
Geopolitical Risk Assessment
The ongoing conflict involving Iran has created significant headwinds for Bitcoin and the broader cryptocurrency market. The closure of the Strait of Hormuz by Iran has sparked risk-off sentiment across financial markets, with investors pulling capital from speculative assets including cryptocurrencies. Energy inflation tied to the Middle East conflict has proven more persistent than initially anticipated, creating what Federal Reserve officials describe as a stagflationary shock for energy-importing economies.
Market Reaction Dynamics
Bitcoin has notably failed to maintain its safe-haven appeal during this period of uncertainty, contrary to its digital gold narrative. The cryptocurrency declined sharply following military operations in the region, demonstrating its correlation with risk assets rather than traditional safe havens like physical gold. Analysts from CryptoQuant and Amberdata indicate that geopolitical headwinds exacerbate selling pressure on digital assets, with experts suggesting the market bottom may not yet be established. The conflict has contributed to Bitcoin trading below $75,000, with the potential for further declines if military tensions escalate.
Federal Reserve Policy and CPI Data Impact
Current Inflation Environment
The Federal Reserve faces challenging inflation dynamics, with the Personal Consumption Expenditures price index showing April inflation at an annual rate of approximately 3.9%, marking the highest level since May 2023. Consumer Price Index data indicates inflation running at 2.7% to 2.9% annually, above the Fed's 2% target. Energy prices have reversed previous losses, rising 0.9% in recent months due to Middle East supply concerns, while core inflation remains elevated at 2.9% annually.
Interest Rate Policy Outlook
Federal Reserve officials have signaled a shift in policy outlook, with several voting members indicating that persistent inflation may require tighter monetary policy. The probability of rate hikes has increased significantly, with markets pricing in a 40% chance of rate increases by December 2026, compared to just 3% at the June meeting. Chicago Fed President Austan Goolsbee has warned that the energy shock could drive policy shifts, while Fed Vice Chair Michelle Bowman noted that extended energy disruptions might necessitate tighter monetary conditions.
Cryptocurrency Market Impact
Rate cut expectations have been pushed back as inflation proves more persistent than anticipated. This environment typically creates headwinds for Bitcoin, as higher interest rates reduce the attractiveness of non-yielding assets and strengthen the dollar, putting downward pressure on cryptocurrency prices. However, if the Fed eventually pivots to rate cuts due to economic weakness, Bitcoin could benefit from improved liquidity conditions and renewed risk appetite.
Price Forecast and Trading Strategy
Bullish Scenario
In a bullish scenario, Bitcoin would need to reclaim the $80,000 resistance level and establish support above this threshold. A successful breakout above $85,000 could trigger momentum toward the $95,000 to $100,000 range by the end of the current quarter. This scenario would require several catalysts including de-escalation of the Iran conflict, dovish Federal Reserve rhetoric, and renewed institutional inflows into Bitcoin ETFs. Target prices in this scenario range from $95,000 to $100,000, with some analysts projecting potential moves toward $113,000 to $119,000 by year-end if macro conditions improve significantly.
Bearish Scenario
The bearish scenario remains more probable in the near term, with Bitcoin at risk of testing lower support levels. A sustained break below $71,000 could open the path toward $68,000 and potentially $65,000. Technical indicators including RSI show deeply oversold conditions, suggesting potential for relief rallies, but the overall trend remains bearish. If geopolitical tensions escalate further and the Fed adopts a hawkish stance, Bitcoin could retest the $60,000 level seen in February 2025.
Trading Recommendations for Active Traders
Risk Management Framework
Traders should implement strict risk management protocols given current volatility. Position sizing should be limited to 2% to 5% of portfolio value per trade, with stop-loss orders placed below key support levels. For long positions, stops should be set below $70,000, while short positions should use stops above $80,000 to $85,000 depending on entry points.
Entry and Exit Strategies
For bullish entries, wait for confirmation of support at $71,000 to $72,000 with volume confirmation before establishing long positions. Scale into positions gradually rather than deploying full capital at once. For bearish entries, consider short positions on rallies toward $78,000 to $80,000 resistance with tight risk management. Take profit targets should be set at key support and resistance levels, with partial profit-taking recommended at $75,000, $72,000, and $68,000 for short positions.
Market Sentiment Considerations
Current market sentiment remains fearful, with the Crypto Fear and Greed Index indicating extreme fear conditions. This contrarian indicator suggests potential for short-term bounces, but the broader trend requires caution. Institutional flows have been negative, with spot Bitcoin ETFs recording seven consecutive days of outflows and reports of large block sales totaling $1.29 billion in dark pool transactions.
Conclusion and Strategic Outlook
Bitcoin faces a challenging environment with multiple headwinds including geopolitical tensions, persistent inflation, and uncertain Federal Reserve policy. The immediate outlook favors caution, with support at $71,000 and resistance at $80,000 defining the current trading range. Traders should remain nimble, employing tight risk management and waiting for clearer directional signals before committing significant capital. The Iran situation remains the primary near-term catalyst, with any escalation likely to pressure prices lower while de-escalation could spark relief rallies. Federal Reserve communications in June will be critical for determining the medium-term trajectory, with rate hike expectations currently weighing on cryptocurrency markets.@Gate_Square @Gate Live 华语
repost-content-media
  • Reward
  • Comment
  • Repost
  • Share
#WTICrudeFallsBelow90Dollars
WTI crude oil is currently trading around $87.36 per barrel, while Brent crude remains near $91.12, marking a significant retreat from the extreme highs seen earlier in 2026. During the peak of Middle East tensions, Brent briefly surged toward $138, while WTI traded above $119, driven by fears of supply disruptions and risks surrounding the Strait of Hormuz.
The recent decline has erased a large portion of the geopolitical premium that was built into crude prices. WTI has now fallen more than 27% from its 2026 highs, bringing prices back toward levels last seen be
HighAmbition
#WTICrudeFallsBelow90Dollars
WTI crude oil is currently trading around $87.36 per barrel, while Brent crude remains near $91.12, marking a significant retreat from the extreme highs seen earlier in 2026. During the peak of Middle East tensions, Brent briefly surged toward $138, while WTI traded above $119, driven by fears of supply disruptions and risks surrounding the Strait of Hormuz.
The recent decline has erased a large portion of the geopolitical premium that was built into crude prices. WTI has now fallen more than 27% from its 2026 highs, bringing prices back toward levels last seen before the regional conflict intensified. Markets are gradually shifting their focus away from war-related risks and back toward supply, demand, and economic fundamentals.
Despite the sharp correction, crude remains elevated compared with historical averages, indicating that traders are still assigning some value to ongoing geopolitical uncertainty.
Why WTI Fell Below $90: The Three Driving Forces
Three major factors are driving the current decline.
The first is slowing demand growth from China. As the world's largest crude importer, China's industrial activity and manufacturing output play a major role in global energy consumption. Recent economic data has pointed to weaker-than-expected growth, reducing demand expectations for oil.
The second factor is the strong U.S. dollar. Since crude oil is priced globally in dollars, a stronger dollar increases costs for international buyers, reducing purchasing power and limiting demand.
The third and most influential factor is growing expectations that global oil supply will increase during the second half of 2026. OPEC+ producers are expected to gradually restore output, while concerns about major supply disruptions have eased following progress toward a temporary U.S.-Iran ceasefire.
The market is effectively transitioning from a fear-driven environment to a fundamentals-driven environment. As geopolitical risks cool, traders are reassessing whether current supply conditions justify prices above $100.
The Impact on Crypto Markets: Inflation, the Fed, and Bitcoin
Lower oil prices can have important consequences for cryptocurrencies.
Energy costs influence transportation, manufacturing, and consumer prices throughout the economy. When crude declines, inflation pressures often ease over time. Lower inflation can increase expectations that the Federal Reserve will adopt a more accommodative policy stance
For crypto investors, this relationship is important because easier monetary policy generally improves liquidity conditions. Historically, periods of expanding liquidity have supported risk assets such as Bitcoin, Ethereum, and major altcoins.
Bitcoin is currently trading near the psychological $100,000 region, and traders are closely watching macroeconomic developments. If declining oil prices help reduce inflation concerns, capital could continue flowing into digital assets.
At the same time, investors should remain cautious. Falling oil prices can sometimes signal weakening economic growth rather than improving conditions. If global demand deteriorates sharply, risk assets could face pressure despite lower energy costs.
The key question is whether oil is falling because supply is improving or because economic activity is slowing. The answer will heavily influence crypto performance during the coming months.
The Impact on Stock Markets: Airlines, Energy, and the S&P 500
The impact on equities is mixed.
Industries that consume large amounts of fuel generally benefit from lower crude prices. Airlines, logistics companies, transportation firms, shipping operators, and manufacturers often experience improved profit margins when energy costs decline.
Consumer-focused businesses may also benefit because lower fuel expenses can increase household spending power.
Meanwhile, energy producers face a different reality. Oil exploration and production companies generate less revenue when crude prices fall. Many upstream firms become less profitable as margins shrink, especially those with higher production costs.
The broader stock market has remained resilient. Investors continue to focus on corporate earnings, artificial intelligence investment, and expectations for future monetary easing. Lower oil prices may further support sectors such as technology, retail, industrials, and transportation.
If crude remains below $90 for an extended period, the balance of benefits may favor the wider economy more than the energy sector.
Geopolitical Context: Iran, the Middle East, and the Strait of Hormuz
The geopolitical story remains central to oil's outlook.
The Strait of Hormuz handles roughly 20% of global oil trade, making it one of the most important energy chokepoints in the world. Earlier fears that shipping routes could face major disruption caused traders to aggressively price in supply risks.
Those fears pushed oil sharply higher during the first half of 2026.
Now, improving diplomatic conditions and a temporary ceasefire have reduced immediate concerns. Tanker traffic expectations have improved, and traders believe the probability of a severe supply shock has declined.
However, risks remain elevated. Any renewed military escalation involving Iran, Israel, or U.S. forces could quickly reverse current sentiment and trigger another surge in prices.
This is why many institutional traders continue to maintain geopolitical hedges despite the recent correction.
WTI Price Forecast: Where Can Oil Go From Here?
Forecasts remain highly divided.
The bearish case suggests that increasing production, weaker Chinese demand, and improving supply conditions could push WTI toward the $80-$82 range, with a deeper correction potentially targeting $75.
A more moderate scenario sees WTI trading between $82 and $92 through much of the summer as traders wait for clearer economic and geopolitical signals.
The bullish case assumes renewed Middle East tensions or unexpected supply disruptions. Under that scenario, WTI could quickly recover toward $100-$105, while a major escalation could potentially send prices back above $115.
Technical traders are closely monitoring support around $85, while resistance remains concentrated near $95 and $100.
Current market positioning suggests that traders expect volatility to remain elevated throughout the remainder of 2026.
What Traders Are Thinking: Sentiment and Market Psychology
Market sentiment has shifted dramatically over the past several weeks.
During the conflict-driven rally, traders feared a prolonged supply crisis. Today, many are focused on the possibility that crude was overvalued due to excessive geopolitical risk premiums.
Bearish traders argue that slowing demand and rising production will continue pressuring prices. They expect rallies to be sold and view the recent decline as the beginning of a larger correction.
Bullish traders remain cautious but believe the market may be underestimating geopolitical risks. They point out that a single major headline from the Middle East could erase weeks of losses within days.
This division has created a highly volatile environment where sentiment can change rapidly.
Trading Strategy: Plans and Approaches for the Current Environment
For bearish traders, selling rallies toward $92-$95 while targeting $82-$85 remains a popular strategy. Risk management is essential because geopolitical headlines can trigger sudden reversals.
Bullish traders may prefer accumulating positions near major support zones while maintaining tight stop losses. A recovery above $95 would strengthen the bullish technical outlook.
Range traders can focus on the current $82-$92 trading corridor, buying near support and taking profits near resistance until a decisive breakout occurs.
Cross-market traders should also monitor Bitcoin, gold, and equity indices. Lower oil prices often influence inflation expectations, creating opportunities across multiple asset classes.
Position sizing should remain conservative because oil has demonstrated its ability to move $10-$20 per barrel within short periods when geopolitical conditions change.
Brief Summary: The Big Picture
WTI's drop below $90 per barrel represents one of the most important market developments of 2026. The decline reflects easing geopolitical fears, expectations of stronger supply growth, and concerns about global demand.
For crypto markets, lower oil could support risk assets if inflation continues cooling and central banks move toward easier policy. For stock markets, lower energy costs generally benefit transportation, manufacturing, technology, and consumer-focused sectors while creating challenges for oil producers.
Looking ahead, the most likely near-term range appears to be $82-$92, but volatility remains extremely high. Traders must closely monitor developments in the Middle East, Chinese economic data, OPEC+ production decisions, inflation trends, and Federal Reserve policy.
The next major move in crude oil will likely shape sentiment across global financial markets, making WTI one of the most important assets to watch throughout the remainder of 2026.@Gate_Square @Gate广场_Official
repost-content-media
  • Reward
  • Comment
  • Repost
  • Share
#USIranNegotiationGame
The ongoing geopolitical confrontation between the United States and Iran remains one of the most powerful macro forces shaping global financial markets in 2026. What appears externally as diplomatic engagement is in reality a strategic leverage game where both nations continuously adjust pressure through sanctions, nuclear negotiations, military signaling, and regional influence.
The United States applies economic pressure through sanctions targeting Iran’s oil exports, shipping networks, banking infrastructure, and international financial access. Iran responds through
BTC-0.56%
ETH-1.29%
SOL-1.57%
XRP-1.88%
HighAmbition
#USIranNegotiationGame
The ongoing geopolitical confrontation between the United States and Iran remains one of the most powerful macro forces shaping global financial markets in 2026. What appears externally as diplomatic engagement is in reality a strategic leverage game where both nations continuously adjust pressure through sanctions, nuclear negotiations, military signaling, and regional influence.
The United States applies economic pressure through sanctions targeting Iran’s oil exports, shipping networks, banking infrastructure, and international financial access. Iran responds through nuclear enrichment expansion, proxy networks across the Middle East, and strategic leverage over global energy routes, particularly the Strait of Hormuz, through which nearly one-fifth of global oil supply flows.
This ongoing tension creates a constant cycle of fear, relief, and repricing across global markets. Every diplomatic statement, military escalation, or negotiation breakdown immediately impacts crypto, oil, gold, equities, and currency markets in real time.
Crypto Market Trend Under US-Iran Negotiation Pressure
The cryptocurrency market has evolved into a real-time geopolitical risk indicator. Digital assets now behave as macro-sensitive instruments reacting to liquidity shifts, inflation expectations, and geopolitical uncertainty.
When US-Iran tensions escalate, investors rotate capital into Bitcoin, Ethereum, and major altcoins as alternative stores of value outside traditional financial systems. When diplomatic progress emerges, liquidity flows back into equities and the U.S. dollar strengthens, temporarily pressuring crypto valuations.
Ethereum, Solana, and XRP generally follow Bitcoin’s macro direction but with amplified volatility due to lower liquidity depth and higher speculative exposure. Stablecoins also see increased demand during escalation cycles, as traders seek dollar-pegged assets outside sanctioned or stressed banking systems.
Ethereum, Bitcoin, XRP, and Solana Current Market Prices
As of 2026 market conditions:
Bitcoin (BTC): 74,030 USD
Ethereum (ETH): 2,080 USD
XRP: 1.34 USD
Solana (SOL): 82.5 USD
Bitcoin remains the dominant geopolitical hedge asset in crypto markets, while Ethereum reflects liquidity cycles and ecosystem activity. Solana and XRP act as higher-beta instruments tied to broader risk sentiment.
Ethereum (ETH) 2026 Market Analysis and Forecast
Ethereum is currently trading near 2,080 USD, reflecting a cautious macro environment shaped by geopolitical instability and uneven global liquidity conditions.
ETH has been moving in a broad 2,000–2,200 USD range, with price action heavily influenced by US-Iran negotiation headlines and global risk sentiment.
Ethereum Scenarios:
Bullish escalation: 2,300–2,450 USD
Neutral stalemate: 2,000–2,200 USD
Diplomatic improvement: 1,900–2,000 USD
Ethereum’s long-term structure remains neutral-to-volatile, with macro liquidity and geopolitical sentiment overriding technical patterns.
Bitcoin Market Outlook Under Geopolitical Pressure
Bitcoin at 74,030 USD continues to act as the primary digital hedge against geopolitical instability.
Its price movements are strongly linked to escalation phases in the US-Iran conflict, especially developments involving nuclear enrichment, sanctions tightening, or Strait of Hormuz risk.
Key BTC Levels:
Support: 72,000 USD
Resistance: 78,500–82,000 USD
Scenario Outlook:
Escalation shock → 85,000+ USD
Diplomatic easing → ~70,000 USD
Continued stalemate → range-bound volatility
Bitcoin remains structurally supported by institutional inflows, ETF demand, and macro hedging narratives, even during corrections.
Oil Market Situation and Geopolitical Role
Oil is the central strategic weapon in the US-Iran negotiation framework. It represents both economic pressure on Iran and a global inflation trigger.
Iran’s oil exports remain constrained due to sanctions, while its geopolitical leverage is concentrated around the Strait of Hormuz, a critical global supply chokepoint.
Current Price:
WTI (XTI): 90.3 USD per barrel
Oil markets remain highly reactive to geopolitical headlines, including sanctions updates, military tension, and diplomatic signals.
Oil Forecast Scenarios:
Upside breakout: 95–100 USD
Base range: 86–94 USD
Downside relief: 84–86 USD
Oil continues to influence inflation expectations globally, directly affecting crypto and gold valuations.
Gold Market Behavior Under Geopolitical Stress
Gold remains the strongest traditional safe-haven asset during geopolitical uncertainty.
Current Price:
Gold (XAUT): 4,530 USD
Gold reacts directly to inflation expectations, currency instability, and geopolitical escalation.
Forecast Range:
Base case: 4,450–4,650 USD
Bullish escalation: 4,750–4,900 USD
Extreme risk scenario: 4,900–5,050 USD
Diplomatic easing: 4,300–4,400 USD
Central bank accumulation continues to provide strong structural support, especially from emerging economies diversifying away from USD dependency.
Interconnected Market Dynamics
All major asset classes are tightly interconnected under the US-Iran negotiation framework.
Rising oil → inflation expectations → bullish for gold & Bitcoin
Falling oil → risk-on sentiment → supports equities & USD
Escalation → safe-haven flows into crypto & metals
Diplomacy → short-term correction in hedging assets
This creates a synchronized macro environment where no asset moves independently.
Macro Trading Impact and Strategy Framework
The US-Iran negotiation cycle has created a high-volatility trading regime where macro headlines dominate technical analysis.
Bitcoin Strategy:
Buy zone: 72K–74K dips
Sell zone: 78K–82K rallies
Breakout hedge: 85K+ targets during escalation
Ethereum Strategy:
Accumulate near 2,000 USD support
Take profit near 2,300–2,400 USD
Avoid over-leverage due to macro volatility
Oil Strategy:
Sell above 92–95 USD
Buy dips near 84–86 USD
Trade news-driven swings only
Gold Strategy:
Accumulate dips 4,350–4,450 USD
Profit zone 4,700+ USD
Hedge geopolitical spikes aggressively
Risk management remains critical because geopolitical headlines can trigger 5–10% moves in crypto and commodities within hours.
Structural Outlook (Q3 2026)
The structural outlook remains dominated by uncertainty. Neither the US nor Iran has incentives for rapid resolution, which sustains a prolonged negotiation cycle.
This creates a macro environment where:
Bitcoin remains above 70K–100K structural range
Ethereum stays within 2,000–2,400 volatility band
Oil holds 80–100 USD geopolitical range
Gold remains elevated above 4,300 USD baseline
Markets are not trending — they are oscillating between fear and relief cycles driven entirely by geopolitical headlines.
Global financial markets remain in a high-volatility macro regime where geopolitical risk dominates traditional fundamentals.
Bitcoin at 74,030 USD, Ethereum near 2,080 USD, oil at 90.3 USD, and gold at 4,530 USD collectively reflect a world driven by uncertainty rather than stability.
Until a clear US-Iran resolution emerges, markets will continue reacting to headlines, producing cyclical volatility and structured trading opportunities across crypto, commodities, and safe-haven assets.@Gate_Square @Gate广场_Official
repost-content-media
  • Reward
  • Comment
  • Repost
  • Share
#CBOEIntroducesExtendedTradingForStockOptions
The Chicago Board Options Exchange has received SEC approval to extend trading hours for select stock options, fundamentally transforming how traders interact with the U.S. options market. This development represents one of the most significant changes in recent years, removing traditional constraints of standard market hours and opening new opportunities for global market participants.
Understanding the Core Concept
CBOE Options Exchange plans to launch extended trading hours on July 13, 2026. The new framework introduces two distinct sessions be
HighAmbition
#CBOEIntroducesExtendedTradingForStockOptions
The Chicago Board Options Exchange has received SEC approval to extend trading hours for select stock options, fundamentally transforming how traders interact with the U.S. options market. This development represents one of the most significant changes in recent years, removing traditional constraints of standard market hours and opening new opportunities for global market participants.
Understanding the Core Concept
CBOE Options Exchange plans to launch extended trading hours on July 13, 2026. The new framework introduces two distinct sessions beyond regular market hours. The pre-market session will operate from 7:30 a.m. Eastern Time to 9:25 a.m. Eastern Time, providing traders with nearly two additional hours before the standard market opens. The post-market session will run from 4:00 p.m. Eastern Time to 4:15 p.m. Eastern Time, offering a crucial fifteen-minute window after the regular market close. Both sessions will be available Monday through Friday.
The Historical Context and Previous Limitations
Prior to this development, options traders faced significant constraints regarding when they could execute trades. The standard U.S. options market operated strictly between 9:30 a.m. and 4:00 p.m. Eastern Time. This limitation created substantial challenges for traders who needed to respond to market-moving events occurring outside these hours. If significant news broke after 4:00 p.m. or before 9:30 a.m., traders had no ability to adjust their positions until the next regular trading session opened.
This temporal restriction particularly affected international investors, especially those in the Asia-Pacific region. A trader based in Tokyo would need to trade during late evening or early morning hours to participate in the U.S. options market. Similarly, European traders faced challenges as the U.S. market opened during their afternoon hours.
The New Trading Landscape
The introduction of extended trading hours fundamentally alters this landscape. Traders now gain access to significantly expanded windows for executing options strategies. The pre-market session allows traders to react to overnight developments, including Asian market performance, European market movements, and global economic events. This early access proves particularly valuable during earnings seasons when companies frequently release financial results before the regular market opens.
The post-market session provides equally important functionality. When companies announce earnings or material news after the 4:00 p.m. close, traders can now respond immediately rather than waiting overnight. This fifteen-minute window offers critical time for position adjustments following after-hours announcements.
Eligible Securities and Selection Criteria
CBOE has established specific eligibility criteria to ensure extended hours trading begins with highly liquid securities. To qualify, equity options must meet three key thresholds based on the preceding six months. The options must demonstrate average daily volume of at least 150,000 contracts. The underlying equity must maintain market capitalization of 50 billion dollars or higher. Additionally, the underlying equity must trade average daily volume of at least 10 million shares.
Based on these criteria, CBOE anticipates approximately twenty securities will be available at launch. This includes all seven Magnificent Seven stocks: Nvidia, Tesla, Apple, Microsoft, Alphabet, Amazon, and Meta Platforms. Other popular names like Palantir, Broadcom, and AMD are also expected to qualify. CBOE will update the eligible securities list semi-annually.
Benefits for Different Trader Categories
Retail traders gain substantial benefits from extended trading hours. Individual investors who maintain full-time employment often find regular market hours challenging. The pre-market session beginning at 7:30 a.m. Eastern Time provides opportunity to execute trades before beginning their workday. Those on the West Coast gain meaningful additional trading time.
Professional traders benefit from enhanced risk management capabilities. Portfolio managers can adjust hedges and implement protective strategies in response to overnight developments without waiting for regular market hours. This immediate responsiveness proves valuable during periods of market volatility.
International traders represent perhaps the greatest beneficiaries. CBOE's existing Global Trading Hours for index options have demonstrated strong demand from Asia-Pacific customers, with volumes reaching record levels in first quarter 2026, increasing 32 percent compared to first quarter 2025.
Risk Management Advantages
Extended trading hours provide powerful new tools for managing portfolio risk. Consider a scenario where a trader holds substantial call options in a technology company that announces disappointing earnings after the regular market close. Previously, this trader would face an entire night of uncertainty. Under the new system, the trader can immediately assess market reaction during the post-market session and implement appropriate protective measures.
Similarly, traders employing complex multi-leg strategies gain additional flexibility. Calendar spreads, iron condors, and other sophisticated options strategies often require precise timing. Extended hours provide more opportunities to execute adjustments at favorable prices.
Global Event Response Capabilities
Modern financial markets operate as interconnected global systems. Extended trading hours enable options traders to respond more effectively to this connectivity. When major developments occur in Asian markets, traders can adjust positions before the regular U.S. market opens. This early response capability helps prevent gap risk.
Geopolitical events, natural disasters, and unexpected policy announcements frequently occur outside regular U.S. trading hours. The extended hours framework allows traders to incorporate these developments immediately rather than waiting for the next trading day.
Earnings Season Implications
Corporate earnings announcements represent significant drivers of options trading activity. Companies increasingly release quarterly results either before market opens or after it closes. Extended trading hours directly address this pattern by allowing traders to participate in immediate market reaction to earnings news.
During earnings season, the post-market session provides critical window for trading immediate aftermath of earnings releases. When a company reports results at 4:05 p.m., traders can execute trades based on that information immediately rather than waiting for next morning.
Market Structure and Safeguards
CBOE has deliberately adopted measured approach to implementing extended trading hours. By beginning with select group of highly liquid securities, CBOE ensures extended hours sessions can support meaningful trading activity without compromising market quality. This careful rollout allows monitoring system performance before potentially expanding the program.
The eligibility criteria focusing on high-volume, large-capitalization securities help ensure adequate liquidity. Thinly traded securities can experience significant price volatility, potentially harming traders. By limiting initial participation to most liquid names, CBOE maintains appropriate market quality standards.
Practical Trading Strategies
Traders can employ various strategies to capitalize on extended hours opportunities. Pre-market trading strategies might focus on gap trading, where traders identify securities likely to open significantly higher or lower based on overnight developments. By entering positions during pre-market session, traders can potentially capture gap movements before they narrow during regular hours.
Post-market strategies often center on earnings plays. Traders might establish positions immediately following earnings announcements to capitalize on initial price reaction. This approach requires quick decision-making and careful risk management.
International arbitrage strategies become more feasible with extended hours. Traders can monitor Asian and European market movements and establish positions in U.S. options that may benefit from those global trends.
Considerations and Best Practices
While extended trading hours offer substantial benefits, traders should remain aware of certain considerations. Liquidity during extended hours sessions may be lower than during regular market hours, potentially resulting in wider bid-ask spreads. Traders should adjust order sizing accordingly, potentially using limit orders rather than market orders.
Volatility during extended hours can differ significantly from regular session patterns. With fewer participants, price movements may be more pronounced in response to news events. Traders should account for this potential volatility in position sizing.
Not all brokers may immediately support extended hours options trading. Traders should verify with brokerage providers regarding availability and specific requirements.
The Future of Options Trading
CBOE's extended trading hours initiative represents part of broader industry trend toward more continuous market access. The exchange has indicated plans to launch 23x5 U.S. equities trading on EDGX Equities Exchange in December 2026. This expansion suggests near-continuous trading may become standard across multiple asset classes.
International demand for U.S. market access continues growing. Extended trading hours directly address this demand, making U.S. options markets more accessible to global participants.
Conclusion
CBOE's introduction of extended trading hours for stock options marks significant evolution in U.S. options market structure. Beginning July 13, 2026, traders will gain access to pre-market sessions from 7:30 a.m. to 9:25 a.m. Eastern Time and post-market sessions from 4:00 p.m. to 4:15 p.m. Eastern Time for select highly liquid securities. This expansion provides enhanced flexibility, improved risk management capabilities, and ability to respond immediately to market-moving events.
The benefits extend across all trader categories. While traders should remain mindful of potential liquidity and volatility differences, overall impact proves overwhelmingly positive. As financial markets continue evolving toward more continuous global trading, CBOE's extended hours initiative positions traders to capitalize on opportunities whenever they arise.@Gate_Square @Gate广场_Official
repost-content-media
  • Reward
  • Comment
  • Repost
  • Share
#TradeCFDWinGold
#BTC
1. Current BTC Market Overview
Bitcoin (BTC) is currently trading near $75,800 after pulling back from recent highs around $77,280. BTC remains significantly below its cycle peak near $126,000, but the market is still holding well above the major panic lows seen earlier this year around $65,000–$69,000.
During the past week, BTC moved through several important levels:
May 23: ~$75,488
May 24: ~$76,670
May 25: ~$76,981
May 26: ~$77,280 high
Current range: ~$75,000–$76,000
The recent decline of roughly 2–3% came after uncertainty returned around the developing US-Iran peac
HighAmbition
#TradeCFDWinGold
#BTC
1. Current BTC Market Overview
Bitcoin (BTC) is currently trading near $75,800 after pulling back from recent highs around $77,280. BTC remains significantly below its cycle peak near $126,000, but the market is still holding well above the major panic lows seen earlier this year around $65,000–$69,000.
During the past week, BTC moved through several important levels:
May 23: ~$75,488
May 24: ~$76,670
May 25: ~$76,981
May 26: ~$77,280 high
Current range: ~$75,000–$76,000
The recent decline of roughly 2–3% came after uncertainty returned around the developing US-Iran peace negotiations. Markets initially reacted positively to Trump's statements regarding a possible agreement, but optimism faded when Iranian officials disputed parts of the announcement.
At the moment, BTC is behaving less like a pure inflation hedge and more like a high-volatility macro asset directly tied to geopolitical headlines, oil prices, and Federal Reserve expectations.
2. Why BTC Declined — The Geopolitical Breakdown
The February Conflict Shock
On February 28, 2026, military escalation between the United States, Israel, and Iran triggered a major shock across global markets. Because traditional markets were closed during the weekend, crypto markets became the primary venue for real-time global risk pricing.
Bitcoin immediately experienced heavy volatility, falling toward the $65K–$69K region before stabilizing
.
The major catalyst behind the continued pressure was Iran's threat surrounding the Strait of Hormuz, one of the world's most critical energy shipping routes responsible for nearly 20% of global oil transport.
Oil prices surged above $104 per barrel, triggering fears of:
Higher global inflation
Supply-chain disruption
Energy shortages
Federal Reserve tightening
These factors created strong macro pressure against risk assets including crypto.
Why BTC Remained Under Pressure
1. Inflation & Fed Pressure
Rising oil prices pushed US inflation expectations toward 6% for Q2 2026. Higher inflation increases the probability of additional Federal Reserve tightening.
Higher interest rates usually hurt BTC because investors shift capital toward safer yield-generating assets.
This remains one of the largest bearish forces currently affecting Bitcoin.
2. Risk-Off Market Environment
During military conflict, investors traditionally move capital toward defensive assets. Gold surged toward $4,700+ per ounce, while BTC initially traded more like a technology risk asset rather than "digital gold."
3. Leverage Liquidations
The BTC market remains heavily leveraged. Every major negative headline triggered liquidation cascades between $75K and $65K, accelerating downside volatility beyond normal spot selling.
4. Iran's Crypto Infrastructure
Iran reportedly contributes a meaningful share of global BTC mining activity and has historically used crypto channels for trade settlement outside traditional financial systems.
If sanctions eventually ease, some of this crypto-related demand could temporarily decline as conventional financial channels reopen.
3. Current Situation — Peace Negotiations
Trump's Announcement
On May 23, Trump stated that a framework agreement between the US and Iran had been largely negotiated and suggested the Strait of Hormuz could reopen.
BTC reacted immediately:
Sharp recovery from intraday weakness
Rapid move toward $77K
Short-liquidation driven momentum
The market interpreted this as a potential end to the energy shock.
Why Markets Remain Uncertain
Despite the optimism, several major issues remain unresolved:
Iran's nuclear program
Strait of Hormuz authority
Sanctions relief structure
Verification mechanisms
Ceasefire enforcement
Iranian media disputed parts of Trump's statements, which quickly reduced market confidence.
As a result, BTC remains trapped between bullish peace expectations and bearish escalation fears.
4. BTC Price Forecast — Possible Scenarios
Scenario 1 — Peace Deal Confirmed (Bullish)
If negotiations finalize successfully and the Strait of Hormuz fully reopens:
Expected Market Chain Reaction
Reopened shipping routes → oil prices decline → inflation pressure eases → Fed fears reduce → risk appetite returns → BTC rallies strongly.
Potential BTC Targets
Immediate breakout: $78K–$80K
Medium-term target: $83,500
Extended upside: $85K
Larger recovery zone: $100K+
A breakout above $78K could trigger aggressive short squeezes because many leveraged shorts are positioned around that level.
Scenario 2 — Negotiations Collapse (Bearish)
If talks fail or military escalation resumes:
Expected Market Reaction
Oil remains above $100
Inflation stays elevated
Fed hawkish pressure increases
Risk-off sentiment accelerates
Potential BTC Targets
First support: $72K
Major support: $70K
Extreme downside: $65K
Losing the $75K support would likely trigger another wave of leveraged liquidations
.
Scenario 3 — Ongoing Stalemate (Neutral)
This is the current market structure.
BTC likely remains trapped between:
Support: $73K–$75K
Resistance: $78K
Volatility will continue to depend heavily on headlines from US and Iranian officials.
This environment creates sharp 2–5% swings almost daily.
5. Major Factors Affecting Bitcoin Right Now
A. Geopolitical Drivers
US-Iran Relations
Currently the single strongest short-term BTC catalyst.
Strait of Hormuz
Directly affects:
Oil prices
Inflation
Federal Reserve policy
Risk sentiment
Middle East Stability
Broader regional tensions continue impacting global markets.
B. Macroeconomic Drivers
Federal Reserve
Rate hikes remain bearish for BTC.
Inflation
6% inflation pressure continues weighing on risk assets.
US Dollar Strength
Strong USD generally pressures BTC lower.
Global Liquidity
Long-term expansion of global money supply remains structurally bullish for Bitcoin.
C. Institutional Factors
ETF Flows
Spot BTC ETFs remain one of the largest institutional demand channels.
Strong inflows = bullish
Outflows = bearish
Corporate Treasury Adoption
More companies continue adding BTC exposure, strengthening long-term market structure.
Whale Activity
Large holders appear cautiously accumulating within the $73K–$78K zone.
D. Technical Factors
Major Support Levels
$75K
$70K
$65K
Major Resistance Levels
$78K
$80K
$85K
$100K
$126K ATH
RSI & Trend Structure
BTC currently appears neutral-to-slightly oversold, supporting a range-bound market until a macro catalyst emerges.
6. Trading Strategies
Strategy 1 — Event-Driven Trading
Monitor geopolitical headlines closely.
Bullish Trigger
Sustained breakout above $78K
Bearish Trigger
Loss of $75K support
Strategy 2 — Range Trading
Current environment favors controlled range trades:
Buy zone: $73K–$75K
Sell zone: $78K–$80K
Because volatility is elevated, smaller position sizes are safer.
Strategy 3 — Breakout Positioning
If a confirmed peace agreement emerges:
Long Targets
$83.5K
$85K
$100K
Risk Management
Protective stop below $75K
Strategy 4 — Long-Term Accumulation
Long-term investors continue viewing BTC as a strategic accumulation asset.
Key long-term thesis:
Institutional adoption continues expanding
ETF infrastructure remains strong
Global liquidity trends support BTC over time
Post-halving supply reduction still favors higher long-term prices
Accumulation zones:
$70K–$75K
Extreme value zone near $65K if reached
7. Market Psychology
The market is currently divided into three major camps:
Camp 1 — Buy The Dip
Believes peace negotiations eventually succeed and BTC resumes recovery toward $85K–$100K.
Camp 2 — Wait For Clarity
Avoids aggressive positioning until negotiations are finalized.
Camp 3 — Long-Term Monetary Expansion Bulls
Believes global debt growth and liquidity expansion eventually push BTC dramatically higher over the coming years.
8. Final Summary
Bitcoin is currently trading near $75,800, sitting at one of the most important macro crossroads of 2026.
The market is being heavily influenced by:
US-Iran negotiations
Oil prices above $100
Inflation near 6%
Federal Reserve policy expectations
ETF institutional flows
Geopolitical volatility
The next few weeks are critical.
Bullish Case
A finalized peace agreement and reopening of the Strait of Hormuz could rapidly push BTC toward:
$80K
$85K
Potentially $100K later in 2026
Bearish Case
Negotiation failure or renewed escalation could send BTC back toward:
$72K
$70K
Possibly $65K
For now, BTC remains trapped between uncertainty and opportunity, with the $75K support and $78K resistance acting as the key decision zones for the next major move.@Gate_Square @Gate广场_Official #DailyPolymarketHotspot #StockTradingChallengeUpTo17000U #GatePredictionMarketAddsSmartMoneyTracking
repost-content-media
  • Reward
  • 1
  • Repost
  • Share
HighAmbition:
To The Moon 🌕
#StockTradingChallengeUpTo17000U
Stocks All-Market Trading Challenge: Win Up to 17,000 USDT per Person
The Stocks All-Market Trading Challenge is a comprehensive trading competition organized by Gate TradFi, designed to encourage users to explore the complete stock trading ecosystem available on the platform. This event offers participants the opportunity to earn substantial rewards of up to 17,000 USDT by engaging in various stock-related trading activities across three major tracks.
Event Overview and Duration
The competition runs from May 25, 2026, at 09:00 UTC to June 15, 2026, at 09:00 U
ONDO1.27%
GUSD0.01%
HighAmbition
#StockTradingChallengeUpTo17000U
Stocks All-Market Trading Challenge: Win Up to 17,000 USDT per Person
The Stocks All-Market Trading Challenge is a comprehensive trading competition organized by Gate TradFi, designed to encourage users to explore the complete stock trading ecosystem available on the platform. This event offers participants the opportunity to earn substantial rewards of up to 17,000 USDT by engaging in various stock-related trading activities across three major tracks.
Event Overview and Duration
The competition runs from May 25, 2026, at 09:00 UTC to June 15, 2026, at 09:00 UTC, giving participants approximately three weeks to complete their trading tasks and climb the rankings. The challenge encompasses multiple product categories within the Stocks Zone, including spot trading, futures trading, and Contracts for Difference (CFDs), along with various ecosystem products such as Convert, ETFs, and Earn products.
Eligible Product Scope
The event is structured around three distinct modules. Module One covers Stocks Zone Spot and Futures, which includes stock token spot trading, stock-related futures contracts, and associated copy trading activities. Module Two focuses exclusively on Stocks Zone CFDs, where only stock-related CFD asset trading counts toward rewards. Module Three encompasses Stocks Zone Ecosystem Products, including stock-related Convert transactions, ETF trading, Earn products, and other eligible assets as specified on the event page.
Event One: Stocks Zone New User Tasks
This component is designed to attract new participants and reward existing users for referrals. New users who register on Gate, complete Know Your Customer (KYC) verification, and execute any Stocks Zone CFD trade worth at least 1,000 USDT receive a random stock token reward valued between 2 and 10 USDT. Similarly, users who invite friends to participate can earn the same reward when their invited friend completes KYC and executes a qualifying CFD trade of at least 1,000 USDT. Each inviter can receive rewards for up to ten invited friends, provided those friends register during the event period.
Event Two: Stock Spot Trading Task
Participants who achieve specific cumulative trading volumes in Stocks Zone spot trading become eligible for tiered USDT rewards. The reward structure begins at 2 USDT for users who reach a cumulative spot trading volume of at least 5,000 USDT. Higher volumes unlock progressively larger rewards, with 10 USDT available at 50,000 USDT volume, 100 USDT at 500,000 USDT volume, 300 USDT at 5,000,000 USDT volume, 800 USDT at 10,000,000 USDT volume, and 1,500 USDT at 50,000,000 USDT volume. Each participant receives only the reward for the highest tier achieved, with no duplicate rewards issued.
Event Three: Stock Futures Trading Task
This track rewards users based on their cumulative futures trading volume with Futures Position Trial Vouchers. Starting at 10 USDT for 50,000 USDT in trading volume, the rewards escalate to 50 USDT at 1,000,000 USDT volume, 200 USDT at 5,000,000 USDT volume, 1,000 USDT at 20,000,000 USDT volume, and 5,000 USDT at 100,000,000 USDT volume. The trading volume calculation includes valid trades from related futures, copy trading, and quantitative trading bots, with final statistics determined by Gate's backend records.
Event Four: Stock CFD Trading Ranking
The most competitive aspect of the challenge, this event ranks participants based on their valid cumulative CFD trading volume. The top 100 users who meet minimum trading volume requirements share a prize pool of cash rewards and CFD Position Trial Vouchers. The first-place winner who achieves at least 1,000,000,000 USDT in CFD trading volume receives 2,000 USDT in cash. Second place requires at least 500,000,000 USDT volume for a 1,000 USDT cash reward, while third place needs at least 100,000,000 USDT volume for 500 USDT cash. Positions four through ten, requiring at least 50,000,000 USDT volume, each receive 1,000 USDT in CFD Position Trial Vouchers. Positions eleven through fifty, with a minimum of 10,000,000 USDT volume, receive 400 USDT vouchers each, and positions fifty-one through one hundred, requiring at least 5,000,000 USDT volume, receive 200 USDT vouchers each.
Event Five: Stock Ecosystem Experience Tasks
Participants can earn additional rewards by completing various stock-related ecosystem experience tasks. Each task offers a random cash reward between 2 and 10 USDT, limited to the first 500 users per task. The Stock Convert Task requires completing stock-related Convert transactions of at least 1,000 USDT. The Stock ETF Task requires stock-related ETF trading of at least 2,000 USDT. The ONDO Series Earn task involves participating in ONDO Series Earn activities with at least 1,000 USDT. The GUSD U.S. Treasury Experience Task requires subscribing to GUSD U.S. Treasury-related products with at least 1,000 USDT and holding for twenty-four hours. Each user can claim each task reward only once, and these rewards can be combined with rewards from Events One through Three.
Terms and Conditions
Participants must click the Join Now button on the event page to register and complete identity verification before becoming eligible for rewards. The event only counts valid Stocks Zone-related trading and task data after successful registration. Trading volume is calculated as the sum of buy volume and sell volume, with each product category calculated separately according to its specific rules. Trading volumes do not combine across different categories.
Events One, Two, and Three operate as independent tracks, allowing rewards to stack across tracks. However, within the same track, only the highest-tier reward is issued without duplication. Event rewards are distributed to user accounts within fourteen business days after the event concludes, with cash rewards going to spot accounts and trial vouchers viewable in the Voucher Center.
Certain user categories are excluded from participation, including API users, VIP 14 and above users, market makers, corporate accounts, institutional accounts, broker accounts, and sub-accounts. Gate reserves the right to disqualify users and cancel rewards for prohibited activities such as bulk registrations, wash trading, self-trading, matched trades, fake referrals, abnormal arbitrage, or exploitation of system vulnerabilities.
Risk Considerations
Participants should be aware that trading involving traditional assets and crypto assets carries risks related to market volatility, leverage, liquidity, exchange rates, policies, and compliance. The event does not constitute investment advice or guarantee returns. Additionally, TradFi products, CFDs, U.S. Treasuries, stocks, indices, forex, commodities, and related products may be subject to regional laws and regulations, potentially restricting access for users in certain jurisdictions.@Gate_Square @Gate广场_Official #TradeCFDWinGold #StockTradingChallengeUpTo17000U #DailyPolymarketHotspot
repost-content-media
  • Reward
  • 2
  • Repost
  • Share
HighAmbition:
To The Moon 🌕
View More
#TrumpBacksCFTCAuthorityOverPredictionMarkets
Trump’s support for giving the Commodity Futures Trading Commission (CFTC) authority over prediction markets has become a major topic in financial regulation because it directly affects prediction markets, cryptocurrency platforms, blockchain finance, institutional investment, and the future structure of digital financial systems in the United States.
Prediction markets have rapidly expanded from small online speculation platforms into large financial ecosystems where billions of dollars are traded on elections, inflation data, sports outcomes, cr
HighAmbition
#TrumpBacksCFTCAuthorityOverPredictionMarkets
Trump’s support for giving the Commodity Futures Trading Commission (CFTC) authority over prediction markets has become a major topic in financial regulation because it directly affects prediction markets, cryptocurrency platforms, blockchain finance, institutional investment, and the future structure of digital financial systems in the United States.
Prediction markets have rapidly expanded from small online speculation platforms into large financial ecosystems where billions of dollars are traded on elections, inflation data, sports outcomes, cryptocurrency prices, economic reports, and geopolitical events. As blockchain technology and crypto infrastructure continue growing globally, prediction markets are becoming increasingly connected with decentralized finance systems, stablecoins, and digital asset trading platforms.
The central debate is whether prediction markets should remain under federal oversight through the CFTC or whether individual US states should regulate them using gambling laws. The outcome could significantly influence the future of crypto adoption and financial innovation.
Part 1 — Understanding the CFTC
What Is the CFTC?
The Commodity Futures Trading Commission is an independent US federal agency established in 1974 to regulate futures markets, derivatives trading, options markets, and commodity-linked contracts. Its main purpose is ensuring financial markets remain transparent, fair, stable, and resistant to manipulation.
The CFTC supervises markets connected to future outcomes and price speculation, which is why prediction markets increasingly fall under its authority. Unlike state gaming regulators that often classify these platforms as betting systems, the CFTC views them as financial derivative markets.
Under federal oversight, prediction market companies must maintain:
Compliance systems
Anti-money laundering procedures
Market surveillance technology
Investor protection measures
Transparent pricing structures
Supporters believe federal oversight creates a more stable and institutionally acceptable framework than fragmented state regulation.
Part 2 — Understanding Prediction Markets
What Are Prediction Markets?
Prediction markets are platforms where users trade contracts linked to future outcomes instead of traditional assets like stocks or commodities. Traders buy and sell contracts based on whether specific events will happen.
These markets cover:
Elections
Inflation reports
Interest rate decisions
Sports events
Weather developments
Economic indicators
Cryptocurrency price movements
Geopolitical events
The concept is based on the “wisdom of crowds” theory, where large groups of financially motivated participants collectively produce highly accurate forecasts.
Major Prediction Market Platforms
Kalshi
Kalshi became one of the first federally regulated prediction market platforms operating directly under CFTC supervision in the United States.
Polymarket
Polymarket is a blockchain-based prediction market platform that became highly popular during election cycles and major geopolitical events because it integrated crypto infrastructure into event trading.
Crypto-Based Prediction Systems
Several crypto-focused companies now integrate prediction markets with stablecoins, smart contracts, blockchain settlements, and decentralized finance systems. This growing overlap between crypto and prediction markets is attracting major regulatory and institutional attention.
Part 3 — Trump’s Position
Trump’s Support for Federal Oversight
Trump publicly stated that prediction markets should remain under CFTC oversight rather than being restricted by individual state governments. According to his position, a unified federal framework would strengthen innovation, improve market growth, and help America remain competitive in financial technology.
He argued that fragmented state regulations could slow innovation, reduce investment, and push capital toward international jurisdictions offering more supportive environments for digital finance.
Trump also emphasized that other countries are aggressively competing to dominate blockchain finance, fintech infrastructure, and digital asset innovation.
The “Gold Standard” Framework
Trump described his preferred approach as a “Gold Standard” regulatory framework. This means a nationwide system where prediction market companies operate under one federal structure instead of navigating fifty different state laws.
Such a framework could:
Reduce legal uncertainty
Improve institutional confidence
Lower compliance complexity
Encourage investment growth
Accelerate innovation
Supporters believe this would allow prediction markets to integrate more smoothly into mainstream finance.
Part 4 — State vs Federal Conflict
Why States Oppose Prediction Markets
Several US states believe prediction markets closely resemble gambling operations and therefore should be regulated under gaming laws instead of federal derivatives frameworks.
State officials have raised concerns involving:
Consumer protection
Addiction-related behavior
Excessive speculation
Market manipulation
Insider information abuse
As a result, multiple states launched enforcement actions against prediction market operators.
The Federal Response
The CFTC strongly defended its authority by arguing prediction markets qualify as financial derivative systems connected to interstate commerce.
Federal regulators believe prediction markets can:
Improve forecasting accuracy
Aggregate market intelligence
Support risk management
Enhance economic analysis
Improve price discovery
This disagreement has become one of the most important regulatory battles in financial technology markets.
Part 5 — Explosive Industry Growth
Why Prediction Markets Are Growing Rapidly
Prediction markets experienced enormous growth because investors increasingly view them as real-time information systems capable of reflecting public expectations regarding politics, economics, inflation, and financial developments.
Trading volume increased sharply as institutional investors, hedge funds, and retail traders entered the sector.
Prediction contracts now cover:
Political elections
Inflation expectations
Federal Reserve policy
Sports outcomes
Crypto volatility
Economic indicators
Global geopolitical developments
Large investment firms and venture capital groups have also increased funding into prediction market infrastructure because many analysts believe the industry could become a permanent component of global finance.
Part 6 — Impact on Cryptocurrency Markets
Why Crypto Markets Care About This Issue
The cryptocurrency industry is closely watching prediction market regulation because both sectors increasingly overlap through blockchain infrastructure, stablecoins, decentralized finance systems, and smart contracts.
If prediction markets achieve strong regulatory clarity under the CFTC, many analysts believe this could eventually create positive precedents for broader cryptocurrency regulation.
Institutional Adoption Benefits
One of the biggest barriers facing crypto markets has been regulatory uncertainty involving overlapping authority between federal agencies and state governments.
A clearer framework could:
Improve investor confidence
Encourage institutional participation
Reduce legal confusion
Expand blockchain innovation
Accelerate crypto infrastructure growth
Institutional investors generally prefer transparent legal environments because predictable regulation lowers operational risk.
Stablecoins and Blockchain Integration
Prediction markets increasingly rely on stablecoins and blockchain settlements, directly strengthening crypto infrastructure adoption.
This creates several effects:
Rising stablecoin demand
Increased blockchain activity
Expanded smart contract usage
Greater decentralized finance utility
More real-world blockchain applications
As prediction markets continue expanding, blockchain infrastructure could become more deeply integrated into mainstream finance.
Part 7 — Ethical and Political Concerns
Conflict of Interest Debate
Critics argue Trump’s support for prediction markets creates ethical concerns because individuals connected to his political and business network reportedly maintain relationships with parts of the prediction market industry.
Opponents claim favorable regulation could indirectly benefit private interests, while supporters argue innovation-friendly policies are necessary for maintaining American competitiveness.
Insider Information Risks
Prediction markets also face concerns regarding traders potentially using non-public information to profit from geopolitical or political event contracts.
This forced regulators and platforms to strengthen:
Surveillance systems
Compliance monitoring
Trade analysis technology
Market integrity protections
Supporters argue federally supervised systems are safer than unregulated offshore alternatives.
Part 8 — Global Competition
International Financial Innovation Race
Several countries are aggressively competing to attract blockchain companies, fintech firms, crypto businesses, and digital asset infrastructure.
Major innovation-friendly regions include:
United Arab Emirates
Singapore
Switzerland
United Kingdom
European Union
If the United States becomes too restrictive, investment capital and innovation could increasingly shift toward international markets offering clearer regulatory frameworks.
Trump’s position reflects concern that America must remain competitive in the rapidly evolving digital financial economy.
Part 9 — Future Outlook
Bullish Scenario
If federal oversight expands successfully:
Prediction markets could gain mainstream legitimacy
Institutional investment could accelerate
Blockchain adoption could increase
Stablecoin usage could expand rapidly
Crypto infrastructure could strengthen significantly
Bearish Scenario
If legal conflicts intensify and states continue resisting federal oversight:
Regulatory fragmentation may continue
Institutional participation could slow
Innovation growth may weaken
Market uncertainty could remain elevated
Most Likely Outcome
The most realistic scenario is gradual integration where federal oversight slowly expands while some states continue maintaining restrictions. Over time, institutional adoption and technological development may continue pushing prediction markets deeper into mainstream finance.
Trump’s support for CFTC authority over prediction markets represents a major turning point for digital finance, cryptocurrency infrastructure, blockchain-based trading systems, and financial innovation.
The issue now extends far beyond gambling regulation because it affects:
Crypto regulation
Institutional finance
Stablecoin adoption
Blockchain innovation
Financial transparency
Global competitiveness
Prediction markets are evolving into major financial information systems capable of influencing economic forecasting, investor sentiment, and market behavior across global financial ecosystems. At the same time, cryptocurrencies and blockchain infrastructure are becoming increasingly integrated with these platforms through decentralized finance systems, stablecoins, and smart contract settlements.
The final regulatory outcome could shape the future of digital financial markets for years and determine whether the United States remains a global leader in financial innovation or loses momentum to faster-moving international competitors.
@Gate_Square @Gate广场_Official #DailyPolymarketHotspot #StockTradingChallengeUpTo17000U
repost-content-media
  • Reward
  • 1
  • Repost
  • Share
HighAmbition:
thnxx for the update
#MicronMarketCapBreaks1Trillion
Micron Technology’s Historic Journey to the $1 Trillion Market Cap Milestone:
A Defining Moment in Global Semiconductor History
On May 26, 2026, Micron Technology crossed a historic threshold that reshaped the global semiconductor narrative. The company officially entered the $1 trillion market capitalization club, becoming one of the most valuable technology enterprises in the world and marking a defining moment for the memory chip industry.
This achievement was not a sudden spike in valuation but the result of years of structural transformation, technologica
HighAmbition
#MicronMarketCapBreaks1Trillion
Micron Technology’s Historic Journey to the $1 Trillion Market Cap Milestone:
A Defining Moment in Global Semiconductor History
On May 26, 2026, Micron Technology crossed a historic threshold that reshaped the global semiconductor narrative. The company officially entered the $1 trillion market capitalization club, becoming one of the most valuable technology enterprises in the world and marking a defining moment for the memory chip industry.
This achievement was not a sudden spike in valuation but the result of years of structural transformation, technological advancement, and macroeconomic alignment driven by artificial intelligence. Micron’s stock surge of nearly 19% in a single trading session reflected a broader market realization: memory chips are no longer cyclical commodities but foundational infrastructure of the AI economy.
The milestone symbolizes more than corporate success—it represents the restructuring of global computing demand, where memory bandwidth, speed, and scalability now define technological competitiveness across industries.
The Immediate Catalyst: UBS’s Historic Revaluation of Micron
The immediate trigger behind Micron’s explosive valuation shift was a major research update from UBS, which significantly upgraded its price outlook for the company. The revision reflected a structural reassessment of the memory industry rather than short-term optimism.
The analyst highlighted that artificial intelligence has permanently altered demand patterns for DRAM and high-bandwidth memory (HBM). These components are now essential for training large-scale AI models, making them critical infrastructure rather than optional hardware.
A key factor in the upgrade was the emergence of long-term supply agreements across the semiconductor memory ecosystem. Approximately 30% of global DRAM demand is now locked into multi-year contracts with semi-fixed pricing structures. This development has reduced volatility and introduced revenue predictability previously unseen in the sector.
The implication is profound: Micron is transitioning from a cyclical supplier into a semi-structured infrastructure provider within the AI economy.
Market Performance: A Multi-Year Acceleration Phase
Micron’s stock performance leading up to the trillion-dollar milestone reflects one of the most aggressive growth phases in semiconductor history.
Over a 12-month period, the stock delivered returns exceeding 800%, while year-to-date gains in 2026 alone crossed 175%. This performance significantly outpaced broader technology indices and most AI-linked equities.
The transition past the $1 trillion valuation occurred at approximately $886.74 per share, followed by continued momentum toward intraday peaks near $985. This sustained upward movement indicated strong institutional participation rather than speculative retail-driven volatility.
The company’s valuation expansion also repositioned it within the global corporate hierarchy, surpassing multiple established industrial and consumer giants, and firmly embedding itself among the top-tier U.S. technology leaders.
The AI Revolution: Structural Demand Reshaping Memory Markets
The central driver behind Micron’s transformation is the artificial intelligence revolution, which has fundamentally changed how memory is consumed, scaled, and valued.
AI workloads require extremely high memory bandwidth to process massive datasets in real time. This has led to exponential demand growth in DRAM and HBM technologies, particularly within hyperscale data centers operated by major cloud providers.
Unlike traditional consumer electronics cycles, AI infrastructure investment is long-term, capital-intensive, and less sensitive to short-term economic fluctuations. This has created a structural demand floor for advanced memory products.
HBM (High-Bandwidth Memory) has emerged as the most critical segment in this transformation. It is essential for AI accelerators and next-generation GPUs, enabling faster computation and reduced latency.
The competitive landscape in HBM is highly concentrated, with only a few global players capable of manufacturing at scale. This oligopolistic structure has strengthened pricing power and increased margins across the industry.
Financial Performance: Exceptional Growth Across All Metrics
Micron’s financial performance provides strong validation for its re-rating.
In fiscal year 2025, the company generated approximately $37.38 billion in revenue, representing nearly 50% year-over-year growth. Net income surged dramatically, reflecting improved pricing power and operational leverage.
The first quarter of fiscal 2026 marked a new phase of acceleration, with revenue reaching $13.64 billion and earnings per share significantly exceeding analyst expectations. Operating cash flow strengthened substantially, reinforcing balance sheet resilience.
The second quarter of fiscal 2026 demonstrated even more aggressive expansion, with revenue nearly tripling year-over-year. DRAM-based AI server demand accounted for the majority of revenue contribution, highlighting the company’s strategic alignment with AI infrastructure buildout.
Gross margins expanded sharply into the mid-to-high 60% range, reflecting improved product mix and pricing discipline across memory categories.
The Memory Supercycle: A Structural Shift, Not a Cycle
The current market environment is widely described as a “memory supercycle,” but its characteristics differ fundamentally from previous semiconductor cycles.
Historically, memory markets were driven by consumer demand from smartphones, PCs, and tablets. These cycles were short, volatile, and heavily supply-driven.
In contrast, the current phase is defined by:
Long-term AI infrastructure spending commitments
Persistent hyperscaler capital expenditure growth
Technological complexity increasing switching costs
Limited supply expansion due to capital discipline
These factors suggest a more durable and extended growth phase rather than a traditional boom-bust cycle.
Additionally, supply constraints across leading manufacturers have prevented rapid overcapacity buildup, historically the primary cause of memory downturns.
Competitive Landscape: The Global Memory Oligopoly
The global memory market is dominated by a triad of companies: Micron, Samsung, and SK Hynix. This structure creates a highly controlled supply environment.
SK Hynix currently leads the HBM segment, while Micron has significantly strengthened its position, overtaking Samsung in key advanced memory categories. Samsung, despite its scale advantage, has faced execution challenges in next-generation HBM technologies.
This competitive dynamic has shifted the balance of power within the semiconductor industry. Leadership is now determined not by overall output but by technological specialization in AI-focused memory products.
The rivalry has also intensified R&D investment cycles, accelerating innovation while reinforcing barriers to entry for new competitors.
Manufacturing Expansion: Strategic U.S.
Semiconductor Resurgence
Micron’s trillion-dollar valuation milestone coincides with a massive expansion of its domestic manufacturing footprint in the United States.
Supported by national semiconductor policy initiatives, the company is investing heavily in advanced DRAM fabrication facilities across Idaho, New York, and Virginia. These investments aim to localize production of next-generation memory technologies.
A major milestone includes the introduction of advanced DRAM manufacturing nodes in U.S.-based facilities, marking a shift in global supply chain geography.
This expansion serves multiple strategic objectives:
Reducing geopolitical supply chain risk
Strengthening domestic semiconductor independence
Supporting defense and critical infrastructure supply chains
Expanding workforce development in advanced manufacturing
The long-term impact of this shift is expected to redefine global semiconductor supply distribution.
Analyst Outlook: Strong Institutional Conviction
Wall Street sentiment toward Micron has become increasingly bullish, with multiple institutions issuing aggressive price targets based on forward earnings projections.
Consensus estimates suggest continued earnings acceleration driven by AI demand, with forward P/E multiples supporting significantly higher valuations than historical norms.
The most optimistic scenarios project potential valuation expansion beyond current trillion-dollar levels, depending on sustained demand growth and stable supply conditions.
However, such projections assume continued structural demand from hyperscale AI infrastructure providers, which remains the key variable for long-term performance.
Valuation Perspective: Growth vs. Cyclical Risk
Despite rapid appreciation, Micron’s valuation remains a subject of debate among investors.
On one hand, the company trades at elevated earnings multiples compared to historical semiconductor averages, reflecting its transition into a higher-quality earnings profile.
On the other hand, forward earnings growth projections suggest that current valuation levels may still underestimate long-term potential if AI demand remains strong.
Key valuation drivers include:
Sustained DRAM pricing strength
Expansion of HBM margins
Long-term AI infrastructure demand stability
Supply discipline across the industry
The balance between growth expectations and cyclical risk will define future market behavior.
Risk Factors: Structural and Macroeconomic Challenges
Despite strong momentum, several risks remain relevant.
The most significant is the potential slowdown in AI infrastructure investment. Any reduction in hyperscaler capital expenditure could directly impact memory demand.
Memory pricing volatility also remains an inherent risk, even with long-term contracts in place. Semiconductor markets have historically experienced sharp corrections following periods of excess demand.
Geopolitical tensions further complicate the outlook, particularly given global semiconductor supply chain dependencies across Asia and the United States.
Finally, valuation sensitivity introduces downside risk, as high-growth stocks are more vulnerable to sentiment shifts and earnings misses.
Strategic Importance: Beyond Corporate Valuation
Micron’s rise to a trillion-dollar valuation represents more than financial achievement. It reflects a broader transformation in global technology infrastructure.
Memory has transitioned from a supporting component to a strategic bottleneck in computing performance. As AI systems become more advanced, memory bandwidth increasingly defines the limits of computational scalability.
This shift positions Micron as a critical enabler of the global AI ecosystem, with implications spanning defense, cloud computing, autonomous systems, and industrial automation.
Conclusion: A Structural Turning Point in the Semiconductor Era
Micron Technology’s ascent to a $1 trillion market capitalization marks a historic turning point in both corporate and technological evolution.
The company has successfully transitioned from a cyclical memory manufacturer into a central pillar of the artificial intelligence revolution. This transformation has been driven by structural demand, technological leadership, and strategic manufacturing expansion.
While risks remain, the scale and durability of current demand trends suggest that Micron’s journey may still be in its early stages. The trillion-dollar milestone is not the endpoint of growth, but rather a signal of entry into a new phase of global semiconductor evolution.
In the broader context, Micron’s success reflects the beginning of a new industrial era—one defined by data, intelligence, and memory-driven computation.@Gate_Square @Gate广场_Official #TradeCFDWinGold #StockTradingChallengeUpTo17000U #DailyPolymarketHotspot
repost-content-media
  • Reward
  • 1
  • Repost
  • Share
HighAmbition:
good information 👍👍
#TrumpBacksCFTCAuthorityOverPredictionMarkets
The regulatory battle between global financial markets and prediction platforms has entered a new phase.
On May 26, former US President Donald Trump shared an important statement on Truth Social, where he clearly supported that exclusive authority over prediction markets should belong only to the CFTC.
This statement has sparked intense discussion in both political and financial circles.
Prediction markets are rapidly heading toward mainstream adoption.
On these platforms, users take positions on political elections, economic events, crypto moveme
View Original
2In1
#TrumpBacksCFTCAuthorityOverPredictionMarkets
Global financial markets aur prediction platforms ke darmiyan regulatory battle ek naye phase mein enter kar chuki hai.
May 26 ko former US President Donald Trump ne Truth Social par ek important statement share kiya jahan unhone clearly support kiya ke prediction markets par exclusive authority sirf CFTC ke paas honi chahiye. Is statement ne political aur financial circles dono mein intense discussion shuru kar di hai.
Prediction markets rapidly mainstream adoption ki taraf ja rahe hain.
In platforms par users political elections, economic events, crypto movements aur real-world outcomes par positions lete hain.
Is growing industry ke sath regulatory clarity ka issue bhi bohot important ban gaya hai. Trump ka latest stance isi debate ko aur strong bana raha hai.
CFTC yani Commodity Futures Trading Commission traditionally derivatives aur futures markets ko regulate karti hai.
Trump ke support ka matlab ye samjha ja raha hai ke wo prediction markets ko gambling category ke bajaye financial innovation aur derivatives ecosystem ka hissa dekhna chahte hain.
Agar future mein ye direction officially strengthen hoti hai to prediction market industry ke liye massive growth opportunities create ho sakti hain.
Recent months mein blockchain-based prediction platforms aur decentralized betting ecosystems ne extraordinary growth dekhi hai.
Crypto users increasingly aise platforms ki taraf move kar rahe hain jahan real-world events ko tradable assets ki tarah use kiya jata hai.
Is wajah se regulators bhi ab actively define karne ki koshish kar rahe hain ke in platforms ko kaun supervise karega.
Trump ka ye statement especially is liye significant mana ja raha hai kyunki US election cycle aur crypto regulation dono simultaneously headlines mein hain.
Market analysts believe karte hain ke agar prediction markets ko clearer legal framework milta hai to institutional participation bhi increase ho sakti hai.
Investors regulatory certainty ko hamesha positive signal ke taur par dekhte hain.
Crypto community mein bhi is development ko closely monitor kiya ja raha hai.
Decentralized finance aur blockchain governance projects already transparency aur open markets ki narrative ko push kar rahe hain.
Prediction markets unhi innovations ka ek major extension ban chuke hain jahan information aur public sentiment directly tradable form mein appear hota hai.
Financial innovation aur regulation ke darmiyan balance establish karna future digital economy ke liye bohot critical hoga.
Trump ka latest support statement isi evolving conversation ka ek important milestone ban gaya hai. Ab market participants ki nazrein is baat par hongi ke US regulators future mein kis direction mein move karte hain aur prediction market industry ko kitni operational freedom milti hai.
#Trump #CFTC #PredictionMarkets
  • Reward
  • Comment
  • Repost
  • Share
#GatePredictionMarketAddsSmartMoneyTracking #GatePredictionMarketAddsSmartMoneyTracking
The crypto industry is rapidly evolving, and prediction markets are no longer just speculation platforms but have become real-time market intelligence hubs.
Taking this innovation to the next level, Gate.io has introduced a powerful upgrade to its Prediction Market feature.
The new Smart Money Tracking feature has now been officially integrated into App v8.20, allowing users to monitor market behavior and top traders' activity more effectively than before.
The concept of prediction markets has already becom
View Original
2In1
#GatePredictionMarketAddsSmartMoneyTracking #GatePredictionMarketAddsSmartMoneyTracking
Crypto industry rapidly evolve ho rahi hai aur prediction markets ab sirf speculation platforms nahi rahe, balke real-time market intelligence hubs ban chuke hain.
Isi innovation ko next level par le jaate hue Gate.io ne apne Prediction Market feature mein ek powerful upgrade introduce kar diya hai.
New Smart Money Tracking feature ab officially App v8.20 mein integrate kar diya gaya hai, jo users ko market behavior aur top traders ki activity ko pehle se zyada effectively monitor karne ka moka dega.
Prediction markets ka concept already crypto community mein bohot popular ho chuka hai kyunki yahan users real-world events, crypto trends, macroeconomic developments aur political outcomes par positions le sakte hain.
Lekin ab Smart Money Tracking ke add hone se experience aur bhi advanced ho gaya hai.
Is feature ka main focus ye hai ke users market mein influential participants aur high-performing traders ki movement ko analyze kar sakein.
Financial markets mein “smart money” term usually un experienced investors aur institutions ke liye use hoti hai jo strong research, timing aur strategy ke basis par decisions lete hain.
Jab ordinary traders in activities ko observe karte hain to unhe market sentiment aur possible trend direction samajhne mein help milti hai.
Gate Prediction Market ka latest upgrade isi concept ko accessible aur transparent banane ki taraf ek major step hai.
App v8.20 ke integration ke baad users ab prediction market activities ko deeper insights ke sath explore kar sakte hain.
Ye feature especially un traders ke liye valuable ho sakta hai jo sirf random speculation ke bajaye data-driven decisions lena chahte hain.
Market trends ko samajhna, whale activity observe karna aur top-performing positions analyze karna trading strategies ko improve karne mein important role play karta hai.
Crypto ecosystem mein competition rapidly increase ho raha hai aur exchanges continuously innovative tools launch kar rahe hain taake users ko better trading experience mil sake.
Gate ka ye upgrade clearly show karta hai ke prediction markets future digital finance ka ek important segment banne wale hain.
Smart analytics aur transparent tracking features users ko sirf participation hi nahi, balke smarter decision-making ki power bhi dete hain.
Prediction markets ka future bohot strong nazar aa raha hai, especially jab AI analytics, blockchain transparency aur real-time sentiment tracking jaisi technologies continuously improve ho rahi hain.
Gate Prediction Market ka ye latest feature upgrade industry ke ongoing evolution ko reflect karta hai jahan information aur strategy dono equally important ban chuke hain.
Crypto traders aur market enthusiasts ke liye ye ek exciting development hai jo prediction-based trading ko aur zyada intelligent, competitive aur data-focused banata hai.
#Gateio #PredictionMarket
  • Reward
  • 2
  • Repost
  • Share
Vortex_King:
2026 GOGOGO 👊
View More
#MicronMarketCapBreaks1Trillion
The impact of the AI revolution in the global tech market is now clearly visible, and semiconductor companies are becoming the biggest beneficiaries of this wave.
On May 26, Micron Technology surprised the market with a massive rally record, where the company's shares surged by 19.3% and market capitalization crossed the psychological level of 1 trillion US dollars for the first time.
This development is considered a historic milestone for the semiconductor industry.
The rapidly growing demand for artificial intelligence, cloud c
MU-2.84%
View Original
2In1
#MicronMarketCapBreaks1Trillion
Global tech market mein AI revolution ka impact ab clearly nazar aane laga hai aur semiconductor companies iss wave ki sabse badi beneficiaries ban rahi hain.
May 26 ko Micron Technology ne market ko surprise karte hue massive rally record ki, jahan company ke shares 19.3% surge kar gaye aur market capitalization pehli baar 1 trillion US dollars ke psychological level ko cross kar gaya.
Ye development semiconductor industry ke liye ek historic milestone mana ja raha hai.
Artificial Intelligence, cloud computing aur high-performance data infrastructure ki rapidly growing demand ne memory chip manufacturers ko spotlight mein la diya hai.
Micron ka strong performance is baat ka clear signal hai ke investors AI-driven hardware ecosystem par aggressively bullish hote ja rahe hain.
Data centers, AI models aur next-generation computing systems ko powerful memory solutions ki zarurat hoti hai, aur Micron isi sector ka ek major player hai.
Recent months mein AI adoption unprecedented speed se increase hui hai.
Large language models, machine learning platforms aur enterprise AI systems continuously zyada computing power demand kar rahe hain.
Is ecosystem mein memory chips aur storage technology ka role critical hota hai.
Investors believe karte hain ke future digital economy heavily semiconductor infrastructure par depend karegi, isi liye Micron jaisi companies ke valuations rapidly expand ho rahe hain.
19.3% ka single-day surge sirf ek normal rally nahi, balke market confidence ka strong indicator hai.
Jab koi company trillion-dollar valuation achieve karti hai to wo sirf financial success nahi hota, balke industry influence aur long-term growth expectations ka symbol bhi ban jata hai.
Is move ne semiconductor sector ko phir se Wall Street ka center of attention bana diya hai.
AI boom ki wajah se already multiple chipmakers extraordinary growth dekh chuke hain, lekin Micron ka latest breakout especially important mana ja raha hai kyunki memory and storage segment ko traditionally cyclical industry samjha jata tha.
Ab market perception change hota nazar aa raha hai jahan AI demand long-term structural growth create kar rahi hai.
Crypto aur blockchain sectors ke traders bhi semiconductor industry ko closely monitor karte hain kyunki high-performance computing aur advanced hardware digital economy ka backbone ban chuke hain.
AI infrastructure growth indirectly cloud services, decentralized systems aur emerging technologies ko bhi support karti hai.
Micron ki trillion-dollar achievement ek clear reminder hai ke AI race ab sirf software tak limited nahi rahi.
Hardware companies bhi is technological revolution ki biggest winners ban rahi hain. Investors ab aggressively un sectors ko target kar rahe hain jo AI-powered future ko fuel kar sakte hain.
#Micron #AI #Semiconductor
  • Reward
  • 2
  • Repost
  • Share
Vortex_King:
2026 GOGOGO 👊
View More
#TradeCFDWinGold
The combination of trading and rewards has always been exciting for traders, but now Gate.io has taken this excitement to the next level by officially launching Gate CFD Gold Lucky Draw Season 5.
This campaign has generated massive attention in the crypto and CFD trading community because this time, rewards are not limited to bonuses or trading credits but have reached real gold.
The most attractive feature of Season 5 is that every 10 minutes, one lucky user is rewarded with 2 grams of gold. That means, along with trading activity, participants are also getting continuous wi
XAU0.07%
View Original
2In1
#TradeCFDWinGold
Trading aur rewards ka combination hamesha traders ke liye exciting raha hai, lekin ab Gate.io ne is excitement ko next level par le jaate hue Gate CFD Gold Lucky Draw Season 5 officially launch kar diya hai.
Is campaign ne crypto aur CFD trading community mein massive attention create kar di hai kyunki is baar rewards sirf bonuses ya trading credits tak limited nahi, balke asli gold tak pahunch chuke hain.
Season 5 ka sabse attractive feature ye hai ke har 10 minutes mein ek lucky user ko 2 grams gold reward diya ja raha hai. Yani trading activity ke sath-sath participants ko continuous winning opportunities bhi mil rahi hain.
Ye campaign traders ko sirf market participation ka chance nahi deta, balke unki activity ko real-world valuable rewards mein convert karne ka unique experience bhi provide karta hai.
CFD trading already global financial markets mein rapidly popular ho rahi hai kyunki ye users ko rising aur falling dono markets se profit opportunities capture karne ki flexibility deti hai.
Crypto volatility aur fast-moving markets ki wajah se CFD products ab traders ke liye powerful tools ban chuke hain. Gate ka latest lucky draw campaign isi growing trading ecosystem ko aur zyada engaging aur competitive bana raha hai.
Gold historically wealth preservation aur financial stability ka symbol mana jata hai.
Is liye jab trading rewards directly gold ki form mein diye jaate hain to campaign ki value aur excitement naturally increase ho jati hai.
Har 10 minute mein winner announce hone ka concept users ke andar continuous anticipation create karta hai, jis se overall participation aur activity aur bhi zyada energetic ban jati hai.
Crypto exchanges ke darmiyan competition rapidly intensify ho raha hai aur platforms continuously innovative campaigns launch kar rahe hain taake users ko better engagement aur stronger incentives mil sakein.
Gate CFD Gold Lucky Draw Season 5 clearly show karta hai ke modern trading platforms sirf trading execution tak limited nahi rahe, balke entertainment, rewards aur community engagement ko bhi equally important bana rahe hain.
Market volatility ke current environment mein disciplined trading aur strategic decision-making bohot important hai.
Aise campaigns traders ko active participation ke sath additional motivation bhi provide karte hain. Chahe aap experienced CFD trader hon ya market mein naye enter kar rahe hon, ye event ek exciting opportunity ban chuka hai jahan skill aur luck dono role play kar sakte hain.
Digital finance aur traditional assets ka combination future financial ecosystem ko redefine kar raha hai. Crypto trading ke sath real gold rewards ka concept isi transformation ki ek strong example hai jo traders ko modern aur tangible value dono ek sath offer karta hai.
#TradeCFDWinGold #Gateio
  • Reward
  • 2
  • Repost
  • Share
Vortex_King:
2026 GOGOGO 👊
View More
#SocialFiSectorUp5.9%
What the SocialFi Sector Represents
SocialFi, or Social Finance, is an evolving blockchain-based ecosystem where social media and decentralized finance merge into a single digital economy, allowing users to own their identity, monetize engagement, and participate in governance systems that replace centralized control with community-driven decision making, while transforming attention, content, and influence into tokenized financial value across multiple chains including Ethereum, Base, and TON.
Traditional social platforms extract value from user-generated content throu
HighAmbition
#SocialFiSectorUp5.9%
What the SocialFi Sector Represents
SocialFi, or Social Finance, is an evolving blockchain-based ecosystem where social media and decentralized finance merge into a single digital economy, allowing users to own their identity, monetize engagement, and participate in governance systems that replace centralized control with community-driven decision making, while transforming attention, content, and influence into tokenized financial value across multiple chains including Ethereum, Base, and TON.
Traditional social platforms extract value from user-generated content through advertising-driven models, whereas SocialFi reverses this structure by enabling direct creator monetization through tokens, NFTs, tipping systems, and staking mechanisms, creating a digital environment where engagement itself becomes an economic asset rather than a free input for corporate profit generation.
Understanding SocialFi — Core Structural Breakdown
The SocialFi ecosystem is built on blockchain architecture that integrates ownership, incentives, and governance into a unified framework where every social action can carry financial meaning, and where wallets act as identity layers connecting users across platforms without centralized intermediaries controlling data or access.
The system operates through three foundational layers including digital ownership via wallets, tokenized incentives for engagement, and DAO-based governance where communities collectively control upgrades and ecosystem decisions, creating a self-sustaining digital economy that rewards participation at every level.
Key components include social tokens that represent influence or community power, NFTs that represent content ownership and digital identity, DeFi modules that enable staking and yield generation, and governance systems where token holders vote on funding allocation, feature development, and protocol evolution, forming a complete financialized social infrastructure.
Market Size and Structural Growth Outlook
The SocialFi sector continues to show steady expansion, with global projections estimating the market reaching approximately 1.07 billion USD in 2026 and potentially expanding beyond 4.01 billion USD by 2035, representing long-term growth driven by decentralized identity systems, creator economy adoption, and blockchain-based social engagement tools.
Current combined SocialFi market capitalization ranges between 1.4 billion USD and 2.5 billion USD depending on market cycles, liquidity conditions, and narrative strength, while daily trading volumes fluctuate between 80 million USD and 600 million USD during active volatility phases, reflecting strong but uneven capital rotation across tokens.
Current Sector Performance — The 5.9% Rally
The recent 5.9% sector increase reflects renewed momentum across SocialFi assets, driven by narrative rotation, infrastructure upgrades, and renewed speculative inflows into previously underperforming thematic categories, as capital shifts away from saturated AI and meme narratives toward utility-driven blockchain ecosystems.
A major catalyst is the resurgence of infrastructure development, particularly with projects like Lens Chain expanding decentralized social graph capabilities through Layer 2 scaling solutions, zero-knowledge architecture, and high-performance data availability layers, enabling SocialFi applications to support large-scale user activity without congestion limitations.
Another key driver is TON ecosystem expansion, where Toncoin continues to act as the dominant SocialFi-linked asset due to its integration with Telegram’s massive user base exceeding 900 million users, making it one of the strongest distribution channels in the entire crypto ecosystem and significantly influencing sector-wide price movement.
Top SocialFi Tokens — Prices, Market Caps & Expanded Market Data
Toncoin (TON) remains the leading SocialFi infrastructure asset, trading approximately between 1.85 USD and 2.10 USD, with historical upside expectations reaching 3.00 USD in mid-term scenarios and potential long-term expansion toward 5.00–10.00 USD depending on Telegram ecosystem adoption and global payment integration.
CyberConnect (CYBER) trades around 0.47 USD with a market capitalization near 31–40 million USD, representing decentralized social graph infrastructure that connects identities across Web3 platforms, with potential upside projections ranging between 0.75 USD and 1.20 USD under strong adoption cycles.
Pump.fun (PUMP) trades around 0.0018–0.0021 USD with a market cap between 600 million USD and 700 million USD, serving as a social token launchpad ecosystem that enables rapid creation and trading of community-driven assets, heavily influenced by meme cycles and retail participation trends.
Zora (ZORA) trades near 0.011–0.015 USD with a market capitalization of approximately 45–55 million USD, focusing on NFT-based social content monetization and creator economy tools that bridge digital art with decentralized social engagement models.
LimeWire Token (LMWR) trades around 0.018–0.025 USD with smaller market capitalization levels, representing content distribution and entertainment-focused SocialFi infrastructure, while Kin (KIN) trades at extremely low fractional levels near 0.00000060–0.00000070 USD, operating as a micro-payment social ecosystem token.
Additional emerging SocialFi-related tokens across Base, Ethereum, and TON ecosystems include fluctuating valuations ranging from micro-cap projects under 10 million USD to mid-cap ecosystems exceeding 100 million USD during short-term narrative surges, contributing to fragmented but highly active liquidity distribution.
Overall, the total SocialFi sector valuation remains between 1.4 billion USD and 2.5 billion USD, with periodic spikes driven by narrative cycles and exchange activity surges.
Price Forecasts — Expanded Market Scenarios
Short-term outlook suggests potential additional upside of 10% to 30% if Bitcoin stability continues and capital rotation into thematic sectors remains active, with individual tokens like TON potentially testing 2.50–3.20 USD ranges during momentum phases.
Medium-term projections for 2026 indicate possible sector expansion toward 3.0–5.5 billion USD in total market capitalization, driven by increased user adoption, infrastructure maturity, and integration of SocialFi features into mainstream applications, with TON potentially reaching 2.80–3.50 USD and CYBER moving toward 0.80–1.20 USD in strong adoption conditions.
Long-term projections extending toward 2030 suggest that if SocialFi achieves mainstream adoption through platforms like Telegram or similar mass-user ecosystems, TON could potentially reach 5.00–10.00 USD, while smaller tokens could experience exponential upside or complete market exit depending on execution quality and user retention.
However, downside risks remain significant, as historical cycles show that SocialFi tokens often experience sharp corrections after incentive-driven engagement slows, leading to prolonged consolidation or structural decline in weaker ecosystems.
Narrative Cycle Position — Market Phase Analysis
The SocialFi sector is currently positioned in a transitional phase between early accumulation and breakout expansion, where attention is increasing but has not yet reached peak retail-driven speculation, indicating that the sector is still forming structural momentum rather than experiencing full hype conditions.
Market behavior reflects selective participation from retail traders and early institutional positioning, alongside increasing developer activity and multi-chain ecosystem launches, suggesting that SocialFi is gradually entering a higher momentum phase supported by real infrastructure development.
Trading Strategies — Market Approach Framework
Conservative accumulation strategies focus on high-conviction infrastructure assets such as TON and CYBER, with gradual entry over extended periods, controlled portfolio allocation between 5% and 8%, and disciplined profit-taking in the range of 15% to 50% depending on market capitalization and volatility conditions.
Momentum trading strategies focus on breakout movements triggered by ecosystem announcements, volume spikes, or narrative shifts, typically holding positions for 1 to 4 weeks while applying strict trailing stop-loss systems to protect capital during volatility cycles.
Long-term infrastructure strategies prioritize TON due to its unmatched integration with Telegram’s 900+ million users, creating a unique adoption pathway that positions it as a potential backbone of future SocialFi infrastructure if ecosystem expansion continues successfully.
Key Risks and Market Challenges
SocialFi remains highly volatile due to incentive-based user behavior, where token rewards attract short-term participants who exit once incentives decline, creating repeated boom-and-bust cycles across multiple project generations and limiting long-term stability in weaker ecosystems.
Additional risks include competition from centralized social platforms integrating Web3-like features, regulatory uncertainty surrounding tokenized social economies, liquidity fragmentation across multiple chains, and rapid narrative rotation that can shift capital away from the sector quickly.
Final Conclusion — SocialFi Sector Outlook
The recent 5.9% gain reflects early-stage revival supported by infrastructure expansion, narrative rotation, and TON-driven ecosystem strength, positioning SocialFi as one of the most dynamic but high-risk sectors in the 2026 crypto landscape.
While short-term momentum suggests continued upside potential, long-term success depends entirely on real user adoption, sustainable monetization models, and the ability of platforms to retain users beyond speculative incentives, making disciplined positioning and infrastructure-focused investment the most rational approach in the current environment.
Overall, SocialFi represents a rapidly evolving sector with strong upside potential but equally significant execution risks, requiring careful strategy, timing discipline, and structured risk management for meaningful participation.@Gate_Square @Gate广场_Official #StockTradingChallengeUpTo17000U #TradeCFDWinGold #DailyPolymarketHotspot
repost-content-media
  • Reward
  • Comment
  • Repost
  • Share
#30YearTreasuryYieldBreaks5%
The 30-Year Treasury Yield Above 5% And The Beginning Of A Global Macro Regime Shift
The United States 30-year Treasury yield moving above the critical 5 percent threshold and stabilizing in the $5.15 percent to $5.19 percent range represents one of the most significant macroeconomic regime shifts since the pre-2007 financial cycle. This is not a short-term volatility spike. It is a structural repricing of global capital that signals the end of the ultra-cheap money era and the beginning of a permanently higher cost of capital environment.
The entire yield curve c
NG1.84%
BTC-0.56%
ETH-1.29%
SOL-1.57%
HighAmbition
#30YearTreasuryYieldBreaks5%
The 30-Year Treasury Yield Above 5% And The Beginning Of A Global Macro Regime Shift
The United States 30-year Treasury yield moving above the critical 5 percent threshold and stabilizing in the $5.15 percent to $5.19 percent range represents one of the most significant macroeconomic regime shifts since the pre-2007 financial cycle. This is not a short-term volatility spike. It is a structural repricing of global capital that signals the end of the ultra-cheap money era and the beginning of a permanently higher cost of capital environment.
The entire yield curve confirms this shift. The 10-year Treasury near $4.65 percent and the 2-year near $4.12 percent show that markets are pricing persistent inflation, heavy sovereign debt supply, and structurally tighter liquidity conditions across the global economy. Long-duration money is no longer cheap, stable, or predictable.
Global Sovereign Bond Markets Enter A Synchronized Duration Shock
This movement is not isolated to the United States. It is global.
The UK 30-year gilt is near $5.8–$5.9 percent, Germany is at multi-year yield highs, and Japan’s yield structure is breaking decades of ultra-low stability.
This reflects a synchronized global duration shock driven by:
Persistent inflation pressure
Expanding fiscal deficits
Rising sovereign debt issuance
Geopolitical instability
Bond markets are no longer controlled purely by central bank suppression. They are now driven by real market pricing of risk, inflation, and debt sustainability.
Iran Conflict And Energy Shock Are Amplifying Inflation Pressure
Geopolitical tension around Iran and disruptions in the Strait of Hormuz are reinforcing global inflation trends.
Oil remains in the $105–$118 range, while natural gas volatility continues due to supply uncertainty. This energy shock is now the primary transmission channel for inflation.
CPI inflation: ~$3.8 percent YoY
PPI inflation: ~$6 percent
This confirms inflation is not fading—it is evolving into a second wave driven by energy, logistics, and wage rigidity.
Meanwhile, US federal debt exceeds $36.8 trillion, with annual interest costs approaching $952 billion, creating a compounding fiscal pressure loop where higher yields generate even more debt issuance.
Why A 5 Percent Yield Changes Everything For Bitcoin And Risk Assets
A 30-year yield above 5 percent is a global capital allocation reset.
Investors can now earn ~$5 percent risk-free returns from sovereign bonds. This dramatically increases the opportunity cost of holding non-yielding assets like Bitcoin.
The previous cycle was defined by:
Zero interest rates
Excess liquidity
Cheap leverage
That environment no longer exists.
Now:
Fixed income offers attractive returns
Volatility is lower in bonds
Institutional capital rotates toward safety
This is already visible:
Slower ETF inflows into Bitcoin
Reduced risk appetite in derivatives markets
Increasing sensitivity to liquidity tightening
At the same time, higher yields strengthen the US dollar, which historically creates headwinds for Bitcoin and risk assets.
Bitcoin Market Structure Under Macro Pressure
Bitcoin is currently trading in the $74,000–$76,000 range after repeated rejection near $78,000–$80,000.
From its $126,000 cycle high, BTC has corrected nearly 39 percent, reflecting macro-driven liquidity contraction rather than internal structural failure.
This is not panic selling. It is controlled institutional distribution.
Bitcoin remains fundamentally strong due to:
ETF adoption
Fixed supply model
Halving cycle dynamics
Long-term sovereign debt concerns
But short-term behavior is fully dominated by macro liquidity conditions.
Current Market Snapshot
BTC Price: $74,000–$76,000
ATH: $126,000
Drawdown: ~39 percent
Market Cap: ~$1.5 trillion
Altcoins remain heavily compressed:
Ethereum: ~$4,000–$4,200
Solana: below major resistance near $210
Broad altcoin market: down 50–80 percent
Technical Structure And Key Levels
Bitcoin remains in a transitional phase with no confirmed macro reversal.
Bearish momentum dominates the 4H structure, while the daily chart shows price below major moving averages.
Support Zones:
$73,000–$74,000 → primary liquidity base
$70,000–$72,000 → institutional accumulation zone
$65,000 → macro stress extension zone
Resistance Zones:
$75,700 → immediate supply barrier
$77,600 → structural rejection zone
$79,800 → macro trend reversal trigger
$85,000 → breakout confirmation
Bitcoin Scenarios Based On Treasury Yields
If Yields Rise To $5.3–$5.5 Percent:
BTC retests $73,000–$74,000
Potential extension toward $70,000–$72,000
Extreme stress scenario: $65,000
If Yields Stabilize Near $5 Percent:
BTC consolidates in $73,000–$80,000 range
Range-bound volatility continues
If Yields Fall Below $4.8 Percent:
Liquidity returns
BTC recovery toward $80,000–$85,000+
Long-term models still project $120,000–$200,000 potential over the broader cycle if adoption and debt dynamics continue.
Why Bitcoin Reacts To Yields
Higher yields increase risk-free returns, reducing demand for volatile assets. They also tighten liquidity, reduce leverage, and strengthen the dollar.
However, structurally rising sovereign debt may eventually weaken trust in fiat systems, reinforcing Bitcoin’s long-term narrative as a non-sovereign monetary hedge.
Trading Strategy In A Macro-Dominated Environment
This is a capital preservation phase, not a leverage phase.
Accumulation Strategy:
Primary zone: $73,000–$76,000
Deep zone: $70,000–$72,000
Extreme opportunity: ~$65,000
Risk Management:
Avoid leverage
Prioritize spot exposure
Track Treasury yields daily (5%–5.3% zone is critical)
Monitor oil, inflation, and Fed policy
Aggressive bullish positioning only becomes valid if BTC reclaims $77,600–$80,000 with strong confirmation.
Final Conclusion
The 30-year Treasury yield breaking above 5 percent represents a historic global macro reset that is reshaping capital flows across every asset class.
Higher yields compress liquidity, strengthen fixed-income appeal, and reduce risk appetite across speculative markets including cryptocurrencies.
Bitcoin is not structurally broken. It is reacting to a global liquidity transition where bond markets currently dominate price discovery across financial systems.
The most important variable going forward remains the $5 percent to $5.3 percent yield zone. Stability or decline would unlock liquidity and upside potential, while further increases toward $5.5 percent or $6 percent would deepen macro pressure across all risk assets.
In essence, Bitcoin is not in a structural downtrend. It is in a macro liquidity cycle controlled by global bond markets.
@Gate_Square @Gate广场_Official #TradfiTradingChallenge
repost-content-media
  • Reward
  • 2
  • Repost
  • Share
HighAmbition:
2026 GOGOGO 👊
View More
#WarshSwornInAsFedChair
The Federal Reserve has officially entered one of the most consequential monetary chapters in modern financial history — and global markets, especially crypto, are already being violently repriced in real time.
On May 22, 2026, Kevin Warsh was sworn in as the 17th Chairman of the Federal Reserve, replacing Jerome Powell during a period of extreme macro instability that now resembles a hybrid of inflation shock, energy crisis, and liquidity tightening simultaneously. The ceremony was held at the White House in the East Room with President Donald Trump presiding, and Sup
HighAmbition
#WarshSwornInAsFedChair
The Federal Reserve has officially entered one of the most consequential monetary chapters in modern financial history — and global markets, especially crypto, are already being violently repriced in real time.
On May 22, 2026, Kevin Warsh was sworn in as the 17th Chairman of the Federal Reserve, replacing Jerome Powell during a period of extreme macro instability that now resembles a hybrid of inflation shock, energy crisis, and liquidity tightening simultaneously. The ceremony was held at the White House in the East Room with President Donald Trump presiding, and Supreme Court Justice Clarence Thomas administering the oath — a highly unusual setting that immediately sparked debate about central bank independence and whether political influence over monetary policy is entering a new phase.
The reaction across global markets was immediate, sharp, and deeply risk-off.
Bitcoin dropped violently from approximately $81,650 → $74,000–$76,000, marking a drawdown of nearly -8% to -10% within days, while triggering more than $430M–$580M in leveraged liquidations across derivatives markets. Ethereum fell roughly -7% to -11%, slipping below key support clusters near $3,850, while Solana experienced an aggressive retracement of nearly -10% to -15%, falling toward the $158–$162 zone. The total crypto market capitalization shed hundreds of billions in valuation within a short time window as traders rapidly recalibrated expectations for liquidity conditions, interest-rate policy, and global risk appetite.
This is not just another Federal Reserve transition.
This is a structural macro regime shift that may define the entire 2026 crypto cycle.
KEVIN WARSH ERA — THE START OF A MONETARY REPRICING CYCLE
Kevin Warsh enters the Federal Reserve with a strongly reform-driven monetary philosophy that immediately alters how markets interpret future liquidity flows.
Warsh is widely associated with a framework that prioritizes:
• Shrinking the Federal Reserve balance sheet from multi-trillion-dollar levels
• Reducing long-term dependence on quantitative easing
• Restoring market-driven price discovery in interest rates
• Limiting emergency liquidity interventions
• Rebuilding inflation credibility at any cost
This is critical because markets over the last decade have been structurally conditioned to assume one thing:
“The Fed will always intervene to support risk assets.”
Warsh’s policy direction challenges that assumption directly.
And when that belief breaks, liquidity repricing begins immediately across all high-beta markets — especially crypto.
MACRO CONDITIONS WARSH INHERITS — EXTREME SYSTEM PRESSURE
Warsh is stepping into a macro environment that is already under severe structural strain:
US CPI Inflation: ~3.8% and trending upward again
Core inflation persistence: broad-based pricing pressure returning
Oil prices: ~$115 per barrel due to geopolitical escalation and supply disruptions
Consumer sentiment: collapsed near 44.8 (historic lows)
Inflation expectations: ~4.8% forward outlook
30-year Treasury yields: above 5.0% (multi-decade highs)
10-year yields: persistent upward pressure
This combination is highly dangerous because it creates a textbook stagflation risk environment:
• Slowing economic expansion
• Weak consumer demand
• Persistent inflation pressure
• Elevated energy costs
• Tight financial conditions
• Rising borrowing costs
This is the worst possible macro mix for speculative assets like:
Bitcoin, Ethereum, Solana, altcoins, AI tokens, venture-backed crypto infrastructure, and high-leverage derivatives markets.
Because in this environment:
👉 Liquidity contracts
👉 Discount rates rise
👉 Risk premiums expand
👉 Speculation gets repriced aggressively
BOND MARKET REPRICING — THE MOST IMPORTANT SIGNAL
One of the most significant reactions following Warsh’s appointment was the rapid shift in Treasury market expectations.
Before Warsh: Markets were pricing potential easing cycles in late 2026.
After Warsh: Markets aggressively shifted toward:
• Near-zero probability of near-term rate cuts
• Higher-for-longer interest rate regime
• Possible additional tightening cycles
• Reduced expectation of liquidity expansion
This immediately pushed Treasury yields higher and strengthened the dollar environment — both historically negative conditions for crypto performance.
Because Bitcoin’s strongest historical bull phases occur during:
• Liquidity expansion cycles
• Falling real yields
• Aggressive central bank easing
• Weak dollar regimes
Warsh introduces the opposite macro signal.
BITCOIN CRASH MECHANICS — LIQUIDITY SHOCK IN REAL TIME
Bitcoin’s decline was not random — it was a direct macro repricing event.
BTC moved:
• May 15: ~$81,650 local peak
• May 22: ~$74,666 intraday low region
• Weekly drawdown: approximately -8% to -10.5%
Below $76,000, the market experienced a liquidation cascade:
• Estimated liquidations: $430M – $580M
• Long leverage unwinding accelerated volatility
• Funding rates collapsed sharply
• Open interest dropped significantly
This confirms a critical structural insight:
👉 The current crypto market is leverage-driven, not spot-driven.
Which means macro shocks amplify instantly.
WHY ETHEREUM AND SOLANA MOVED EVEN HARDER
Ethereum and Solana experienced sharper volatility because they sit higher on the risk curve than Bitcoin.
ETH dropped from approximately $4,200 → $3,600–$3,850 range, reflecting:
• ETF flow sensitivity
• Staking regulatory uncertainty
• Institutional rotation out of risk
• Reduced liquidity appetite
ETH downside risk range now sits at:
• $3,850 → pivot resistance
• $3,600 → structural support
• $3,250 → correction zone
• $2,900 → macro liquidation zone
Estimated volatility bands: • Downside: -15% to -25% potential in stress cycles
• Upside rebound: +35% to +70% in liquidity recovery phases
Solana (SOL) saw even higher beta movement:
• $185 → recent cycle high
• Current range: $150–$162 zone
Key levels:
• $162 → short-term resistance pivot
• $150 → breakdown confirmation level
• $138 → major support
• $120 → macro flush region
Volatility profile:
• Downside: -20% to -35% in liquidity stress events
• Upside: +50% to +100% in expansion cycles
WARSH VS LIQUIDITY CYCLE — THE CORE CONFLICT
The key market conflict is now structural:
Warsh philosophy: • Reduce liquidity dependence
• Strengthen monetary discipline
• Reduce Fed intervention
Market dependency: • Crypto requires liquidity expansion
• Risk assets depend on falling yields
• Leverage requires cheap capital
This creates a direct structural mismatch.
And when macro policy shifts against liquidity-dependent assets:
👉 volatility increases
👉 correlation with bonds rises
👉 downside accelerates faster than upside
BITCOIN HISTORICAL FED TRANSITION PATTERN
Across previous Federal Reserve leadership cycles, Bitcoin has consistently experienced major drawdowns during transition or tightening phases:
• Yellen era cycle: Bitcoin drawdown ~80%+
• Powell tightening phase: BTC decline ~70%+
• Rate hike cycles: extreme volatility compression phases
The repeating pattern is not purely coincidental:
👉 New Fed regimes often coincide with liquidity resets
👉 Crypto is extremely sensitive to those resets
Warsh now enters the same structural cycle environment.
CRITICAL BITCOIN STRUCTURE — CURRENT MARKET MAP
Bitcoin is now trading in a macro-sensitive corridor:
Major support zones: • $74,000 → immediate defense level
• $72,500 → liquidity absorption zone
• $69,000 → breakdown confirmation
• $64,000 → macro correction level
• $58,000 → deep liquidation zone
Major resistance zones: • $78,000 → recovery rejection level
• $81,500 → structural pivot
• $85,000 → trend recovery confirmation
• $92,000 → bullish continuation zone
• $100,000 → psychological breakout barrier
If BTC loses $74K–$72K decisively:
👉 accelerated liquidation risk increases toward $69K → $64K → $58K
If macro stabilizes:
👉 BTC can recover toward $85K–$92K and retest $100K later in cycle
MACRO DRIVERS NOW CONTROLLING CRYPTO MARKETS
Crypto is no longer driven purely by internal narratives.
The dominant macro forces now include:
• Federal Reserve policy direction
• Treasury yield trajectory
• Inflation expectations
• Energy market shocks (oil above $115)
• Geopolitical risk (Middle East tensions)
• Dollar strength cycles
• Institutional ETF flows
• Global liquidity conditions
This shift means:
👉 crypto is now a macro asset class, not a standalone speculative market
THREE MAJOR BITCOIN SCENARIOS — EXTENDED
Bearish Liquidity Contraction Scenario
Probability: Elevated volatility continuation
BTC Range: $58K – $70K
Conditions: • Inflation persistence
• Higher yields
• QT continuation
• Weak risk appetite
Neutral Macro Consolidation Scenario
Probability: Base case
BTC Range: $72K – $92K
Conditions: • Fed pause
• Inflation stabilizes
• Controlled growth slowdown
Bullish Liquidity Re-Expansion Scenario
Probability: Cyclical expansion later phase
BTC Range: $100K – $150K+
Conditions: • Economic slowdown forces easing
• Liquidity returns
• Dollar weakens
• Risk appetite returns
FINAL CONCLUSION — A STRUCTURAL SHIFT IN GLOBAL MARKETS
Kevin Warsh’s arrival at the Federal Reserve represents far more than a political or administrative change.
It represents a potential transition in how global liquidity is managed.
And in financial markets:
👉 liquidity is everything
Bitcoin, Ethereum, and the entire crypto ecosystem are now fully embedded within:
• Central bank policy cycles
• Bond market dynamics
• Energy-driven inflation shocks
• Global geopolitical risk structures
• Institutional capital allocation flows
Warsh introduces a regime that prioritizes monetary discipline over market support.
That may create short-term pain across crypto markets.
But in the long term, if fiat systems remain under structural inflation pressure and debt expansion continues globally, Bitcoin’s role as a decentralized monetary hedge may become even more significant than in previous cycles.
The next phase is not just volatility.
It is macro regime re-pricing at global scale.@Gate_Square @Gate广场_Official
repost-content-media
  • Reward
  • Comment
  • Repost
  • Share
#GateSquarePizzaDay
🍕 Bitcoin Pizza Day 2026: The Most Expensive Meal in Financial History
May 22, 2026 | BTC Current Price: $76,745
The Origin: Two Pizzas That Changed the World
On May 22, 2010, a Florida-based programmer named Laszlo Hanyecz posted a simple offer on the Bitcointalk forum: "I'll pay 10,000 BTC for two large pizzas." At the time, 10,000 BTC was worth approximately $41 — roughly the price of two Papa John's pizzas delivered to his doorstep in Jacksonville.
A 19-year-old named Jeremy Sturdivant, going by the nickname "Jercos," saw the post, called Papa John's from California,
HighAmbition
#GateSquarePizzaDay
🍕 Bitcoin Pizza Day 2026: The Most Expensive Meal in Financial History
May 22, 2026 | BTC Current Price: $76,745
The Origin: Two Pizzas That Changed the World
On May 22, 2010, a Florida-based programmer named Laszlo Hanyecz posted a simple offer on the Bitcointalk forum: "I'll pay 10,000 BTC for two large pizzas." At the time, 10,000 BTC was worth approximately $41 — roughly the price of two Papa John's pizzas delivered to his doorstep in Jacksonville.
A 19-year-old named Jeremy Sturdivant, going by the nickname "Jercos," saw the post, called Papa John's from California, paid with his debit card, and had the pizzas shipped across the country. Laszlo sent him 10,000 BTC for the favor. The transaction was confirmed. The pizzas arrived. And history was made.
This was the first known real-world purchase using Bitcoin. It was the moment Bitcoin stopped being a theoretical internet experiment and became something tangible — a currency that could buy actual goods in the physical world. That single transaction proved Bitcoin had real-world utility, and it would go on to spark one of the greatest financial revolutions in modern history.
The Price Journey: From $0.004 to $76,745
The sheer magnitude of Bitcoin's price appreciation over the past 16 years is staggering. Here is BTC's price trajectory through Pizza Day each year:
Year BTC Price (Pizza Day) 10,000 BTC Value
2010 $0.004 ~$41
2011 $6.12 ~$61,200
2012 $5.10 ~$51,000
2013 $123 ~$1.23M
2014 $523 ~$5.23M
2015 $241 ~$2.41M
2016 $439 ~$4.39M
2017 $2,109 ~$21.09M
2018 $8,355 ~$83.55M
2019 $7,958 ~$79.58M
2020 $9,060 ~$90.60M
2021 $37,340 ~$373.4M
2022 $29,492 ~$294.92M
2023 $26,774 ~$267.74M
2024 $70,190 ~$701.9M
2025 $110,568 ~$1.1B
2026 $76,745 ~$767.45M
At today's price of $76,745, those two pizzas would be worth roughly $767 million. From a $41 meal to a three-quarter-billion-dollar milestone — that is a return of approximately 18,726,000% over 16 years.
The Untold Story: Laszlo Hanyecz's Bigger Contributions
Most people know Pizza Day as the tale of "the guy who spent a billion dollars on pizza." But what most people miss is that Laszlo Hanyecz had already made far more significant contributions to Bitcoin before he ever ordered those pizzas.
The macOS Client: In April 2010, when Bitcoin was still just code on Windows and Linux, Hanyecz built the first macOS client for Bitcoin Core. Satoshi had only created versions for Windows and Linux. Hanyecz's work opened the door for Mac users to participate, and every macOS Bitcoin wallet in existence today traces back to that contribution.
GPU Mining Discovery: Weeks later, Hanyecz realized you could mine Bitcoin using graphics cards (GPUs) instead of CPUs. On May 10, 2010, he posted about using NVIDIA cards to mine Bitcoin, effectively igniting the first mining revolution. Bitcoin's hashrate surged 130,000% by the end of that year. This was the origin story of Bitcoin mining as we know it today — basement rigs, garage setups, and eventually industrial-scale mining farms.
Satoshi's Concern: Satoshi Nakamoto himself reached out to Hanyecz about GPU mining, worried it would concentrate coins too quickly and discourage CPU-only users. This conversation apparently troubled Hanyecz, who felt he had disrupted Bitcoin's early egalitarian spirit.
The Deeper Meaning of Pizza Day: Perhaps Hanyecz's famous pizza offer wasn't just about food. Maybe it was a form of atonement — a statement that Bitcoin should circulate, be used for real things, not just hoarded. Between April and November 2010, Hanyecz received and spent approximately 81,432 BTC — worth roughly $6.2 billion at today's prices. Whether he spent it all on pizza, gave it away to newcomers, or both, nobody knows for certain.
Jeremy Sturdivant: The Other Side of the Pizza
Jeremy Sturdivant, the teenager who facilitated the pizza delivery, sold those 10,000 BTC shortly after receiving them — reportedly to fund a trip with his girlfriend. If he had held, those coins would be worth roughly $770 million today.
Years later, Jeremy admitted he regrets selling. But his framing is surprisingly mature: he's not bitter about the lost fortune. Instead, he speaks about being proud to have participated in something that evolved from a niche project into a global phenomenon. He was just helping out. "It seemed fair to both parties, and well, who doesn't like pizza?" he said in an interview.
Laszlo shares a similar perspective: "I mined that Bitcoin and at the time it was like I was getting free food. I wouldn't have spent $100 million on pizza, right? But if I hadn't done that, maybe Bitcoin wouldn't have become so popular."
What Pizza Day Really Means for Crypto
Beyond the memes and the "what-if" regret, Bitcoin Pizza Day carries profound significance for the crypto community:
1. Proof of Real-World Utility
Those two pizzas were the first proof that Bitcoin could function as actual currency — not just a digital curiosity. The transaction demonstrated that a decentralized, peer-to-peer currency could facilitate real commerce between strangers across the internet.
2. The Power of Early Experimentation
Early adopters like Hanyecz were not waiting for Bitcoin to "moon." They were using it, spending it, testing it, and making it real. Pizza Day is a reminder that innovation requires people willing to experiment — even when the outcome is uncertain.
3. Small Moments Become Legendary
Nobody knew those pizzas would become historic. Nobody knew Bitcoin would become a trillion-dollar asset class. Nobody knew blockchain technology would disrupt industries worldwide. Yet here we are. And right now, somewhere in the crypto space, another "small moment" may be unfolding that people will laugh at today but celebrate decades later.
4. The Irony of Crypto Culture
Pizza Day also captures the humor of crypto culture — the same people who once dismissed Bitcoin are now asking "Is it too late to buy?" One green candle and everyone becomes a professional analyst. One red candle and suddenly everyone believes in "long-term investing." This emotional rollercoaster is now part of the blockchain experience.
BTC at $76,745: Where We Stand Today
As of Pizza Day 2026, Bitcoin trades at $76,745. While the price has seen significant swings — from the highs above $110,000 in 2025 to the current level — Bitcoin has firmly established itself as a global financial asset. Key developments shaping the current landscape include:
Institutional adoption: Major financial institutions, asset managers, and corporations now hold BTC on their balance sheets
ETF integration: Bitcoin ETFs have brought mainstream exposure to crypto assets
Regulatory clarity: Growing regulatory frameworks worldwide are providing structure for crypto markets
Layer 2 scaling: Advances in Lightning Network and other Layer 2 solutions are making Bitcoin transactions faster and cheaper
AI + Crypto convergence: The intersection of artificial intelligence and blockchain technology is creating new possibilities for decentralized applications
From an internet experiment mocked by outsiders to a trillion-dollar movement celebrated globally — Bitcoin's journey from two pizzas to institutional adoption is arguably the most extraordinary financial story of the 21st century.
The Community Celebration
The crypto community marks Pizza Day each year with events, memes, reflections, and gatherings across exchanges and social platforms. Gate Square has been buzzing with Pizza Day content — stories, artwork, memes, and trading screenshots flooding the platform as users celebrate this iconic moment in Bitcoin history.
Community posts on Gate Square highlight the enduring cultural impact of Pizza Day, from nostalgic reflections on Bitcoin's humble beginnings to memes about the "most expensive meal ever." The celebration is not just about regret — it is about honoring the spirit of experimentation, risk-taking, and belief in decentralized technology that has defined crypto from the very beginning.
The Lesson: Innovation Always Looks Ridiculous Before It Changes the World
Pizza Day's deepest lesson is this: the future always looks ridiculous before it changes the world. Bitcoin was dismissed as a hacker's toy. Cryptocurrency was called a bubble. Blockchain was labeled a fad. Yet from two pizzas worth $41, an entire financial revolution was born.
Whether you are a trader, holder, developer, or simply curious about crypto — Pizza Day is a reminder that participation matters. The early builders didn't wait for certainty. They experimented. They spent. They built. And occasionally, they bought pizza.
Happy Bitcoin Pizza Day 2026. 🍕@Gate_Square @Gate广场_Official #GateSquarePizzaDay
repost-content-media
  • Reward
  • Comment
  • Repost
  • Share
  • Pinned