GateUser-4492b407

vip
On-chain Analyst
Diamond Hands
Airdrop Hunter
No content yet
#GENIUS
#StockTradingChallengeUpTo17000U
Airdrop Strategy
Price Impact
Holder Airdrops
$BTC
$ETH
$HYPE ‌
GENIUS-3.68%
AIRDROP0.96%
BTC0.05%
ETH-0.42%
GateUser-9bbde01b
I don't know why projects agree to give random $BNB holders huge amount of tokens to insta dump at the expense of genuine holders. $GENIUS was on it's way to $1 but nuked 50% due to HODLer airdrop.
  • Reward
  • Comment
  • Repost
  • Share
#BTC
#StockTradingChallengeUpTo17000U
Buying Digital Gold Monetary currency Technical Rising Rebound Indicators Accumulate OG Holder Buying Pressure Financial Strategies Unstoppable Orange Open Positions Strong rising momentum 💪
BTC_USDT
ETH _USDT
HYPE _USDT
$BTC
$ETH ‌
$HYPE ‌
BTC0.04%
OG1.24%
MMT0.23%
Pheonixprincess
#24hCryptoFuturesLiquidationsTop400M
Over the past 24 hours, crypto derivatives markets saw a heavy liquidation wave exceeding $400 million, with some intraday spikes reaching between $700 million and $780 million during peak volatility conditions. This event impacted nearly 80,000 to 100,000 traders, showing how aggressively leveraged the market had become.
Most liquidations came from long positions, meaning traders were positioned for continued upside. Instead, Bitcoin reversed sharply from the $76,500–$77,200 area and dropped toward the $72,000–$73,500 region, triggering cascading liquidations across multiple exchanges.
Bitcoin alone contributed roughly $80 million to $95 million in liquidations, while Ethereum added approximately $40 million to $70 million, and altcoins collectively amplified losses due to thinner liquidity and higher leverage exposure.
How Crypto Futures Liquidation Works
Crypto futures trading allows traders to control large positions using leverage, but this also increases risk significantly.
For example, a trader using $1,000 at 10x leverage controls a $10,000 position, while 20x leverage expands it to $20,000, and 50x leverage increases exposure to $50,000.
At higher leverage levels, even small price movements become dangerous. A 5% drop can liquidate a 20x position, while a 10% move can wipe out a 10x position, and ultra-high leverage positions can be destroyed by moves of just 1% to 2%.
Liquidation occurs when the margin falls below maintenance requirements. At that point, exchanges automatically close positions at the mark price, which is calculated using a fair-value index from multiple exchanges rather than the last traded price. This is why traders sometimes get liquidated even when price briefly rebounds on spot charts.
The Cascade Effect Behind Massive Losses
The most dangerous feature of crypto derivatives is the liquidation cascade effect.
When Bitcoin enters a highly leveraged zone, such as between $73,000 and $72,000, the first wave of long positions begins to get liquidated. These forced sell-offs increase downward pressure, which pushes price lower into the next cluster of leveraged positions.
During this event, major liquidation clusters were observed at $73,500, $73,000, $72,500, and $72,000, and once price entered this zone, forced selling accelerated rapidly.
Each liquidation triggers more selling, which triggers more liquidations, creating a chain reaction that can wipe out hundreds of millions in minutes.
Bitcoin Current Price Structure
Bitcoin is currently trading around $73,000 to $74,000, after failing to sustain momentum above the $76,500–$77,500 resistance zone.
On the downside, the first major support is sitting at $73,000, followed closely by a critical liquidation area around $72,500, where a large number of leveraged long positions are concentrated. If price breaks below this level, the next supports are seen at $72,000, $71,000, and $70,000, with deeper structural support near $68,500 and $65,000.
On the upside, immediate resistance is seen around $74,500 and $75,500, followed by stronger resistance at $76,500 and $77,500. The key psychological barrier remains at $80,000, which has repeatedly rejected upward attempts.
Ethereum and Altcoin Market Damage
Ethereum is currently trading near $1,950 to $2,050, showing weaker momentum compared to Bitcoin after losing strength from higher levels around $2,200+ earlier periods.
Key Ethereum support zones are located at $2,000, $1,950, $1,900, and $1,800, while resistance levels are positioned at $2,100, $2,250, $2,400, and $2,600.
Altcoins experienced even sharper declines, with many mid-cap tokens dropping between 10% and 25% intraday, especially in sectors like AI tokens, meme coins, and high-leverage DeFi assets. This reflects how liquidity dries up faster in smaller markets during liquidation cascades.
Why Macroeconomic Conditions Matter
Crypto markets are now heavily influenced by global macro conditions rather than internal trading dynamics alone.
Key drivers include interest rates, inflation expectations, USD strength, ETF flows, and global risk sentiment. When interest rates remain high, liquidity in financial markets tightens, making speculative assets like crypto more vulnerable to sharp corrections.
This is why Bitcoin’s price action increasingly reacts not just to technical levels but also to broader macro signals such as Federal Reserve policy expectations and global energy prices.
Liquidation Heatmap Structure
Liquidation heatmaps show where leveraged positions are concentrated, and currently both sides of the market are heavily stacked.
On the downside, long liquidation zones are clustered at $73,000, $72,500, $72,000, $71,500, and $70,000, meaning a drop below current levels could trigger another liquidation wave.
On the upside, short liquidation zones are seen at $75,500, $76,500, $77,500, $79,000, and $80,000, meaning a breakout above these levels could trigger a short squeeze.
This creates a tight pressure range where Bitcoin can accelerate quickly in either direction once liquidity is triggered.
Market Sentiment Overview
Market sentiment has shifted toward caution, with the Fear and Greed Index sitting in the low 20s to low 30s range, indicating fear-driven conditions.
Open interest remains elevated, meaning many leveraged positions are still active and vulnerable. At the same time, retail participation has declined after repeated liquidation events.
Despite this, long-term investors continue accumulating in the $70,000–$75,000 zone, viewing it as a potential value range rather than a panic zone.
Potential Market Scenarios
In a bearish scenario, if Bitcoin breaks below $72,500, downside momentum could extend toward $72,000, $71,000, $70,000, $68,500, and even $65,000, especially if another liquidation wave is triggered.
In a base scenario, Bitcoin continues consolidating between $72,500 and $80,000, forming a wide range while the market waits for macro or ETF-related catalysts.
In a bullish scenario, if Bitcoin reclaims $76,500 and breaks above $80,000, price could accelerate toward $85,000, $90,000, $95,000, and potentially $100,000, especially if a short squeeze develops above $79,000.
Trading Lessons From the Liquidation Event
This $400 million liquidation event highlights key lessons for traders.
High leverage remains the biggest risk factor in the market, as even small price movements of 1% to 5% can wipe out entire positions. Liquidity cascades can turn normal corrections into aggressive sell-offs within minutes.
Position sizing and risk control matter far more than directional accuracy. Many traders were not wrong in their market view, but they were overexposed through excessive leverage.
The crypto market is currently sitting in a fragile equilibrium between $72,500 support and $80,000 resistance. Ethereum and altcoins remain more volatile and sensitive to Bitcoin direction.
Until leverage reduces and volatility stabilizes, liquidation cascades remain a constant risk.
Key levels to watch include $72,500 as critical support, $75,500 as mid-range pivot, and $80,000 as major resistance, while the downside extension zone near $70,000 remains a key stress area.
In this environment, survival depends more on disciplined risk management than aggressive trading, because in leveraged markets, small moves can create large consequences.
  • Reward
  • Comment
  • Repost
  • Share
#BTC
#StockTradingChallengeUpTo17000U
BlackRock Outflows
Total Market Impact
BTC_USDT
Market Context
$BTC $ETH
$HYPE
BTC0.04%
ETH-0.42%
HYPE7.42%
AssembleAi
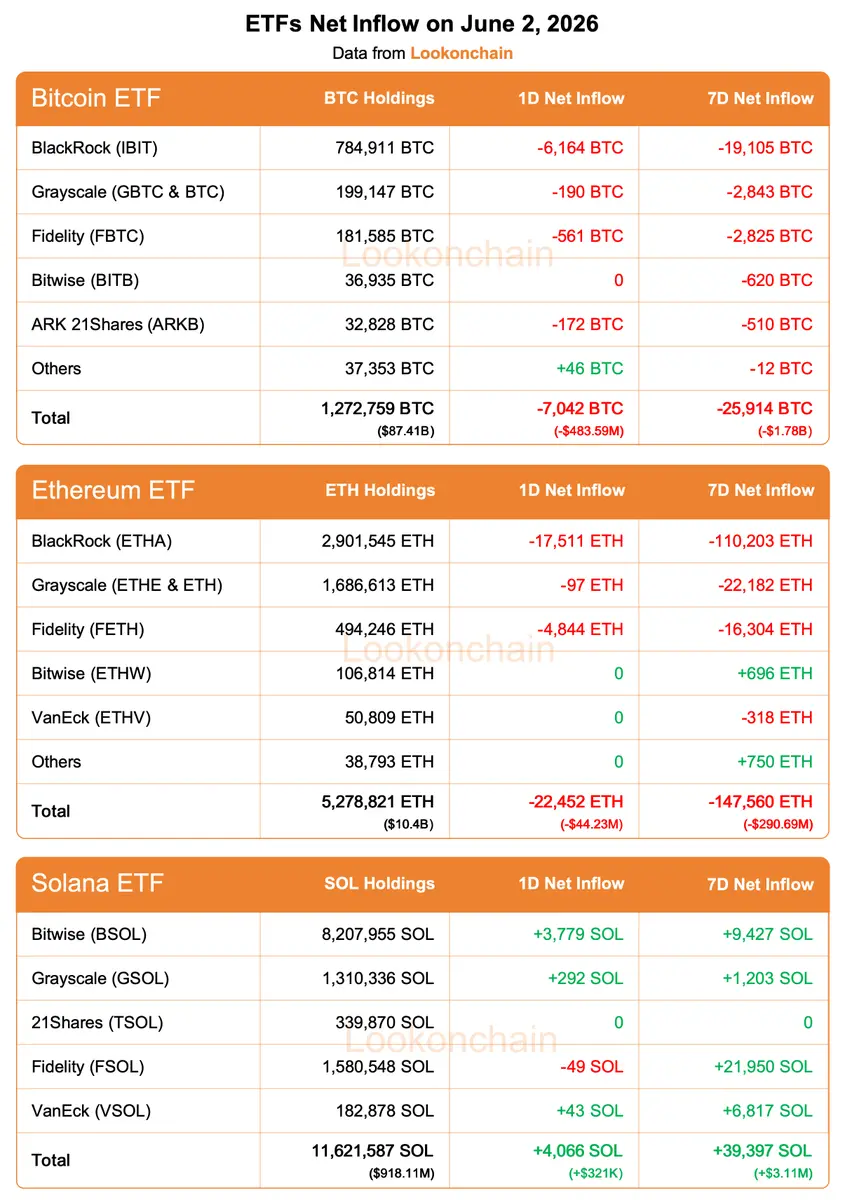
BlackRock Bitcoin ETF Loses $528M in Second-Largest Daily Outflow
SoSoValue data shows BlackRock's iShares Bitcoin Trust shed $527.84 million on Wednesday. The outflow was the fund's second-largest single-day net outflow since its January 2024 launch. The 11 U.S.-listed spot bitcoin ETFs lost a combined $733.43 million on Wednesday. Bitcoin traded at $72,978 in
  • Reward
  • Comment
  • Repost
  • Share
#StockTradingChallengeUpTo17000U
Rainbow Charts
Buying Digital Gold Monetary currency Technical Support Base
BTC_USDT $ 73664.00
ETH /USDT $2018.00
HYPE/USDT 68.00
$BTC $ETH
$HYPE
BTC0.04%
ETH-0.42%
HYPE7.42%
MoonGirl
#WinGoldBarsWithGrowthPoints Gate Square Little Classroom 🧑‍🏫
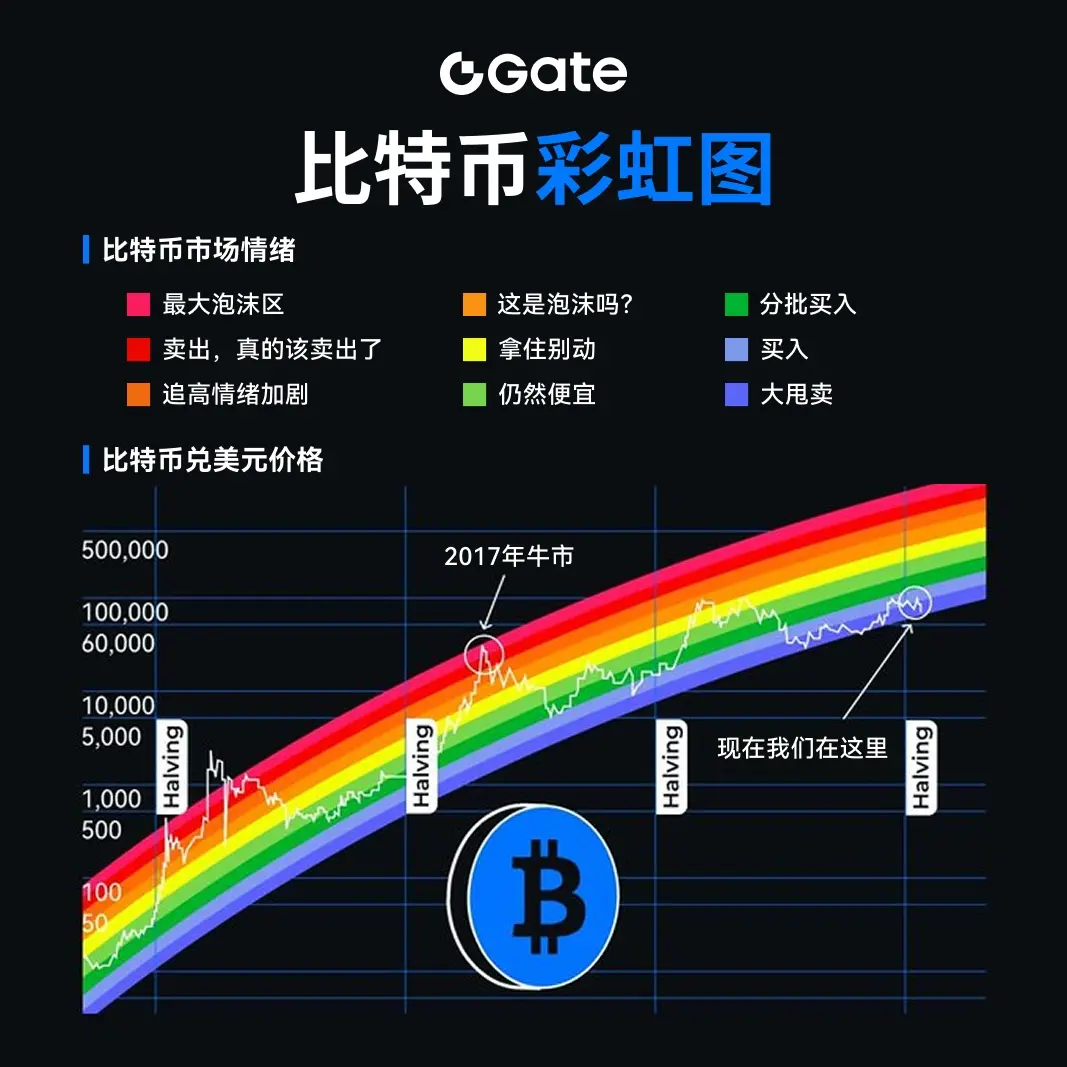
The Bitcoin Rainbow Chart is a tool that displays Bitcoin's long-term price trends and market sentiment through color-coded zones. From blue to red, they correspond to the "buy zone," "hold zone," and "bubble zone." The current price is near the "gradual buy-in" and "still cheap" areas, reflecting a cooler market sentiment. The rainbow chart is not used for short-term timing but is more suitable for helping long-term investors understand the cycle position.#MoonGirl
repost-content-media
  • Reward
  • Comment
  • Repost
  • Share
#StockTradingChallengeUpTo17000U
Bearish Demand
Price Status
BTC_USDT $ 73,682.9
Market Context :
Significant Decline in positive apparent Demand relative to previous months
$BTC
$ETH
$HYPE
BTC0.04%
ETH-0.42%
HYPE7.42%
KamranAsghar
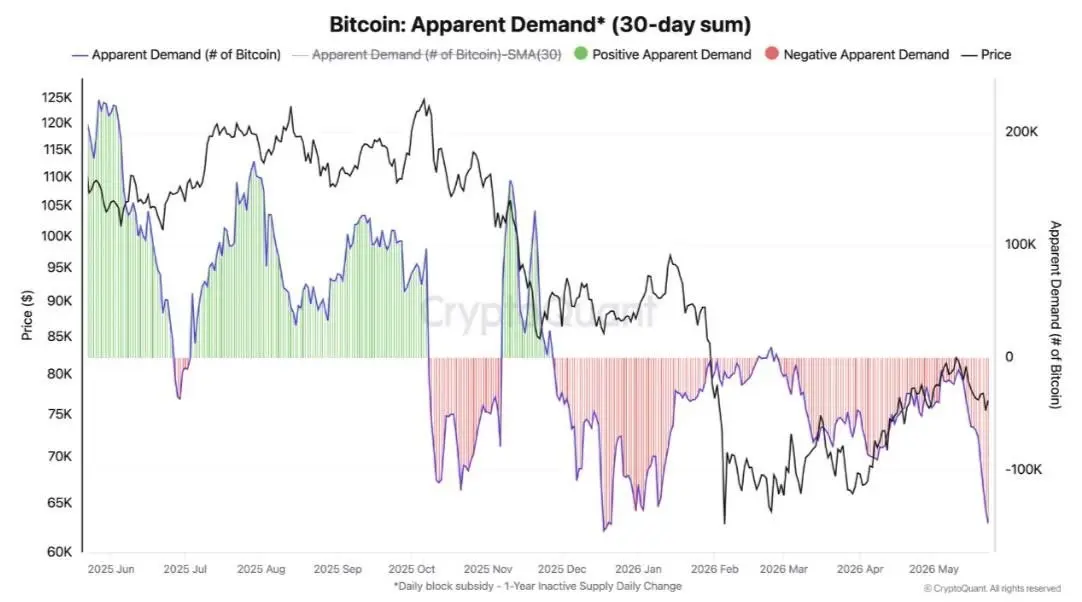
BITCOIN DEMAND HAS FALLEN TO ITS MOST BEARISH LEVEL OF THE YEAR, ACCORDING TO CRYPTOQUANT.
#BTC
repost-content-media
  • Reward
  • Comment
  • Repost
  • Share
#BTC
#StockTradingChallengeUpTo17000U
BTC
Market Sentiment & Macro Environment
-Geopolitical Tensions
-Monetary Policy
Bitcoin;Bearish Neutral
Bullish Scenario $72K~74K~76K
ETH
$2000~$2150
$BTC $ETH
BTC0.04%
ETH-0.42%
CryptoChampion
#DailyPolymarketHotspot
BTC Market Update — Bitcoin Holds the Line Near $73.7K After Heavy Volatility
Bitcoin is currently trading around $73,700 after another volatile 24-hour cycle that pushed traders into a high-risk environment across both spot and derivatives markets. During the session, BTC recorded a 24-hour low of $72,500 and a 24-hour high of $74,400, showing that the market remains trapped between aggressive sellers and strong support buyers.
After reaching highs near $77,280 earlier this week, Bitcoin entered a broader correction phase as institutional flows weakened and macroeconomic pressure intensified. Traders are now watching the $72K support area closely because the next major directional move may begin from this zone.
Technical Structure Remains Extremely Important
Bitcoin is currently moving below both the 50-day and 200-day moving averages, which keeps short-term market sentiment cautious. Momentum indicators are also signaling weakness:
• RSI is approaching oversold territory
• MACD continues to show bearish crossover pressure
• Sell-side volume remains elevated during market drops
• Price volatility has increased around key option strike zones
The most important support area remains between $72,000 and $73,000. If BTC loses this range with strong volume confirmation, the market could quickly revisit the psychological $70,000 level. Below that, analysts are monitoring the February 2026 low near $60,000 as the next major defensive zone.
On the upside, Bitcoin must reclaim the $75,000-$76,000 resistance range before bulls can attempt another move toward the critical $80,000 call-wall level. A successful breakout above $80K could reopen the path toward the $85K-$90K region later in Q3.
Massive Options Expiry Driving Market Behavior
One of the biggest catalysts behind today’s volatility is the expiration of approximately $6.25 billion worth of Bitcoin options on Deribit.
Key data traders are monitoring:
• 80,535 BTC contracts set to expire
• Max Pain level positioned at $75,000
• Put/Call Ratio currently near 0.86
• Heavy concentration of $80K call options
• Defensive positioning around $75K put levels
Because of this setup, many traders believe Bitcoin may continue gravitating toward the $75K zone before a larger directional breakout occurs.
Institutional Demand Shows Mixed Signals
Spot Bitcoin ETF activity has slowed compared to previous weeks. While long-term institutional adoption remains strong, recent data suggests weaker short-term buying pressure from U.S. investors.
Important developments include:
• Mixed ETF inflows during late May
• BlackRock’s IBIT maintaining market dominance
• Coinbase Bitcoin Premium Index falling to deeply negative levels
• Reduced aggressive spot buying from institutions
Despite current weakness, many long-term investors still view the present correction as part of a broader consolidation structure rather than the start of a full bearish cycle.
Macro Pressure Still Controlling Risk Assets
Global macroeconomic uncertainty continues to weigh on crypto markets. Rising geopolitical tension involving Iran and the Strait of Hormuz has increased risk-off sentiment across financial markets. At the same time, Federal Reserve officials continue emphasizing inflation control and tighter monetary conditions.
This combination has strengthened the U.S. dollar while putting pressure on speculative assets like Bitcoin and technology stocks.
Market Outlook
Bullish Scenario:
If BTC successfully holds above $72K and ETF inflows recover, Bitcoin could reclaim $80K and potentially target the $85K-$90K range in the coming months.
Neutral Scenario:
BTC may continue consolidating between $72K and $80K while traders wait for clearer macro and institutional signals.
Bearish Scenario:
A confirmed breakdown below $72K could accelerate downside momentum toward $70K and potentially even $60K support levels.
For now, Bitcoin remains at a critical decision zone. Traders are closely watching derivatives positioning, ETF flows, Federal Reserve policy signals, and geopolitical developments as the market prepares for its next major move.
#TradeCFDWinGold
repost-content-media
  • Reward
  • Comment
  • Repost
  • Share
BitMine OG Holder Buying Digital products
Unstoppable Orange Open Positions Strong 💪 ETH
His target long-term revolution
$ETH
OG1.24%
ETH-0.42%
TheCryptera
BitMine acquired 111,942 $ETH last week
Total holdings now: 5,390,000 $ETH
That is 4.47% of the entire Ethereum supply
One company owns nearly 1 in every 22 $ETH in existence
The accumulation does not stop 👀
#Bitmine #Tomelee #Ethereum
repost-content-media
  • Reward
  • Comment
  • Repost
  • Share
#StockTradingChallengeUpTo17000U
From Financial Strategies Unstoppable
Downward & Upward Repeating
Arbitrage Swinging Grid bot trading strategy for taking profit-taking
$BTC
BTC0.04%
CryptoAirdrop
once $Pi by #PiNetwork hits $5 in the coming months call my name with respect 😭
  • Reward
  • Comment
  • Repost
  • Share
#StockTradingChallengeUpTo17000U
ETH Bearish Outlook Expanding
likelihood of $2000~
the betting probability reached higher rising highest
Stable coin Fee all Zero Risk
$ETH
ETH-0.42%
CoinNetwork
Crypto news, Maji Huang Licheng reduced his long ETH position by 880 coins on the HyperLiquid platform, approximately $1,845,712.
The current holdings amount to $7,122,368, with an average price of $2,094.83, and a current profit and loss of -$251,458.80, with a loss ratio of -88.26%.
The current coin price is $2,023.39, and the liquidation price is $2,011.26.
This trader once profited from blue-chip NFTs but has experienced massive drawdowns since October, with funds shrinking from over 100 million to several hundred thousand dollars.
  • Reward
  • Comment
  • Repost
  • Share
#MU#
Trend Detection Super Trend Macd Check
Momentum Confirmation
Volatility Assessment
Bollinger Band
Risk Management
Over heating warning overheated
Higher PER PBR
Highest Price
Arbitrage Traders say Overheating
Profit-taking Money Partial Taking Profit Money
$MU
MU4.12%
AirdropBlackHole
U.S. Stock Indices Slightly Rise; Micron Technology Hits New Highs
Abstract: On May 28, U.S. equities edged up modestly as major indices rose. Micron and TSMC led gains in chip stocks amid demand and pricing signals, while Meta advanced on plans for a paid AI chatbot subscription.
Summary: U.S. stocks edged higher as Micron and TSMC posted gains on chip demand and price hikes, while Meta rose on plans for a paid AI chatbot subscription.
  • Reward
  • Comment
  • Repost
  • Share
#GENIUS#
Genius USDT
indicating positive long term Buying Momentum
Community To The MOON
Technical support Base
Strong rising Bullish Bullrun $GENIUS $GOOGLON
GENIUS-3.68%
GOOGLON0.15%
阿酒
GeniusFi is a pioneering PropAMM built specifically for the BNB Chain. It aims to become a liquidity hub that carries core asset flow by relying on the pre-confirmation mechanism of the BEP-668 proposal.
Drawing on Solana’s experience, a PropAMM actively operated by market makers delivers far higher capital efficiency than traditional passive pools. GeniusFi breaks with tradition—each asset has only a single pool—and it avoids capital fragmentation through a unified cross-matching engine.
Because the EVM lacks sorting optimizations, expired quotes are easily exploited by arbitrage. BEP-668 provides a hard sorting guarantee at the top of the block through “relay + sidecar,” ensuring that quote updates are prioritized over swap execution, thereby enabling extremely tight spreads.
It adopts a fault lock mechanism to prevent unprotected trades; as a clear routing destination, it fully connects with wallets and aggregators, establishing a dominant position in the ecosystem through excellent pricing and predictability. GeniusFi is a pioneering PropAMM built specifically for the BNB Chain. It aims to become a liquidity hub that carries core asset flow by relying on the pre-confirmation mechanism of the BEP-668 proposal.
Drawing on Solana’s experience, a PropAMM actively operated by market makers delivers far higher capital efficiency than traditional passive pools. GeniusFi breaks with tradition—each asset has only a single pool—and it avoids capital fragmentation through a unified cross-matching engine.
Because the EVM lacks sorting optimizations, expired quotes are easily exploited by arbitrage. BEP-668 provides a hard sorting guarantee at the top of the block through “relay + sidecar,” ensuring that quote updates are prioritized over swap execution, thereby enabling extremely tight spreads.
It adopts a fault lock mechanism to prevent unprotected trades; as a clear routing destination, it fully connects with wallets and aggregators, establishing a dominant position in the ecosystem through excellent pricing and predictability. $GENIUS
  • Reward
  • Comment
  • Repost
  • Share
#GENIUS#
Buying Digital Gold
Buying pressure for your strategy Indicators Accumulate OG Holder Strong Buying Unstoppable Orange Open Positions Long-Term
GENIUSFi
Capital Efficiency & Unified Liquidity
Solving EVM Limitations (BEP-668)
Security & Ecosystem Intergration
$GENIUS
GENIUS-3.68%
OG1.24%
Muqeeem
Long $GENIUS  (Anticipating a bounce from key cluster support)
GENIUSUSDT
Perp
0.6883
+9.79%
Entry Zone: 0.6650 – 0.6850 (Accumulating near the confluent MA(25) / MA(99) support block)
TP1: 0.7450 (Immediate horizontal resistance / recent local lower high)
TP2: 0.8100 (Major psychological supply zone just below the peak)
SL: 0.6350 (Placed safely below the intermediate swing low level)
DYOR-NFA
  • Reward
  • Comment
  • Repost
  • Share
#StockTradingChallengeUpTo17000U#
Events Details
Users can unlock a prize pool of up 17000 USDT
through spot trading, futures, and CFD stacking
New User Benefits: 2-10 USDT
Extra Tasks
Reply Bonus
$BTC $ETH $GOOGLON
BTC0.04%
ETH-0.42%
GOOGLON0.15%
Gate广场_Official
📢 Gate Plaza | 5/26 Hot Topics: #股票交易挑战最高赢17000U
The money-making opportunity is here! Gate stock trading challenge unlocks a prize pool of up to 17,000 USDT! Earn rewards through spot trading, futures, and CFD stacking. New users get 2-10 USDT stock tokens on their first trade, with additional cash for flash swaps, ETFs, and US bond tasks. Have you hopped on board?
🎁 Reply Bonus: Share your contest strategies and invite 5 friends to split a $1,000 position experience voucher!
💬 This week's discussion:
1️⃣ Share your contest experience, tips for passing levels, or arbitrage tricks.
2️⃣ Show off your contest results and trading leaderboard!
Share now: https://www.gate.com/post
Event details: https://www.gate.com/announcements/article/51359
📅 Deadline: 5/28 18:00 (UTC+8)
repost-content-media
  • Reward
  • Comment
  • Repost
  • Share
#StockTradingChallengeUpTo17000U
Buying Al Memory Sector
Micron technology
Samsung Electronics
SK Hynics
Goggle
Nvidia
Open Al
Anthropic
$MU
Falcon_Official
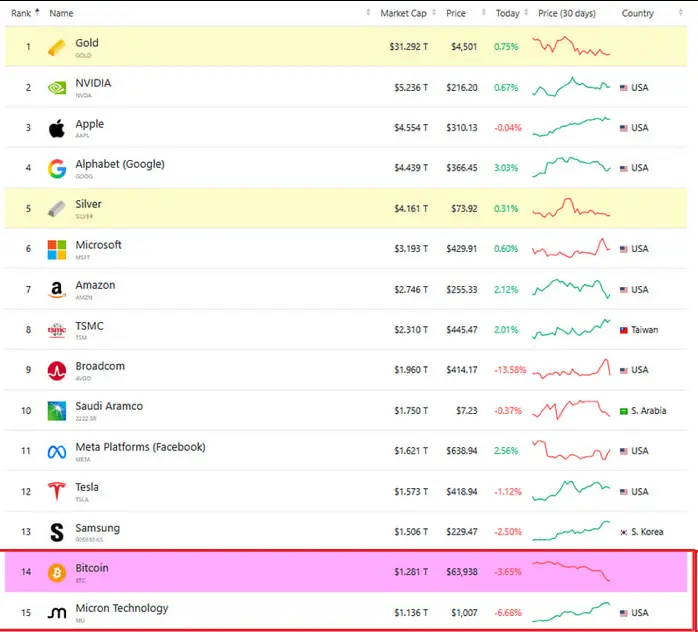
#美光市值突破1万亿美元 Memory Chips Have Become the New Crown Jewel of AI Micron's $1 Trillion Milestone Signals a Structural Re-Rating of the Semiconductor Industry
On May 26, 2026, Micron Technology surged 19.3% to close at $895.88, propelling its market capitalization past the $1 trillion threshold for the first time in history. Just 24 hours later, South Korea's SK Hynix joined the same club with an 11%+ rally, and Samsung Electronics had already crossed that line earlier this month. Three memory chip companies once dismissed as cyclical commodity players now sit alongside Apple, Microsoft, Nvidia, and Meta in the trillion-dollar echelon. This is not a speculative spike. It is a structural re-rating of an entire industry that AI has permanently transformed.
The Catalyst: UBS Tripled Its Price Target — But the Story Runs Deeper
The immediate trigger for Micron's historic surge was UBS analyst Timothy Arcuri raising his 12-month price target from $535 to $1,625 a threefold increase that implies a potential valuation approaching $1.8 trillion. Arcuri's thesis centers on long-term supply agreements with partially fixed pricing, which he argues will structurally transform Micron's earnings profile from volatile and cyclical to durable and recurring. "We believe the market will start to put a more 'normal' multiple on the stock," he wrote, signaling that the traditional discount applied to memory stocks penalizing their boom-bust cyclicality no longer reflects reality.
But this analyst upgrade merely crystallized what the market had been pricing for months. Micron's stock has more than tripled year-to-date, and the broader Philadelphia Semiconductor Index (.SOX) has logged an unprecedented 18 consecutive winning sessions the longest streak in its 32-year history surging approximately 44% over that period alone. Global semiconductor spending is projected to hit $1.3 trillion in 2026, a 64% year-over-year increase, confirming that this rally rests on genuine demand fundamentals rather than pure sentiment.
Why Memory, Not Logic, Is the Real AI Bottleneck
For the past two years, Nvidia's GPUs dominated the AI investment narrative. The logic chip the processor that trains and runs models was seen as the irreplaceable core. But as AI infrastructure scales from training to inference and from cloud to edge, a different bottleneck has emerged: memory bandwidth. Each new GPU generation requires 3.5× more high-bandwidth memory (HBM) than its predecessor, and AI models have grown 34× in parameter size across generations. Without sufficient HBM, the most powerful GPUs sit idle, waiting for data to move.
Micron delivers precisely this missing layer. Its Cloud Memory unit nearly doubled to $5.28 billion in a single quarter, and HBM capacity is sold out through calendar 2026. The company's Q2 FY2026 revenue hit $23.86 billion a historic blowout with HBM reaching $1 billion quarterly revenue annualization, a milestone that confirms memory has transitioned from commodity to strategic asset. Micron is also the only U.S.-based HBM supplier, giving it a geopolitical advantage as Washington intensifies its push for domestic semiconductor resilience.
The Ripple Effect Across the Chip Ecosystem
Micron's trillion-dollar breakthrough did not happen in isolation. It catalyzed a broad semiconductor rally that lifted the S&P 500 and Nasdaq to fresh all-time highs on May 26 the Nasdaq gaining 1.19% and the S&P 500 adding 0.61%. The VanEck Semiconductor ETF (SMH) touched a new 52-week high with a 3%+ gain. The information technology subindex led all S&P sectors with a 1.7% rise.
Qualcomm (QCOM) gained roughly 4.5% on news that it reached an AI chip supply deal with TikTok owner ByteDance a pivot from mobile-dominated revenue toward data center and "physical AI" infrastructure. Qualcomm's CEO Cristiano Amon disclosed entry into data center custom silicon with a leading hyperscaler, with an Investor Day on June 24 set to detail the roadmap. Over the past month alone, QCOM has surged 86%, reflecting the market's recognition that the AI expansion is absorbing every category of semiconductor, not just GPUs and memory.
SanDisk (SNDK), the flash storage pure-play spun out from Western Digital in 2025, has gained 136% in 2026 alone. FTSE Russell proposed moving both Micron and SanDisk from the Value Index to the Growth Index a classification shift that formally acknowledges the structural transformation of memory stocks from cyclical value plays to secular growth stories. This rebalancing will force passive funds tracking the Growth Index to add positions, creating a mechanical buying pressure that further validates the re-rating thesis.
Modine Manufacturing jumped 16% on a $4 billion data center cooling deal through 2029. Vicor surged 24% after boosting Q2 revenue guidance. These moves confirm that the AI infrastructure build-out is spilling beyond silicon into power delivery, thermal management, and physical plant a second-order demand wave that amplifies the semiconductor thesis.
Geopolitics: The Iran Peace Factor
Overlaying the AI rally is a geopolitical development with profound market implications. President Trump announced that a U.S.-Iran memorandum of understanding has been "largely negotiated," with the Strait of Hormuz reopening as a core term. Secretary of State Marco Rubio cautioned that finalizing the deal "could take a few days," and the situation remains fragile U.S. forces struck two Iranian ships attempting to lay mines in the Strait even as talks progressed. Brent crude nonetheless traded above $100 on the supply risk, while WTI fell 2.2% on peace optimism.
The dual dynamic — AI-driven equity strength alongside persistent energy risk has created a fascinating market composition. Lower energy costs from a successful deal would reduce input expenses for data center operators, directly benefiting the semiconductor ecosystem. Conversely, sustained Strait disruption would elevate diesel and cooling costs, pressuring margins. The market is pricing a partial resolution: equities rally on AI fundamentals while energy markets hedge the geopolitical tail risk. This creates opportunity for traders who can separate the secular AI trend from the cyclical energy noise.
Valuation: Still Cheap Relative to Growth
Despite Micron's parabolic run, its forward P/E ratio stands at just 8.42× next-12-month expected earnings compared to 22.15× for the S&P 500 and 26.23× for the Nasdaq 100. This extraordinary discount reflects the residual skepticism around memory cyclicality, but it also presents a compelling entry point if the structural thesis holds. SK Hynix's 12-month gain exceeding 1,000% suggests that even more dramatic repricing is possible when the market fully internalizes the duration and magnitude of this memory supercycle.
The risk, as veteran investors warn, is that memory has always been boom-and-bust. Supply additions eventually arrive, pricing power erodes, and margins compress. The bullish counterargument is that AI demand is structurally different it requires specialized HBM and advanced DRAM configurations that cannot be rapidly commoditized, and long-term supply agreements with fixed pricing create contractual revenue floors that traditional memory cycles never had. Whether this distinction proves durable will determine if Micron stays in the trillion-dollar club or eventually revisits cyclical lows.
What This Means for Traders
The simultaneous entry of three memory companies into the $1 trillion club within one month Samsung, Micron, and SK Hynix is a signal that cannot be ignored. It marks the moment when the market formally recognized memory chips as the second pillar of AI infrastructure, co-equal with processing chips. For anyone trading semiconductor exposure, this re-rating creates several actionable dimensions:
First, the SOX index's extreme overbought status its deviation from the 200-day moving average is the highest since June 2000 warrants tactical caution. Momentum is powerful, but 18 consecutive up days leaves the index vulnerable to a consolidation or sharp pullback on any negative catalyst, whether an Iran deal setback or an AI spending disappointment.
Second, the Russell 1000 rebalancing from Value to Growth for Micron and SanDisk creates a predictable passive inflow that traders can front-run. Index-tracking funds must adjust holdings on the effective date, generating mechanical buying that may amplify near-term momentum before normalizing.
Third, the valuation gap between memory stocks (8× forward earnings) and the broader market (22×) offers a risk-reward asymmetry that is rare in mega-cap tech. If the structural thesis validates over the next two quarters if Micron's LTAs hold, if HBM pricing remains elevated, if AI inference demand continues scaling the re-rating has significant runway remaining. If cyclicality reasserts itself, the downside is buffered by earnings growth that remains real regardless of multiple contraction.
The trillion-dollar milestone is not the end of this story. It is the moment the market stopped treating memory as a commodity and started pricing it as infrastructure. That shift from cyclical to structural, from value to growth, from peripheral to essential is the defining trade of 2026.
#MicronTrillion #AIMemorySupercycle
repost-content-media
  • Reward
  • Comment
  • Repost
  • Share
#MU#
Buying Micron Technology Samsung Electronics SK hynics
Micron technology Stock Surge Soaring True
Trillion Dollars Mark
Target price upgrade Bullish Bullrun
LAT
AI Enterprises Relating AI Memory
2027~2039 Estimate
EPS $100~170
FCF $ 400000000000. $400 Billions
$MU
MU4.12%
GateBlog
Micron (MU) valuation logic reshaped: How do long-term agreements rewrite the storage chip pricing model?
On May 26, 2026, Micron Technology’s market capitalization first surpassed $1 trillion, with the stock price rising more than 19% in a single day. The direct catalyst behind this historic milestone was UBS significantly raising its price target for Micron from $535 to $1,625.
But the manner in which this price target was raised itself reveals a deeper shift beyond day-to-day stock price movements—the market is rethinking how to price a memory-chip company. Whether the logic of switching from “cyclical stocks” to “AI growth stocks” holds true depends on whether three levels of structural changes can reinforce one another.
## Why the valuation framework shifted from segment valuation to discounting overall profits
According to analysis by X user XinGPT, UBS’s prior valuation approach for Micron used a SoTP (sum-of-the-parts) method, breaking the company into two main parts: the HBM business, based on approximately $10k in revenue in 2027.
repost-content-media
  • Reward
  • Comment
  • Repost
  • Share
#HYPE#
CORE PURPOSE STRATEGIES
Asset Allocation:90% Buying Unstoppable Strong Holding
New Airdrop?
Growth Potential: Additional Rewards?
$50~65~70~100
HyperEVM layer are expanding Strongest 💪
HYPE7.42%
HYPEconomist
the smartest way to play hyperliquid in 2026:
90% → buy and hold hyperliquid:native
10% → use hyperliquid + hyperEVM
if no new airdrop (they just burn supply)
→ your hyperliquid:native should at least 2x
if they do another airdrop (retroactive)
→ you’ll likely 2x your hyperliquid:native bag via airdrop
  • Reward
  • Comment
  • Repost
  • Share
#BTC#
Buying Digital Gold Monetary
Buying pressure for profit-taking
Strategy Indicators MACD strong rising momentum
Bollinger Band Strategies Bullish Bullrun
BTC0.04%
VladInvests
💥BREAKING: Michael Saylor says he's buying bonds to buy more $BTC.
  • Reward
  • Comment
  • Repost
  • Share
#GENIUS#
Buying Digital Gold
Bullish Bullrun To The MOON
$GENIUS $BTC
GENIUS-3.68%
BTC0.04%
TheCapitalistPatriarch
$GENIUS Come hit me—hit me—hit me—
repost-content-media
  • Reward
  • Comment
  • Repost
  • Share
#GENIUS#
Buying Digital Gold
Bullish Bullrun
Buying OG HOLDER Buying Strong rising momentum for Ecosystem MOON soaring
Prices to The MOON
$BTC
$GENIUS
GENIUS-3.68%
OG1.24%
BTC0.04%
GateUser-4492b407
#GENIUS#
Buying pressure Strong rising momentum
97.5% Holding Staking Strategies
10 wallets
  • Reward
  • Comment
  • Repost
  • Share
#GENIUS#
Buying Digital Gold ATH
Buying OG Holder Strong rising momentum for Unstoppable Ecosystem HOLDER
GENIUS-3.68%
OG1.24%
GateUser-e3e57c00
$GENIUS UPDATE #GENIUS is exactly on the way as predicted. Already 25%+ gain so far. Expecting 100%+ gain here ✍🏻 This is how we are cashing market in VIP Room 🤑🤑🤑👩‍💻 #GENIUSUSDT #GENIUSBTC #BTC #Bitcoin #NFTs #Crypto #Signals
  • Reward
  • Comment
  • Repost
  • Share
  • Pinned