Sunday77

vip
Age 4.6 Year
Peak Tier 0
No content yet
$BTC Narrow-range fluctuation, increasing battle between bulls and bears, short-term direction hard to determine
BTC currently quoted at 76,547.8 USDT, up 0.54% in 24 hours, repeatedly oscillating between 76,044 and 77,408, with bulls and bears in a tense standoff, the market is waiting for a clear directional signal.
• Moving average system: Price has fallen below EMA5/10/30 moving averages, indicating a weakening short-term trend, with strong resistance forming in the 76,800-77,000 range.
• MACD: DIF and DEA continue to operate below the zero line, bearish momentum has not been fully releas
BTC0.12%
View Original
  • Reward
  • 1
  • Repost
  • Share
Sunday77:
The support at 76,000 is really crucial; once it falls below 75,500, there's a high probability of a retest.
The current Bitcoin price is $79,173.4, at a critical turning point. 🔥🔥🔥
The 30-minute chart shows signs of stabilization after a sharp decline, with the MACD histogram turning red, and the KDJ diverging upward, indicating short-term rebound momentum is gathering.
Technically, the price has broken above the short-term moving averages EMA5 and EMA10, but faces resistance from EMA30 (79,384) and the SuperTrend (79,576).
The RSI has risen to 55.2, moving out of the weak zone, supporting the rebound view.
Future trend forecast: In the short term, a "bottoming out and rebound, oscillation and co
BTC0.11%
View Original
  • Reward
  • 2
  • Repost
  • Share
LittleGodOfWealthPlutus:
Wishing you good luck in the Year of the Horse, and congratulations on your wealth.
View More
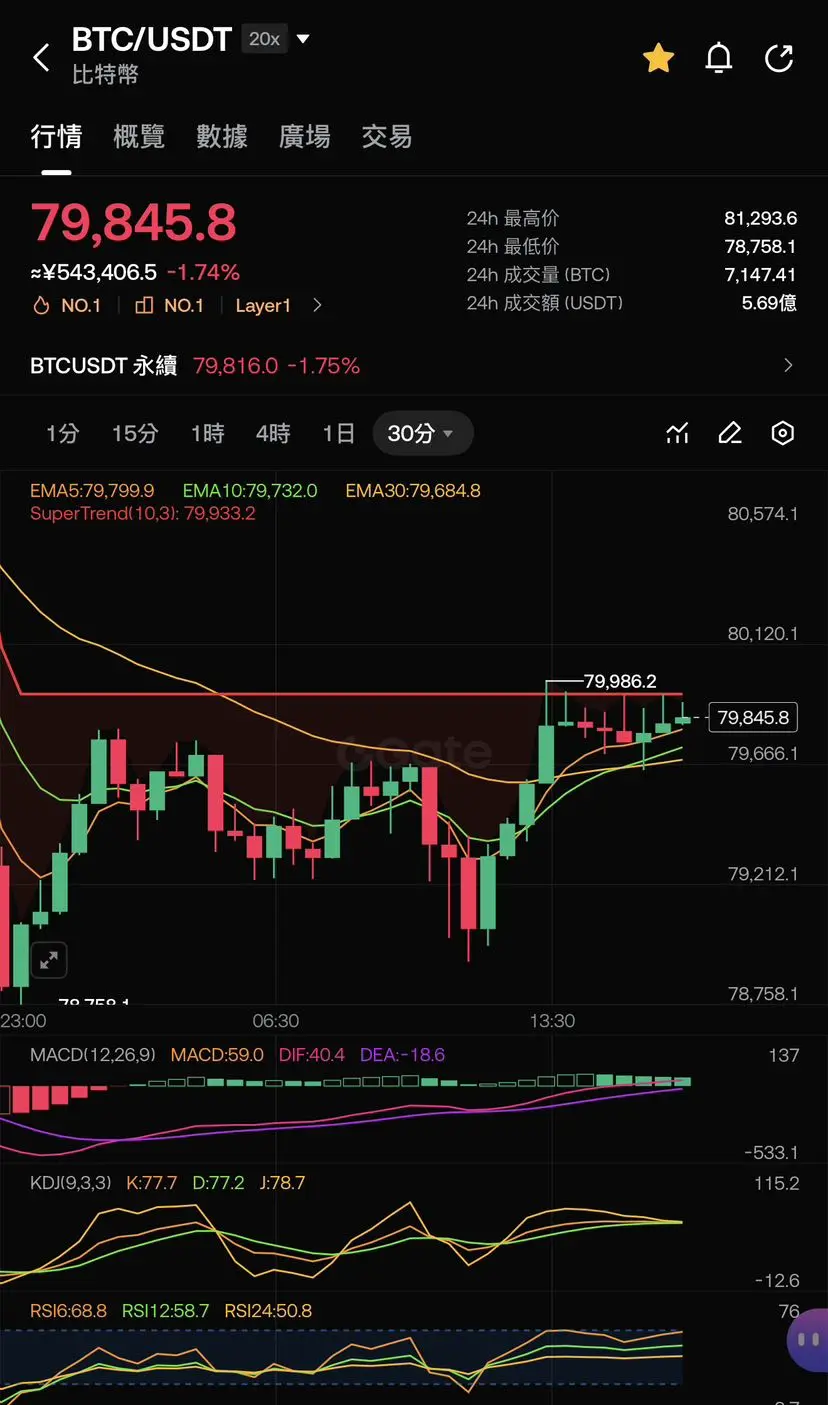
BTC current price 79,845, down slightly by 1.74% intraday, oscillating above the EMA moving averages with a relatively strong trend, bulls still hold the advantage.
RSI(6) 68.8 approaching overbought, KDJ three lines turning at high levels, combined with MACD red histogram momentum weakening, short-term correction risk is accumulating. Resistance at 79,986 above, a break may challenge 80,500; support at 79,700 (EMA5), 79,200 (EMA30).
In terms of operation, it is not recommended to chase the high.
A rebound to 79,600-79,700 with stabilization can be lightly longed, stop-loss below 79,500;
If an
BTC0.12%
ETH-0.56%
GT2.47%
View Original
post-image
  • Reward
  • 3
  • Repost
  • Share
LittleGodOfWealthPlutus:
Good luck in the Year of the Horse, wishing you prosperity and wealth
View More
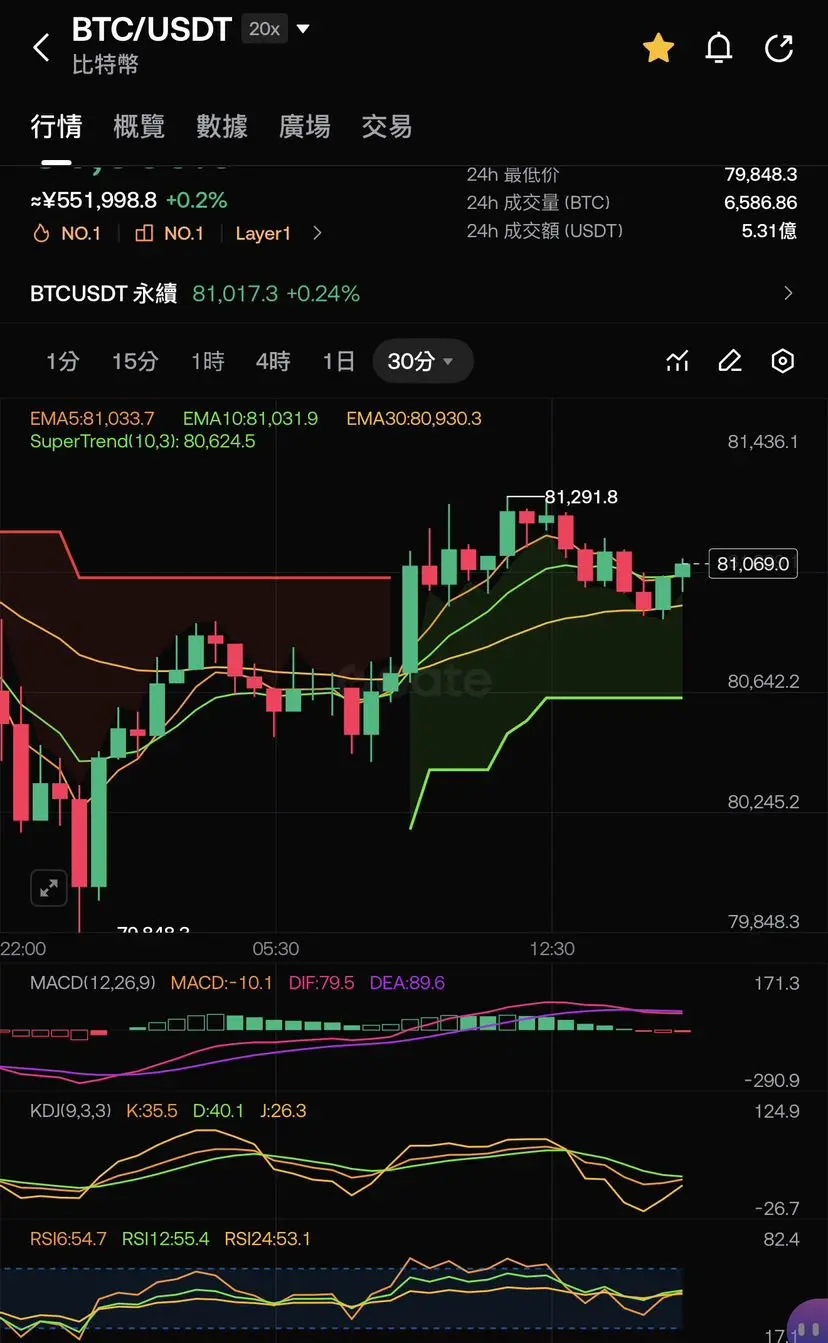
🚀 $BTC After bottoming out and rebounding, it consolidates at high levels! Stand firm on all moving averages + the super trend line!
The bullish arrangement is intact, KDJ has pulled back into position, MACD remains in a golden cross, and the shakeout is nearing the end!
The only resistance is the previous high of 81,291; a breakout would directly open up upward space!
Aggressive traders can attempt a breakout with light positions, while conservative traders wait for a pullback to buy at 80,600–80,700, set good stop-losses to avoid being shaken out!
Bitcoin stabilizes and gathers strength, w
BTC0.11%
ETH-0.52%
View Original
post-image
  • Reward
  • 1
  • Repost
  • Share
Sunday77:
Is it better to break through the previous low and buy, or wait for a pullback to 80,600 for a more secure entry?
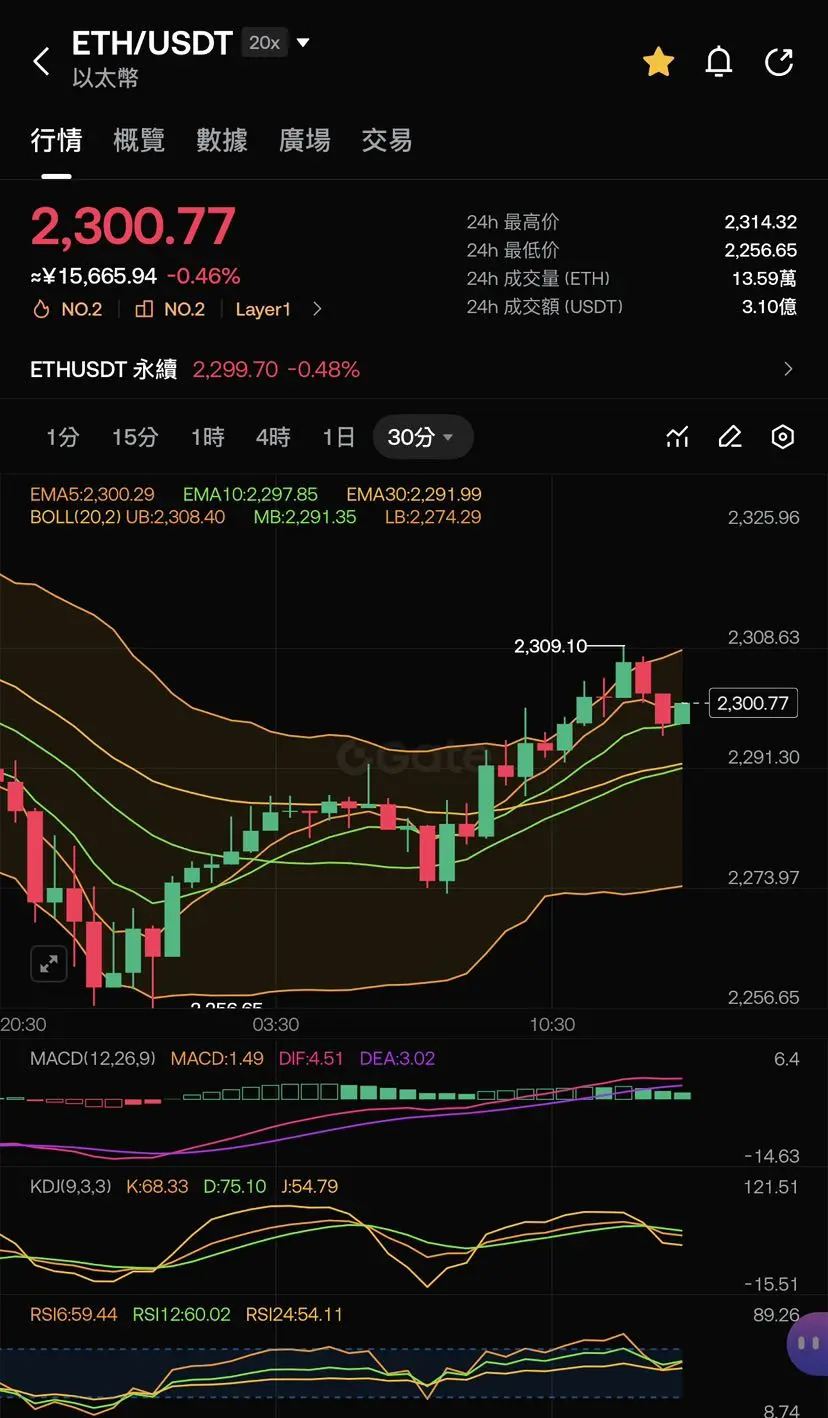
📈 Ethereum has clearly broken out of a defined corrective trend; on the 30-minute timeframe, a choppy upward channel is opening
Continuously rebounding from the low at 2256, the price stands firm above the middle band of the Bollinger Bands
The short-term EMA moving averages are in a bullish order; the MACD red histogram keeps expanding, and bullish momentum is steadily building
⚠️ The short-term KDJ has entered a high-range zone and is at any time at risk of a technical pullback
The current 2300 level is being tugged back and forth repeatedly, and the 2309 high overhead resistance is
ETH-0.52%
BTC0.11%
View Original
post-image
  • Reward
  • 2
  • Repost
  • Share
Sunday77:
Although the bullish trend is clear, chasing high positions carries extremely high risk; patience and waiting for a pullback is the prudent approach.
View More
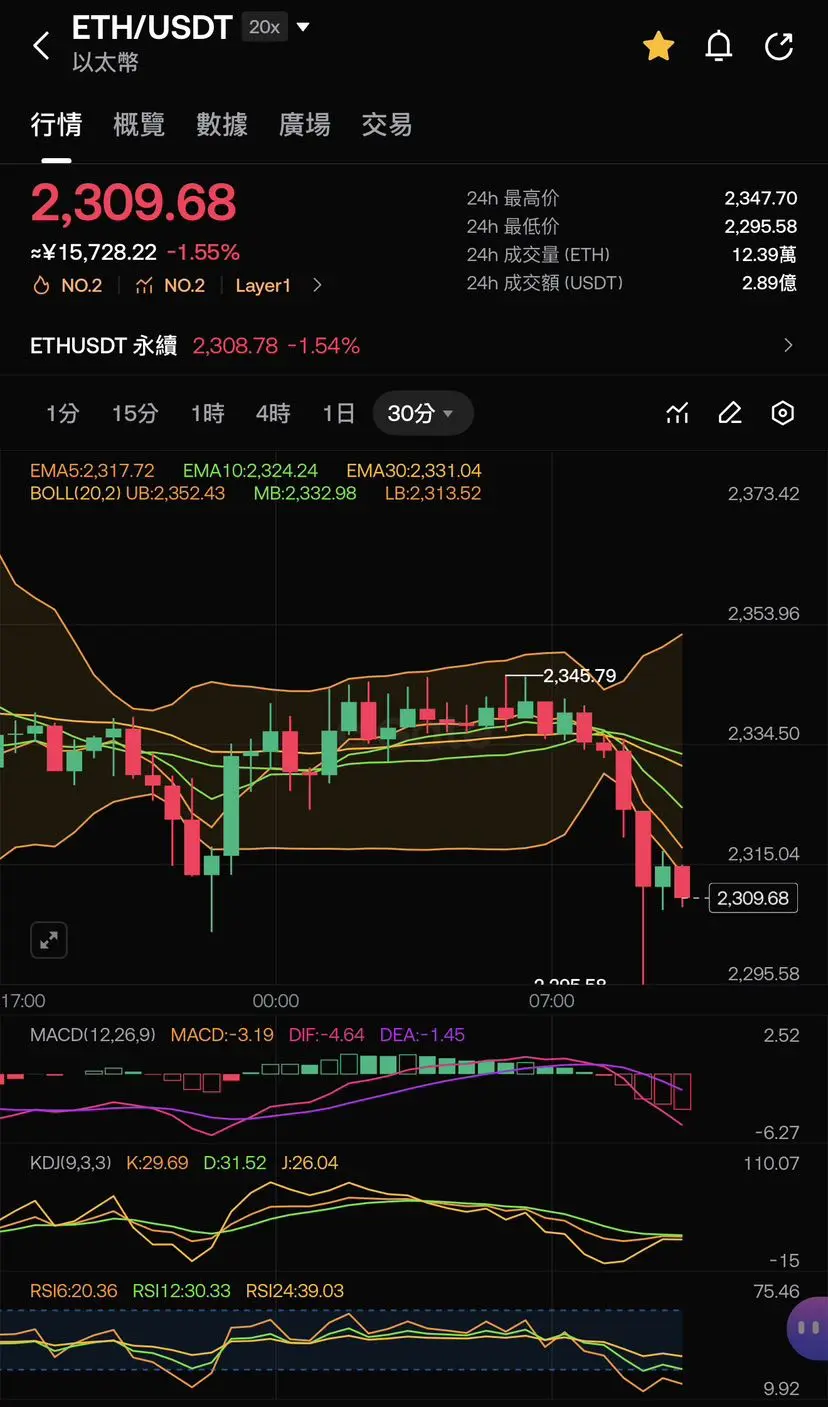
$ETH The current price is 2309.68, a large bearish candlestick broke through on the 30-minute chart, indicating a full-scale bearish trend.
Price broke below the lower Bollinger Band and the short-term moving averages EMA5 and EMA10, entering an overall downtrend channel.
The MACD bearish green bars continue to expand, with the DIF and DEA lines forming a death cross and moving downward, accelerating bearish momentum.
KDJ and RSI are simultaneously in the low zone, indicating short-term oversold conditions, but the downward inertia still remains.
Short-term support is at 2295, with a rebound r
ETH-0.52%
View Original
post-image
  • Reward
  • 2
  • Repost
  • Share
Sunday77:
2295 is the current last line of defense; once breached, a new round of deep decline will begin.
View More
🔥 Ethereum’s deep V-shaped washout has ended, and a new round of directional decision window is now open
It surged from 2382 and then got dumped down to a low of 2311, completing a round of extreme “liquidity trap” washout
The 30-minute line has stabilized at strong support along the lower Bollinger Band, while bearish MACD momentum continues to narrow
The KDJ indicator makes a golden cross from a low level and turns upward—short-term rebound and repair signals are being released
⚠️ But the key pressure is still heavy and suppressing price
All of the EMA5 and EMA10 short-term moving
ETH-0.52%
View Original
  • Reward
  • 1
  • Repost
  • Share
Sunday77:
This stabilization after a sharp decline is most likely to induce more buying. Do not open a full position to buy until it breaks above the short-term moving average.
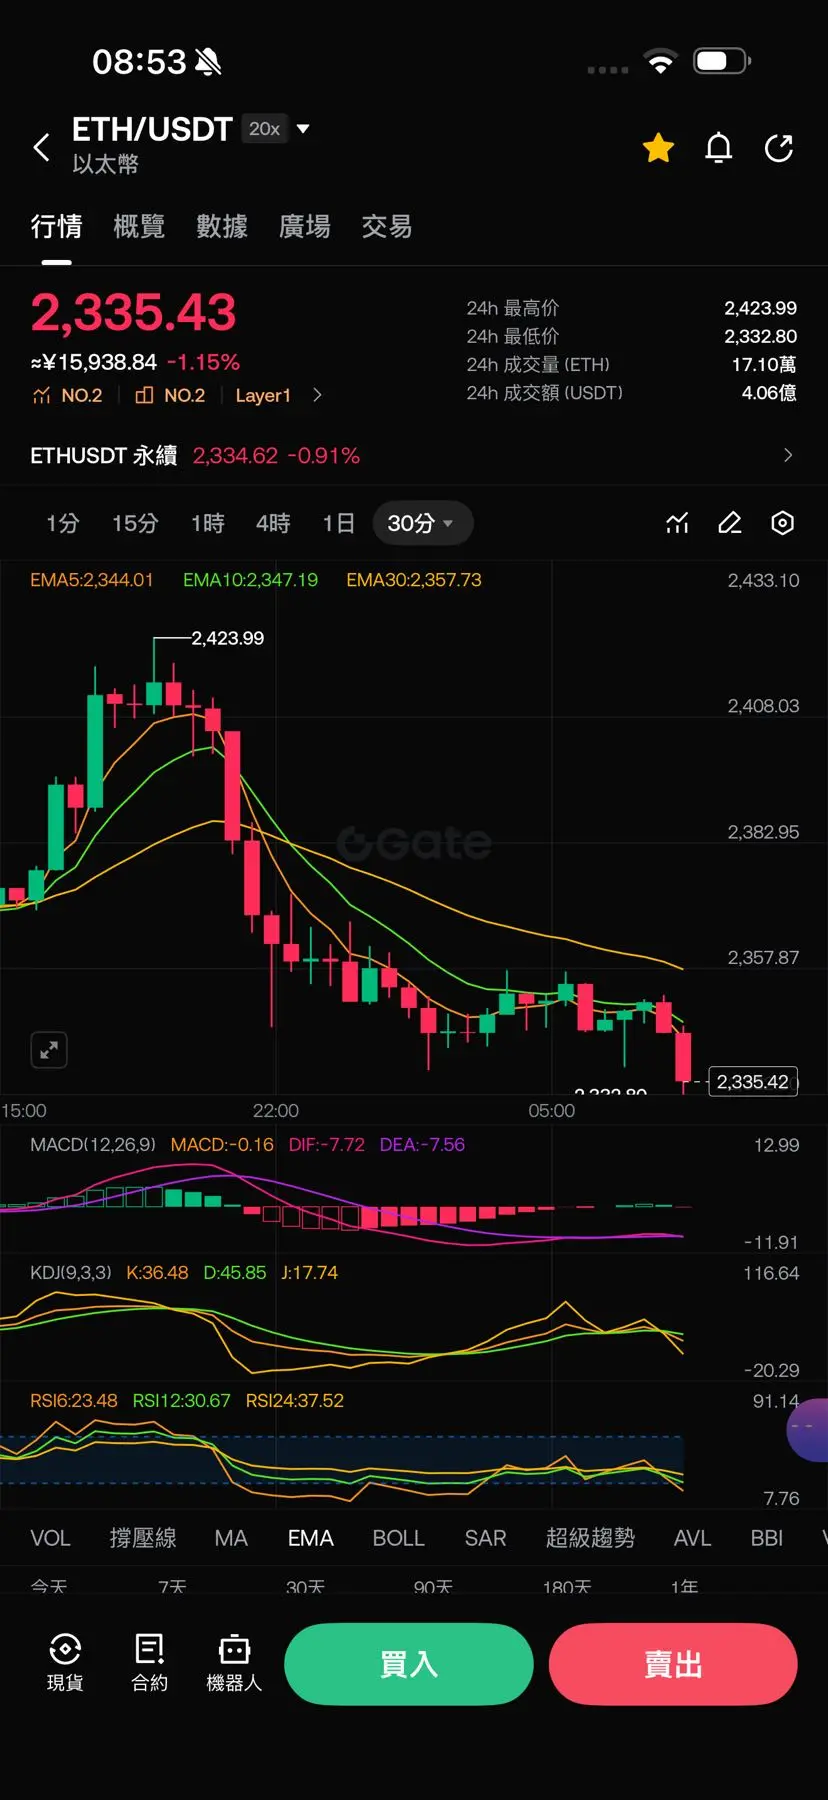
Ethereum experienced a cliff-like decline last night, dropping from the high of 2423 all the way down, directly breaking through all short-term moving averages.
The 30-minute chart shows a full bearish trend, with MACD continuously declining and RSI entering the oversold zone, with downward momentum completely unabated.
In this wave of one-sided trading, any attempt to catch a bottom midway will be ruthlessly harvested by the bears.
Currently, the price is stuck around 2335, with no signs of stabilization. Watching more and acting less is the only safe choice.
👉 Do you think this decline will
ETH-0.52%
View Original
post-image
  • Reward
  • 2
  • Repost
  • Share
Sunday77:
All short-term moving averages are trending downward; do not act lightly until stability is confirmed.
View More
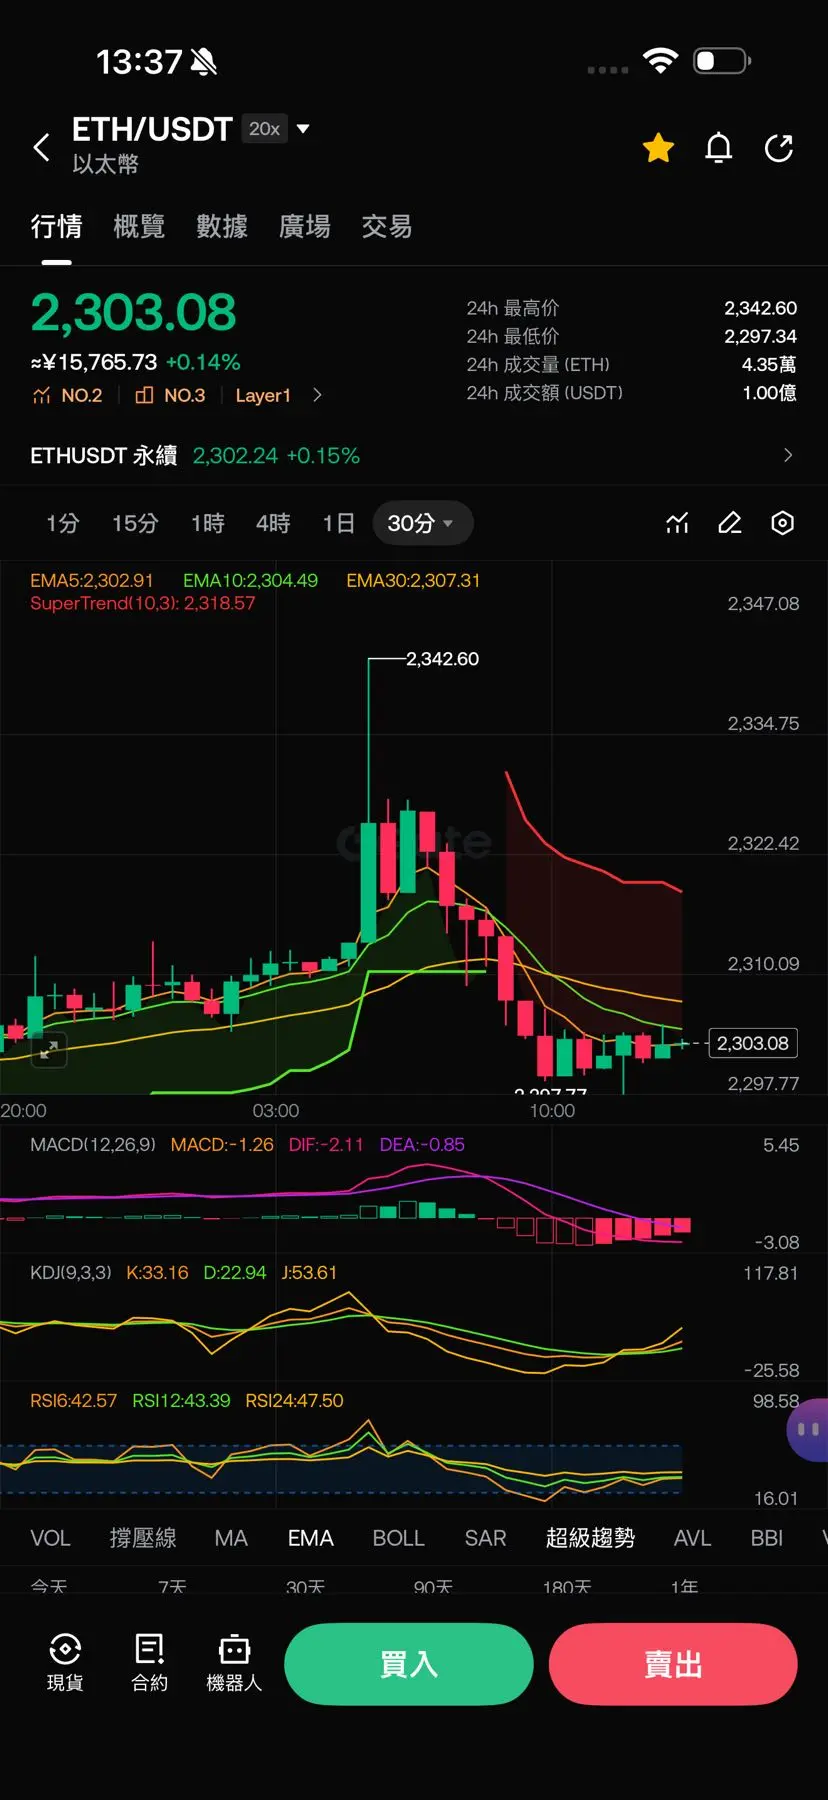
Ethereum surged and then pulled back today, almost perfectly synchronized with Bitcoin’s rhythm.
From 2342 crashing back to around 2300, it’s now stuck below the EMA5 and EMA10, with significant short-term pressure.
Both MACD and KDJ are still hovering at low levels. After being oversold, there has been a small rebound, but the momentum is clearly insufficient.
In this kind of highly correlated market, futures contracts are easily swept back and forth. Better to hold spot and just lie low, then wait until the direction becomes clear.
👉 Do you think Ethereum will first retrace to 2290, or will
BTC0.11%
ETH-0.52%
GT2.13%
View Original
post-image
  • Reward
  • 2
  • Repost
  • Share
Sunday77:
Now KDJ has already turned upward. If it stabilizes here, the probability of a rebound will be a bit higher.
View More
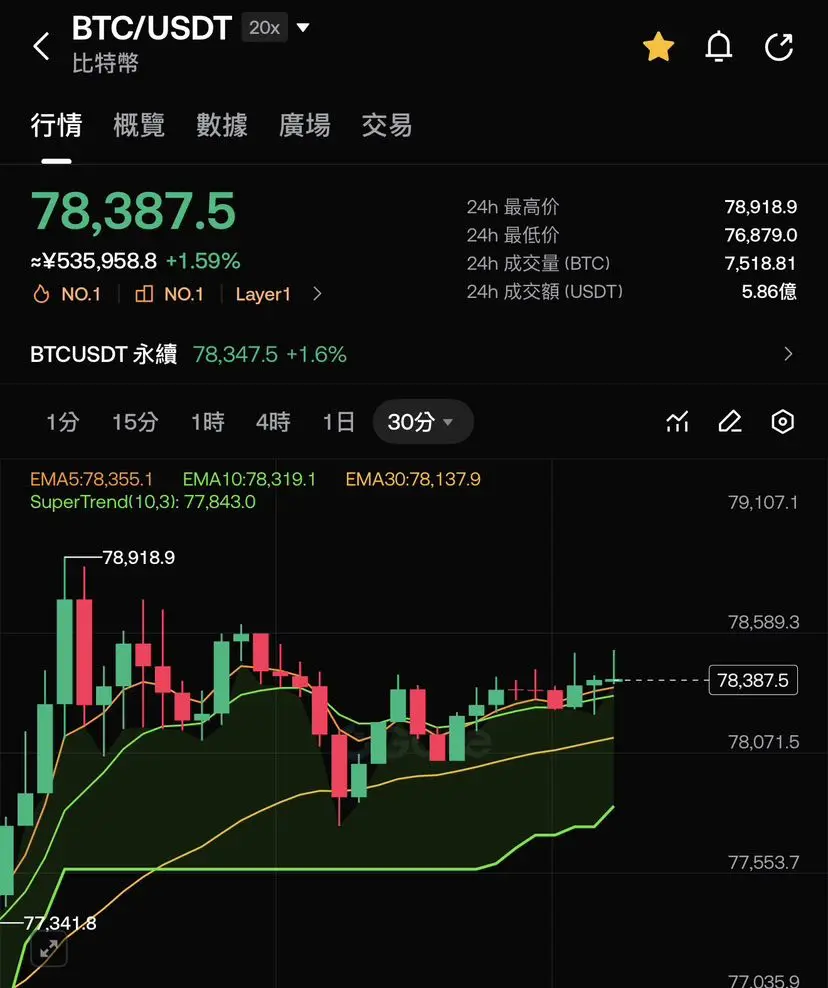
Bitcoin has stabilized above 78,000, and the short-term has been fluctuating slightly.
The current position is neither high nor low, making it difficult to trade both longs and shorts in the contract.
Rather than chasing the rise and fall and being swept back and forth, it's better to hold spot assets and wait patiently for a clear trend.
In trading, controlling your hands is more important than frequent operations.
Are you now holding spot assets without moving, or trading small positions to catch swings?
#BTC #现货思维 #震荡行情
BTC0.11%
View Original
post-image
  • Reward
  • 1
  • Repost
  • Share
Sunday77:
Currently, this position is sideways, and contracts are indeed easily swept back and forth; it's much more stable to hold spot assets with a buy-and-hold mentality. 😌
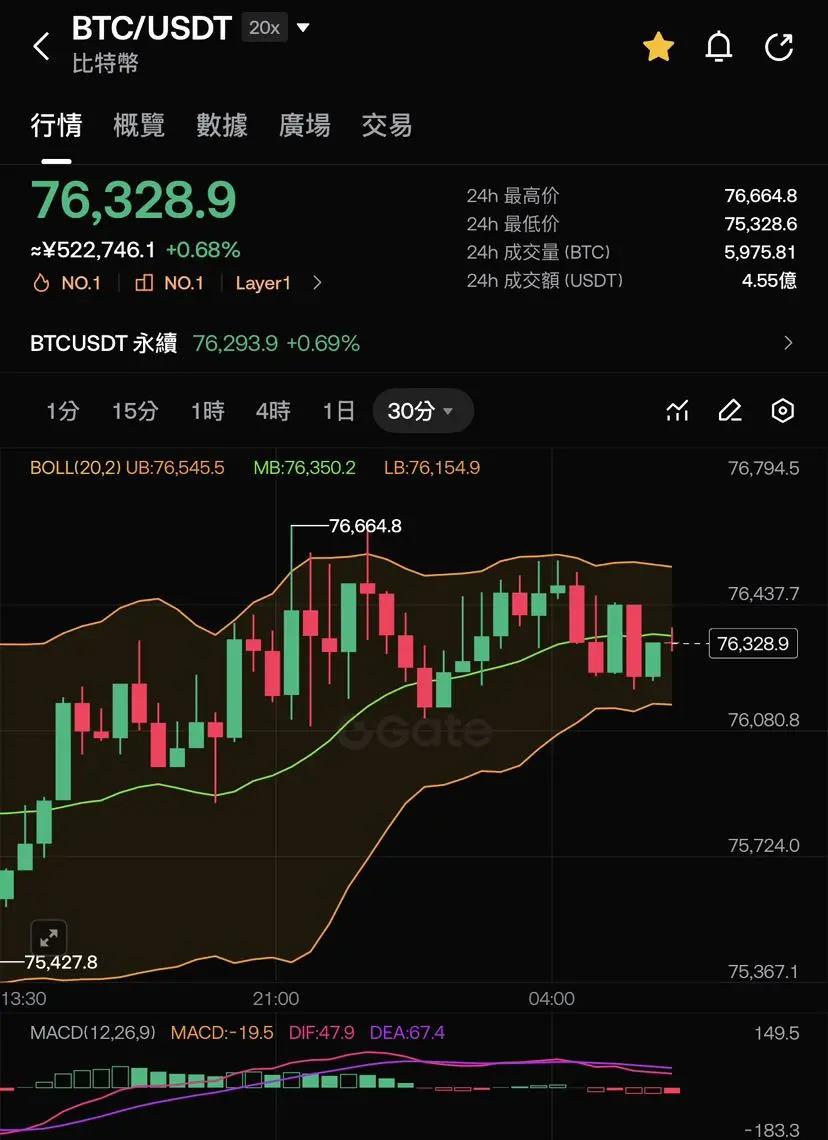
BTC is stuck getting caught in the 76,000–77,000 range, grinding back and forth—this kind of choppy, range-bound market is really exhausting.
Futures traders are getting swept back and forth to trigger stop-losses, and spot traders also find it easy to lose their nerve and not hold their positions.
Instead of chasing after price moves and making buy and sell decisions in the middle of the fluctuations, it’s better to wait patiently for a clear directional signal.
In trading, keeping control of yourself matters more than making frequent moves.
What do you think will break through first
BTC0.11%
ETH-0.52%
GT2.47%
View Original
post-image
  • Reward
  • 2
  • Repost
  • Share
Sunday77:
Indeed, this kind of sideways movement is the most exhausting. Not making reckless moves is actually the most stable; just be patient and wait for the direction. 😌
View More
  • Pinned