


# technicalanalysis
6.2万
XRP 蓄势待发,准备突破!🚀 别眨眼,因为未来几天可能为一次爆炸性走势奠定基础,打破近期横盘整理的格局。
目前交易价格在 1.0498 USDT 附近,$XRP 一直在悄然积聚动能,24小时内上涨0.66%。24小时高点1.0766 USDT 显示出韧性,暗示下方存在看涨压力。空头正在失去控制。
🎯 **短期目标(几天内):1.15 USDT - 1.20 USDT**
当前的直接障碍是1.07-1.08 USDT阻力区。如果价格有效突破并伴随持续放量站上该水平,将确认上行势头。我们在较低时间框架上看到吸筹模式,关键移动均线开始向上弯曲,预示着短期看涨收敛。坚定地收盘于1.08 USDT上方是触发信号。
📈 **中期目标(几周内):1.50 USDT,可能推向1.60 USDT**
一旦1.20 USDT转化为强支撑,上行空间将显著打开。下一个主要技术阻力位要到1.50-1.60 USDT区间。这一走势将由机构兴趣增加、对山寨币持续看好的市场情绪以及监管方面可能进一步明朗化所推动。链上指标显示长期持有者正在增持,表明坚定信念。
⚠️ **看空情况警惕:** 然而,我们必须保持警惕。如果价格决定性跌破并持续交易在心理关口1.00 USDT支撑位下方,将引发担忧,可能将XRP推回0.95 USDT区域。这很可能由大盘下跌或意外负面消息触发。
这不仅仅是炒作;技术面与潜在情绪都
目前交易价格在 1.0498 USDT 附近,$XRP 一直在悄然积聚动能,24小时内上涨0.66%。24小时高点1.0766 USDT 显示出韧性,暗示下方存在看涨压力。空头正在失去控制。
🎯 **短期目标(几天内):1.15 USDT - 1.20 USDT**
当前的直接障碍是1.07-1.08 USDT阻力区。如果价格有效突破并伴随持续放量站上该水平,将确认上行势头。我们在较低时间框架上看到吸筹模式,关键移动均线开始向上弯曲,预示着短期看涨收敛。坚定地收盘于1.08 USDT上方是触发信号。
📈 **中期目标(几周内):1.50 USDT,可能推向1.60 USDT**
一旦1.20 USDT转化为强支撑,上行空间将显著打开。下一个主要技术阻力位要到1.50-1.60 USDT区间。这一走势将由机构兴趣增加、对山寨币持续看好的市场情绪以及监管方面可能进一步明朗化所推动。链上指标显示长期持有者正在增持,表明坚定信念。
⚠️ **看空情况警惕:** 然而,我们必须保持警惕。如果价格决定性跌破并持续交易在心理关口1.00 USDT支撑位下方,将引发担忧,可能将XRP推回0.95 USDT区域。这很可能由大盘下跌或意外负面消息触发。
这不仅仅是炒作;技术面与潜在情绪都
XRP-0.29%
- 赞赏
- 6
- 8
- 转发
- 分享
Falcon_Official:
冲啊 🔥查看更多
🚨 HOME/USDT 抛物线式拉升遭遇剧烈拒绝 — 谨慎!
📊 关键数据:
• 当前价格:0.01639 USDT 📈(+21.68%)
• 爆发区间:24小时区间 0.01307 – 0.01842
• 24小时成交额:180 万 USDT
⚠️ 技术警报:
• 在 0.01842 处出现巨大拒绝影线 — 从高点数分钟内下跌 -11%
• EMA7(0.01637)& EMA14(0.01638)趋同 — 动能停滞
• 价格现已跌破 EMA7 — 短线看空翻转
• RSI 从超买降温:RSI6 49.38,RSI12 53.25,RSI24 56.34
🎯 关键价位:
• 强阻力:0.01842 USDT(拒绝影线高点)
• 直接支撑:0.01596 USDT(EMA28 底)
• 关键支撑:0.01351 USDT(拉升起点 — 重大跳空风险)
$HOME
💡 交易者洞察:
经典的拉高出货模式:+21% 急升,在 0.018 处遭拒,现正止血般下跌。RSI 与价格走势背离 = 薄弱。如果 0.016 跌破,可能会级联至 0.015。只有激进的短线交易者才应参与反弹 — 大多数交易者等待 0.014 的复测或新的底部形成。
#GateSquare #HOME #CryptoTrading #TechnicalAnalysis
📊 关键数据:
• 当前价格:0.01639 USDT 📈(+21.68%)
• 爆发区间:24小时区间 0.01307 – 0.01842
• 24小时成交额:180 万 USDT
⚠️ 技术警报:
• 在 0.01842 处出现巨大拒绝影线 — 从高点数分钟内下跌 -11%
• EMA7(0.01637)& EMA14(0.01638)趋同 — 动能停滞
• 价格现已跌破 EMA7 — 短线看空翻转
• RSI 从超买降温:RSI6 49.38,RSI12 53.25,RSI24 56.34
🎯 关键价位:
• 强阻力:0.01842 USDT(拒绝影线高点)
• 直接支撑:0.01596 USDT(EMA28 底)
• 关键支撑:0.01351 USDT(拉升起点 — 重大跳空风险)
$HOME
💡 交易者洞察:
经典的拉高出货模式:+21% 急升,在 0.018 处遭拒,现正止血般下跌。RSI 与价格走势背离 = 薄弱。如果 0.016 跌破,可能会级联至 0.015。只有激进的短线交易者才应参与反弹 — 大多数交易者等待 0.014 的复测或新的底部形成。
#GateSquare #HOME #CryptoTrading #TechnicalAnalysis
HOME1.21%
- 赞赏
- 点赞
- 评论
- 转发
- 分享
📊 $XLM (STELLAR)技术分析与新闻汇总 | 2026年7月14日
🔸 当前价格走势
XLM目前的交易价格约为$0.18,过去一周下跌约7%-10%,距其历史最高点$0.876(2018)约低79%。市值约为62亿美元,按市值对XLM的排名在#17 。
📉 关键技术位
- 7天区间:$0.1777(低点)到$0.1941(高点)——XLM在一个紧缩的压缩区间内横盘整理
- 支撑:当前支撑位在$0.177–$0.18附近;若跌破下方,可能面临重新测试更深的2026年低点
- 阻力:$0.19–$0.194限制了近期反弹
- 图表结构:一些技术观察者认为XLM处于一个跨越数年的压缩模式之内,并正逐步酝酿最终的突破——方向仍不明确。更广泛的技术面仍偏看空:卖方掌握优势,不过近期价格走势表明抛压有所缓和,但尚未确认反转
📈 动能
XLM最近展现出一些相对强势的片段——在大盘CoinDesk 20指数下跌的日子里上涨10%,并在6月中旬日本加息之后与比特币一起反弹。但在下跌日它也同样领跌,这反映出该代币仍高度关联于更广泛的市场波动,而非表现出独立的趋势强度。值得注意的是,近期98%的Coinbase用户为净买入——这是一种情绪信号,不过并不能保证价格走势。
📰 新闻摘要
- PayPal的PYUSD稳定币扩展到Stellar网络——为Stellar的支付通道新增了重要的稳
🔸 当前价格走势
XLM目前的交易价格约为$0.18,过去一周下跌约7%-10%,距其历史最高点$0.876(2018)约低79%。市值约为62亿美元,按市值对XLM的排名在#17 。
📉 关键技术位
- 7天区间:$0.1777(低点)到$0.1941(高点)——XLM在一个紧缩的压缩区间内横盘整理
- 支撑:当前支撑位在$0.177–$0.18附近;若跌破下方,可能面临重新测试更深的2026年低点
- 阻力:$0.19–$0.194限制了近期反弹
- 图表结构:一些技术观察者认为XLM处于一个跨越数年的压缩模式之内,并正逐步酝酿最终的突破——方向仍不明确。更广泛的技术面仍偏看空:卖方掌握优势,不过近期价格走势表明抛压有所缓和,但尚未确认反转
📈 动能
XLM最近展现出一些相对强势的片段——在大盘CoinDesk 20指数下跌的日子里上涨10%,并在6月中旬日本加息之后与比特币一起反弹。但在下跌日它也同样领跌,这反映出该代币仍高度关联于更广泛的市场波动,而非表现出独立的趋势强度。值得注意的是,近期98%的Coinbase用户为净买入——这是一种情绪信号,不过并不能保证价格走势。
📰 新闻摘要
- PayPal的PYUSD稳定币扩展到Stellar网络——为Stellar的支付通道新增了重要的稳
XLM2.91%
- 赞赏
- 3
- 2
- 转发
- 分享
MSTF30:
2026 GOGOGO 👊查看更多
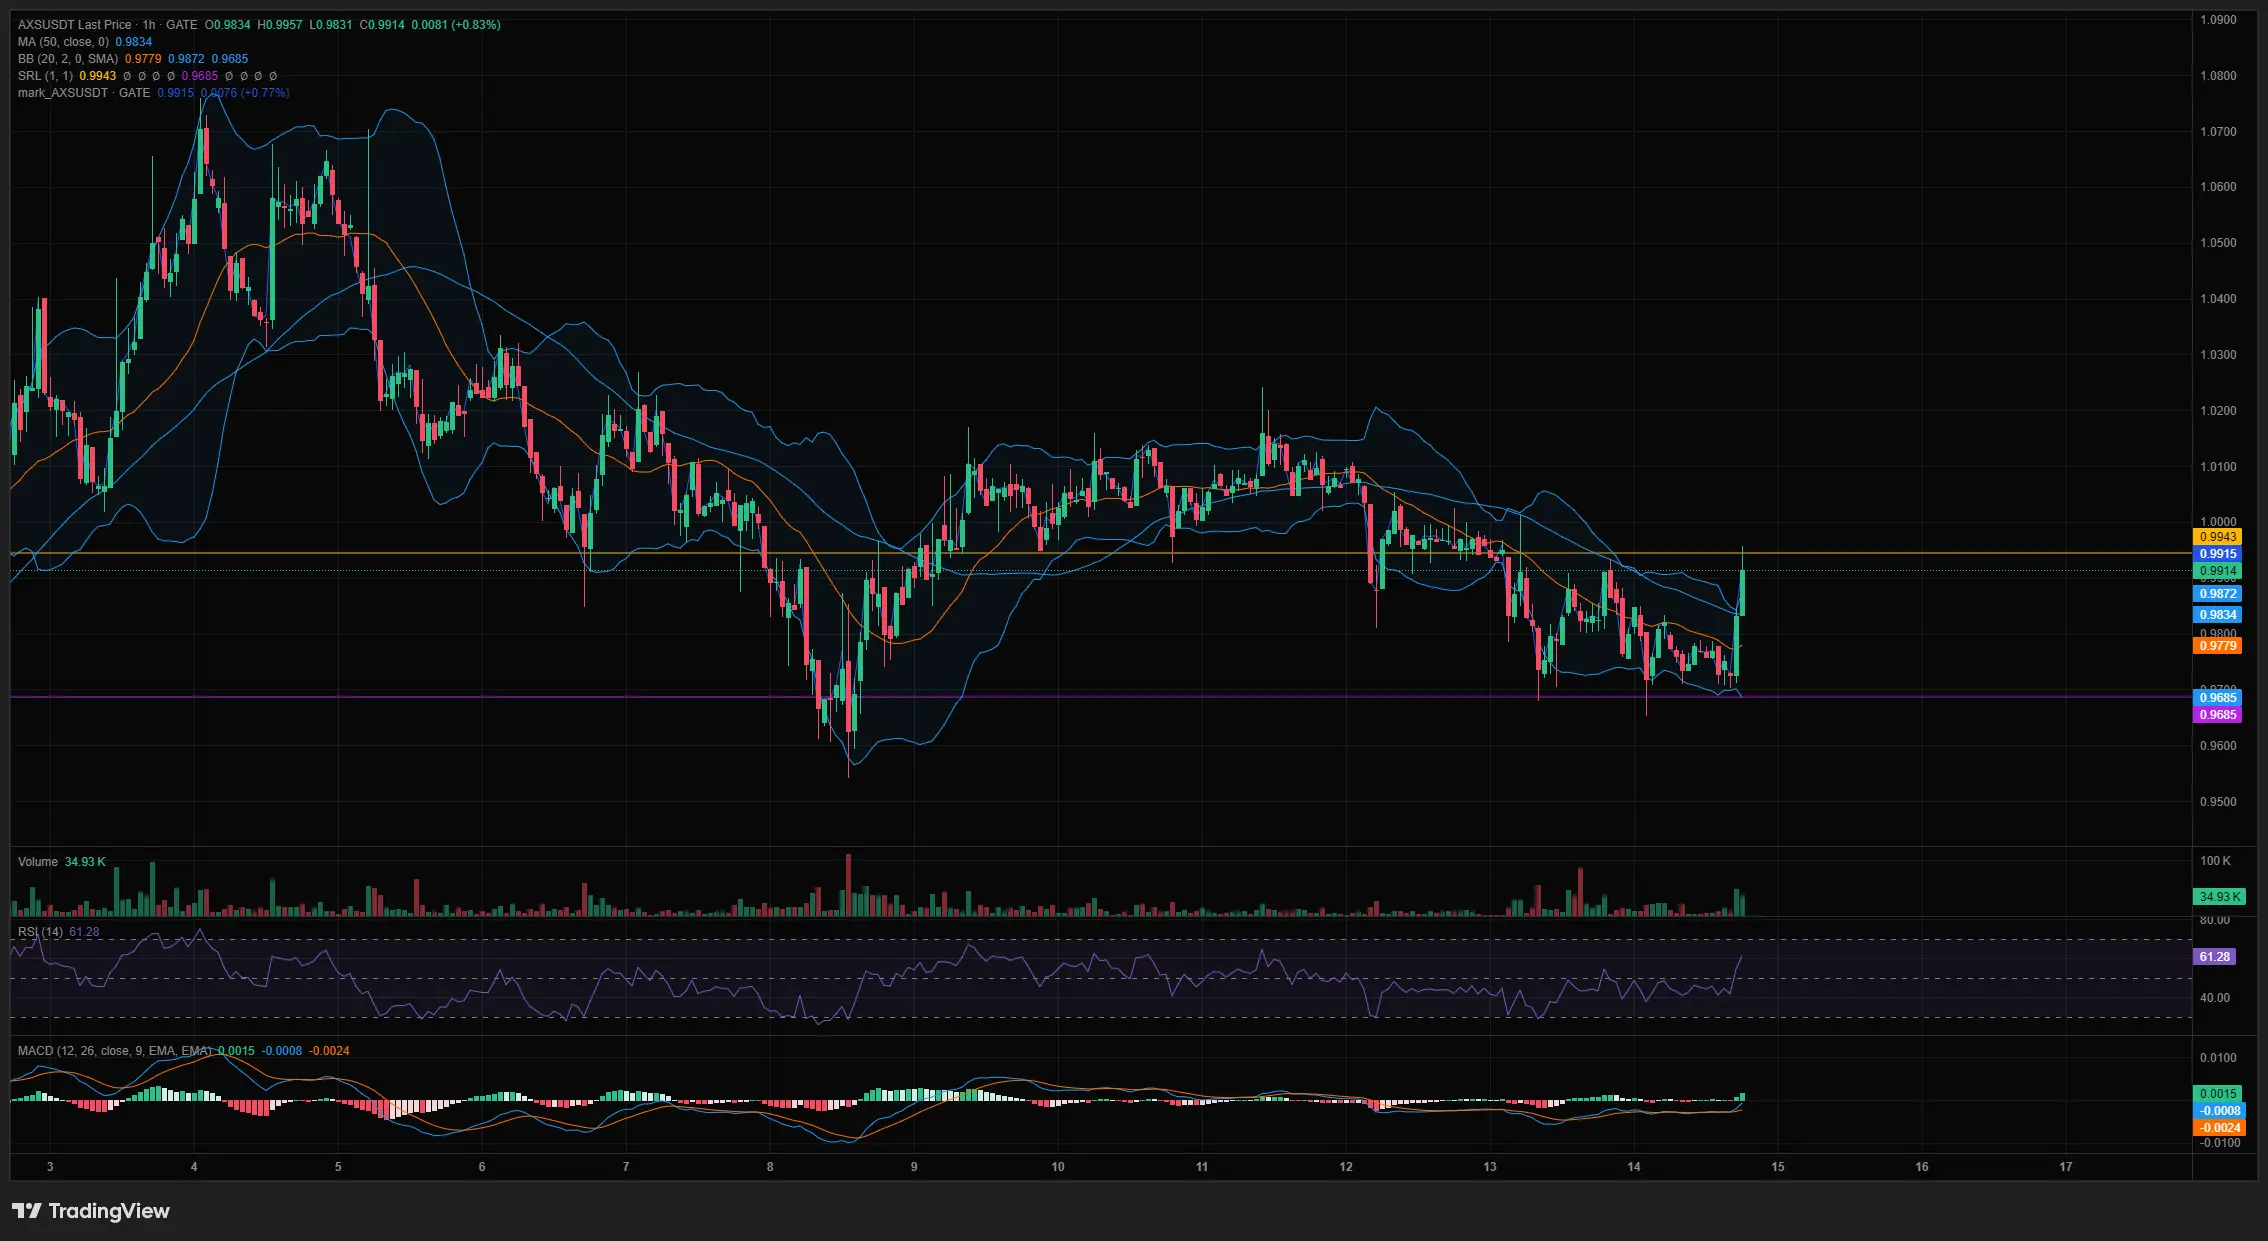
$AXS/USDT
多头 10X
进场:0.993
目标:
TP1:1.0029
TP2:1.0129
TP3:1.0327
TP4:1.0526
TP5:1.0824
TP6:1.1122
止损:0.922
风险:仅使用少量资金。
#gatesquare #TechnicalAnalysis $ASX
多头 10X
进场:0.993
目标:
TP1:1.0029
TP2:1.0129
TP3:1.0327
TP4:1.0526
TP5:1.0824
TP6:1.1122
止损:0.922
风险:仅使用少量资金。
#gatesquare #TechnicalAnalysis $ASX
ASX-2.75%
- 赞赏
- 7
- 18
- 转发
- 分享
ybaser:
奔向月球 🌕查看更多
我一直在仔细研究图表,而我的观点和当前市场情绪有点不同。
虽然许多交易者都期待再次出现强劲反弹,但技术面显示需要谨慎。价格刚刚触及 79.68 附近的主要阻力区域,在 1 小时周期上,Supertrend 已转为看跌。截至目前,每一次反弹都遭遇了卖压。
就我个人而言,我非常关注 77.07 这个水平。如果价格在确认的情况下跌破它,我会留意潜在的做空机会,因为这可能引发一波流动性,并增强下行动能。
当然,没有任何设置是有保证的,因此风险管理仍然是首要任务。保护你的资金同样重要,找到下一笔交易也同样重要。
这只是我的市场展望——不构成财务建议。在做出交易决定之前,请务必进行你自己的分析。
#Crypto #Trading #TechnicalAnalysis #PriceAction #RiskManagement
查看原文虽然许多交易者都期待再次出现强劲反弹,但技术面显示需要谨慎。价格刚刚触及 79.68 附近的主要阻力区域,在 1 小时周期上,Supertrend 已转为看跌。截至目前,每一次反弹都遭遇了卖压。
就我个人而言,我非常关注 77.07 这个水平。如果价格在确认的情况下跌破它,我会留意潜在的做空机会,因为这可能引发一波流动性,并增强下行动能。
当然,没有任何设置是有保证的,因此风险管理仍然是首要任务。保护你的资金同样重要,找到下一笔交易也同样重要。
这只是我的市场展望——不构成财务建议。在做出交易决定之前,请务必进行你自己的分析。
#Crypto #Trading #TechnicalAnalysis #PriceAction #RiskManagement
- 赞赏
- 1
- 评论
- 转发
- 分享
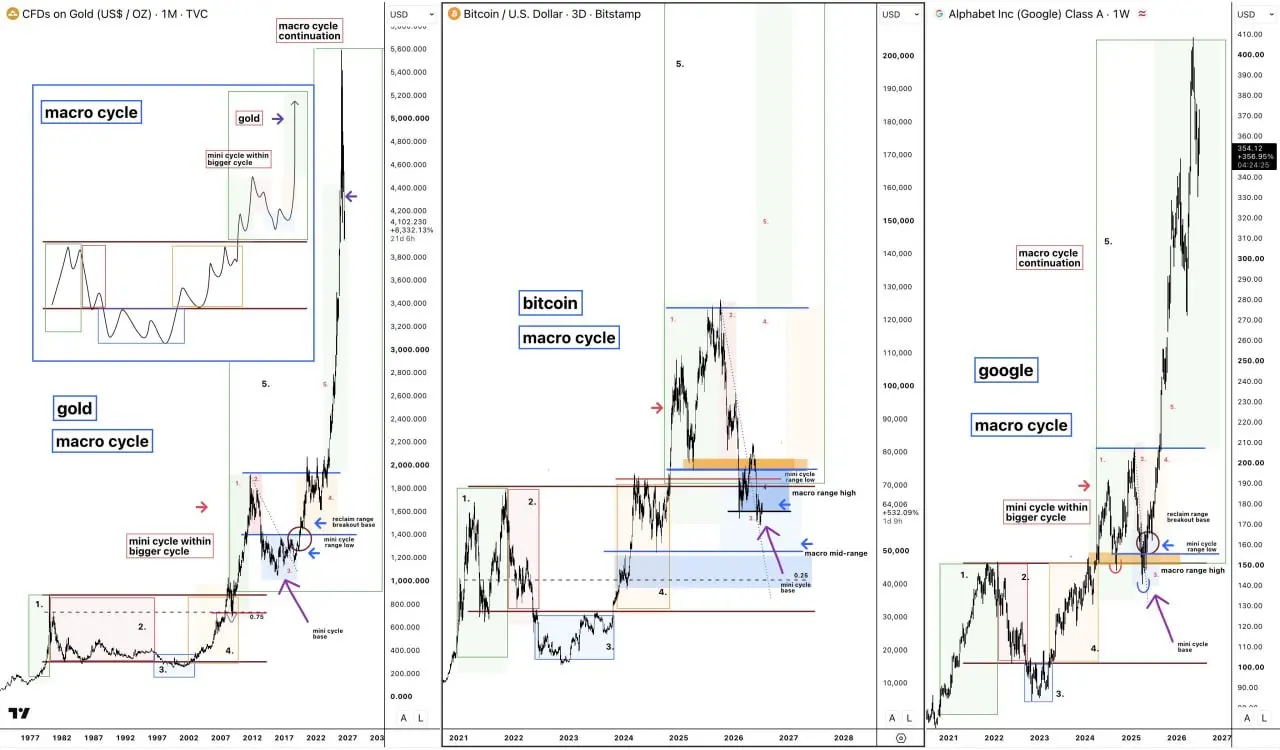
比特币是否正在走我们已经见过的某种模式?
三个截然不同的市场也许在讲述同一个故事。
黄金、比特币和 Google 都呈现了极其相似的宏观结构。
每一个都完成了长期的积累。
每一个都突破了一个重要的阻力区间。
每一个随后都回到测试那次突破。
每一个接着在下一轮扩张之前,进入了更小的盘整。
▸ 比特币目前的交易价格在其已重新夺回的宏观区间之上,而不是失守它。
▸ 最近的回调仍然停留在这一区间的重新夺回结构之内,从而保持了更高周期的趋势不变。
▸ 之前在黄金和 Google 中,也曾出现过类似的突破—回踩序列,然后才进入最强的延续阶段。
从这一点来看,重点不应放在短期的修正上。
更重要的问题是,先前的阻力是否继续充当支撑。
这往往是强势趋势用来证明自己的地方。
让我印象最深的是,不同资产类别之间的市场结构竟然如此相似。
资产不同。
但心理并没有不同。
市场常常会经历同样的积累、突破、回踩与扩张循环。
如果比特币继续遵守这种结构,那么当前的盘整可能是在为下一步做准备,而非走弱。
没有任何模式能保证未来。
但当相同的宏观蓝图出现在多个市场时,就值得关注。
$BTC #Bitcoin #Crypto #TechnicalAnalysis #Trading
三个截然不同的市场也许在讲述同一个故事。
黄金、比特币和 Google 都呈现了极其相似的宏观结构。
每一个都完成了长期的积累。
每一个都突破了一个重要的阻力区间。
每一个随后都回到测试那次突破。
每一个接着在下一轮扩张之前,进入了更小的盘整。
▸ 比特币目前的交易价格在其已重新夺回的宏观区间之上,而不是失守它。
▸ 最近的回调仍然停留在这一区间的重新夺回结构之内,从而保持了更高周期的趋势不变。
▸ 之前在黄金和 Google 中,也曾出现过类似的突破—回踩序列,然后才进入最强的延续阶段。
从这一点来看,重点不应放在短期的修正上。
更重要的问题是,先前的阻力是否继续充当支撑。
这往往是强势趋势用来证明自己的地方。
让我印象最深的是,不同资产类别之间的市场结构竟然如此相似。
资产不同。
但心理并没有不同。
市场常常会经历同样的积累、突破、回踩与扩张循环。
如果比特币继续遵守这种结构,那么当前的盘整可能是在为下一步做准备,而非走弱。
没有任何模式能保证未来。
但当相同的宏观蓝图出现在多个市场时,就值得关注。
$BTC #Bitcoin #Crypto #TechnicalAnalysis #Trading
BTC-0.88%
- 赞赏
- 8
- 3
- 转发
- 分享
晚风借贷人:
这种跨资产的形态共振确实少见,不过别忘了一点:结构相似不代表时间尺度相同,耐心点查看更多
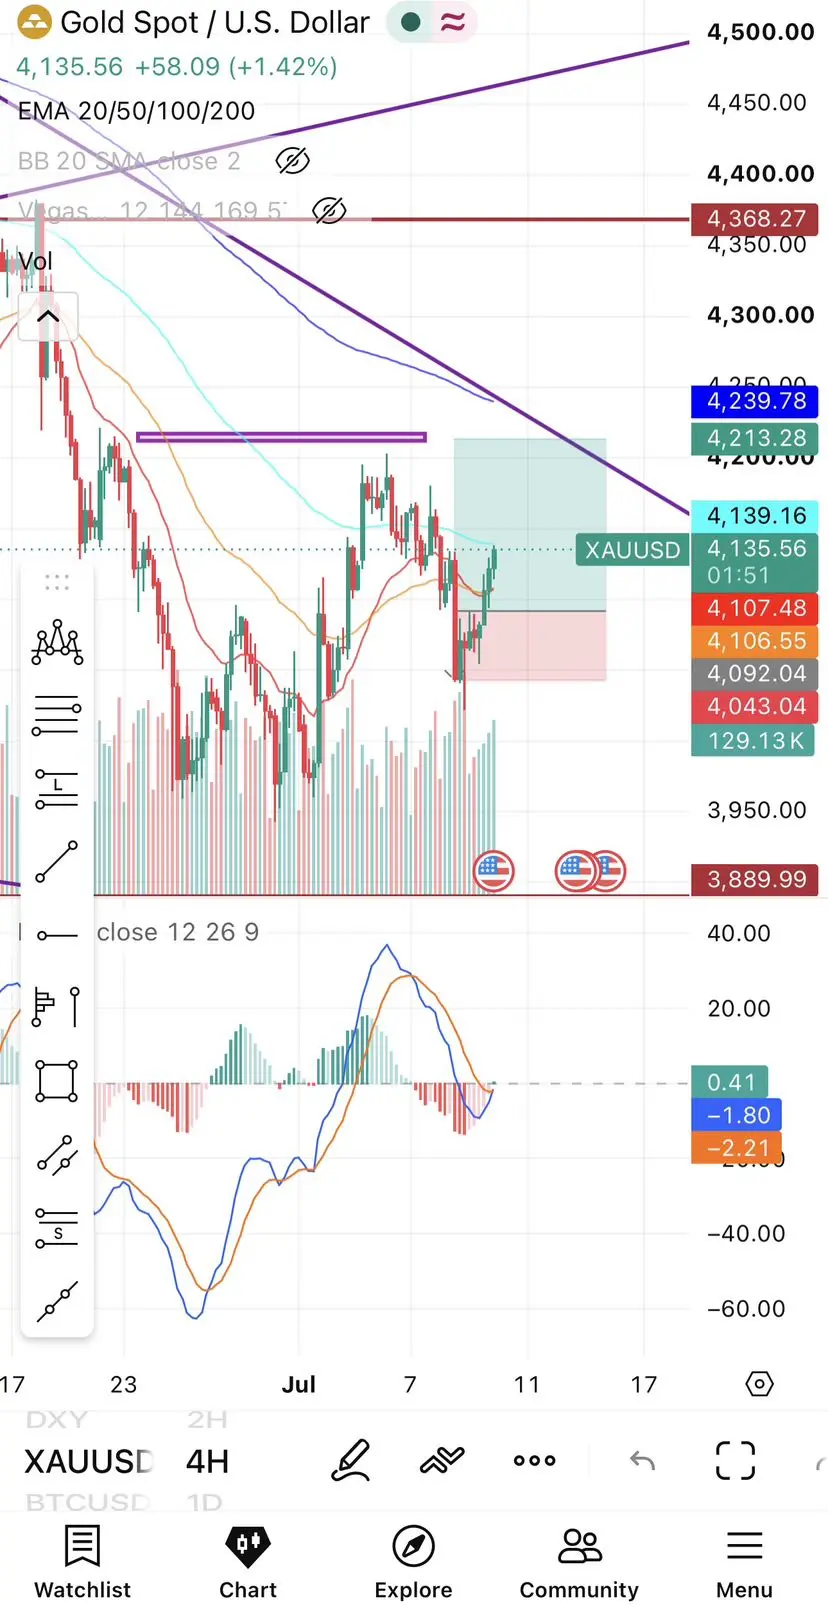
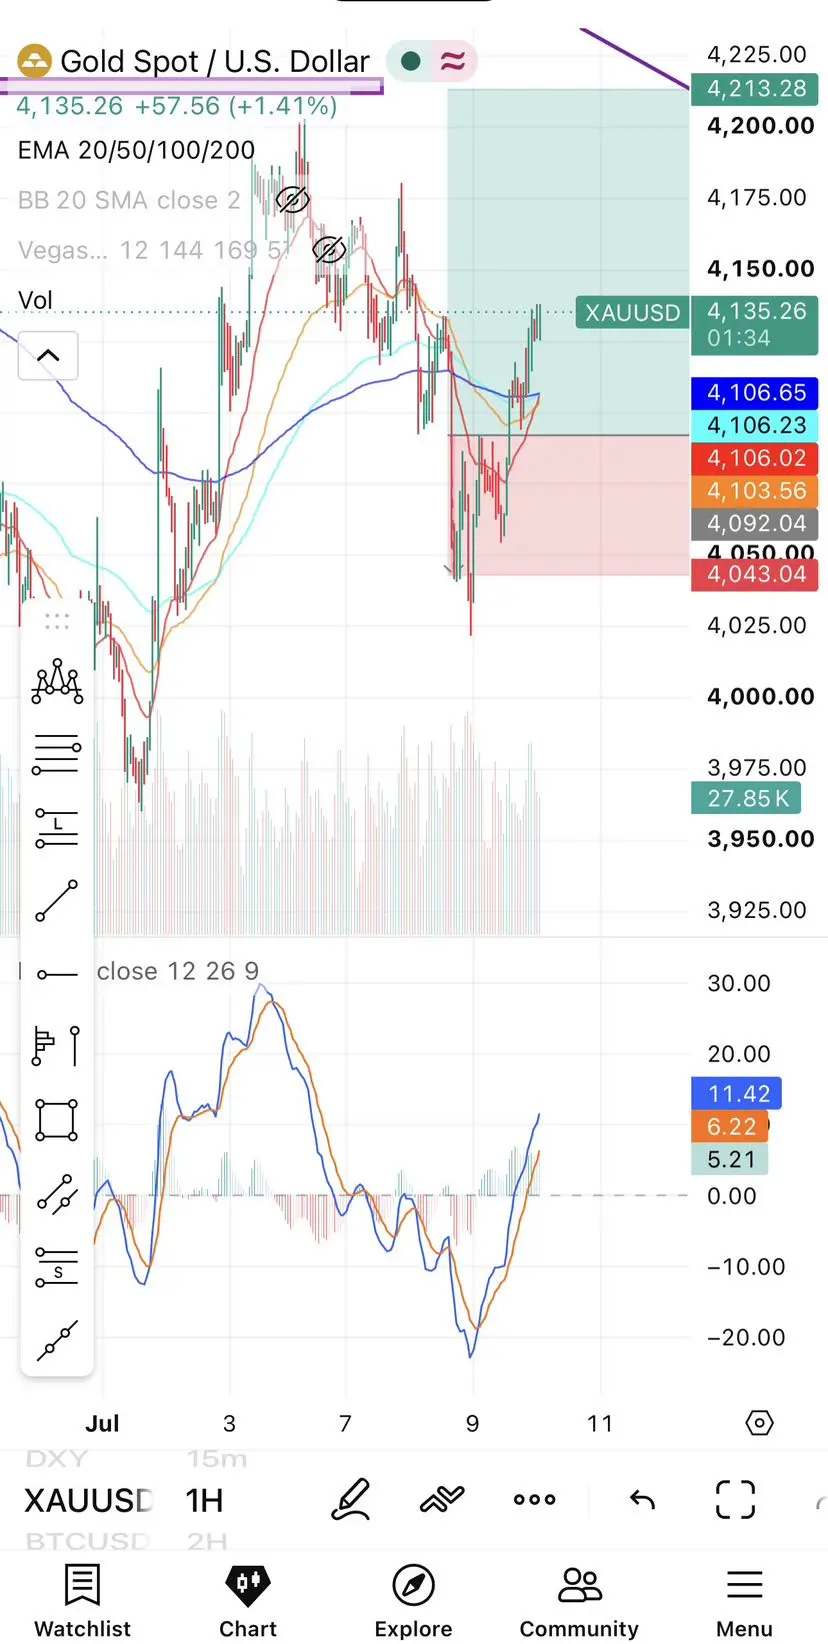
黄金可能已完成短期反转。不过,不要追逐绿色K线。
短期看涨结构正在形成。
📈 如果下一次回调伴随更低的成交量,并守住前一次摆动低点,我将继续寻找做多机会。
关键上行目标:
• 前一次摆动高点
• 0.618 斐波那契阻力
• 4H EMA200(多重阻力汇合)
确认 > 预测。
你会在 EMA200 附近止盈,还是等待确认后的突破?👀
#Gold #XAUUSD #Trading #TechnicalAnalysis #PriceAction $XAUUSD
短期看涨结构正在形成。
📈 如果下一次回调伴随更低的成交量,并守住前一次摆动低点,我将继续寻找做多机会。
关键上行目标:
• 前一次摆动高点
• 0.618 斐波那契阻力
• 4H EMA200(多重阻力汇合)
确认 > 预测。
你会在 EMA200 附近止盈,还是等待确认后的突破?👀
#Gold #XAUUSD #Trading #TechnicalAnalysis #PriceAction $XAUUSD
XAUUSD-0.69%
- 赞赏
- 1
- 评论
- 转发
- 分享
🚀 $EGLD 正在突破——多元宇宙正在觉醒?
刚刚在 Gate.io 上捕捉到:
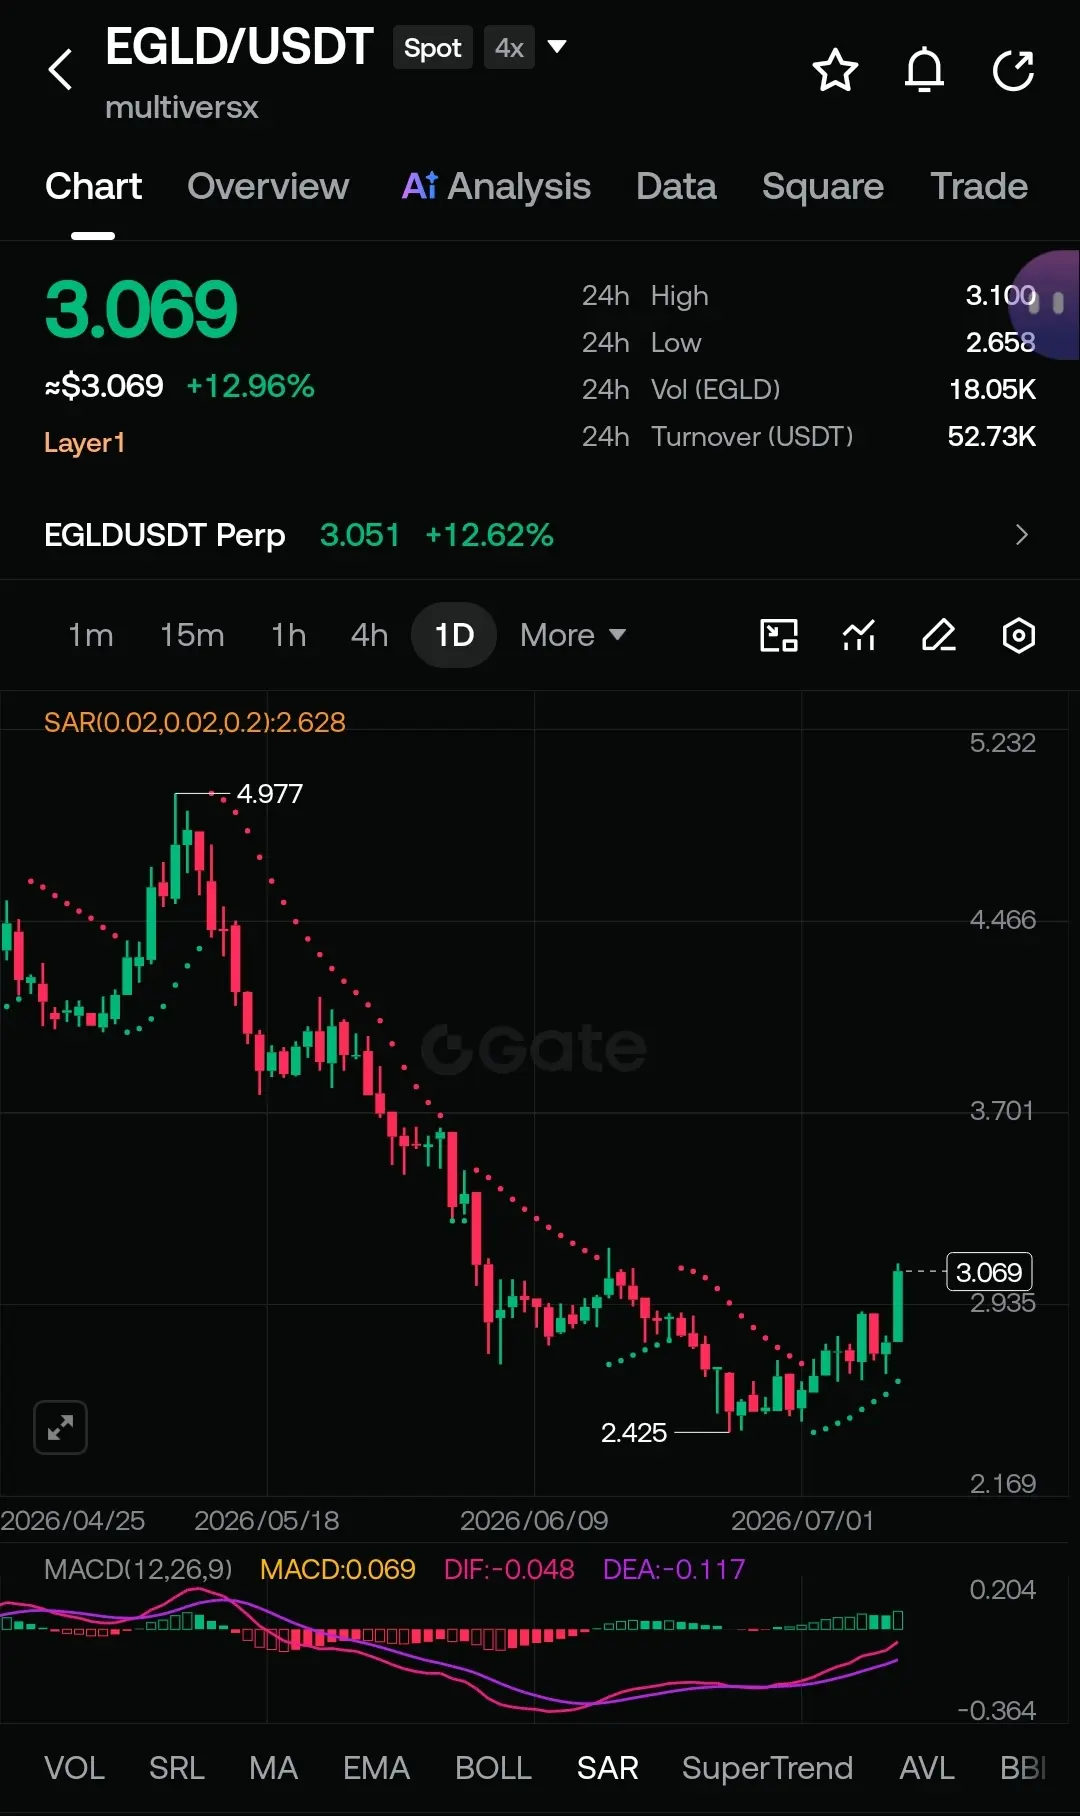
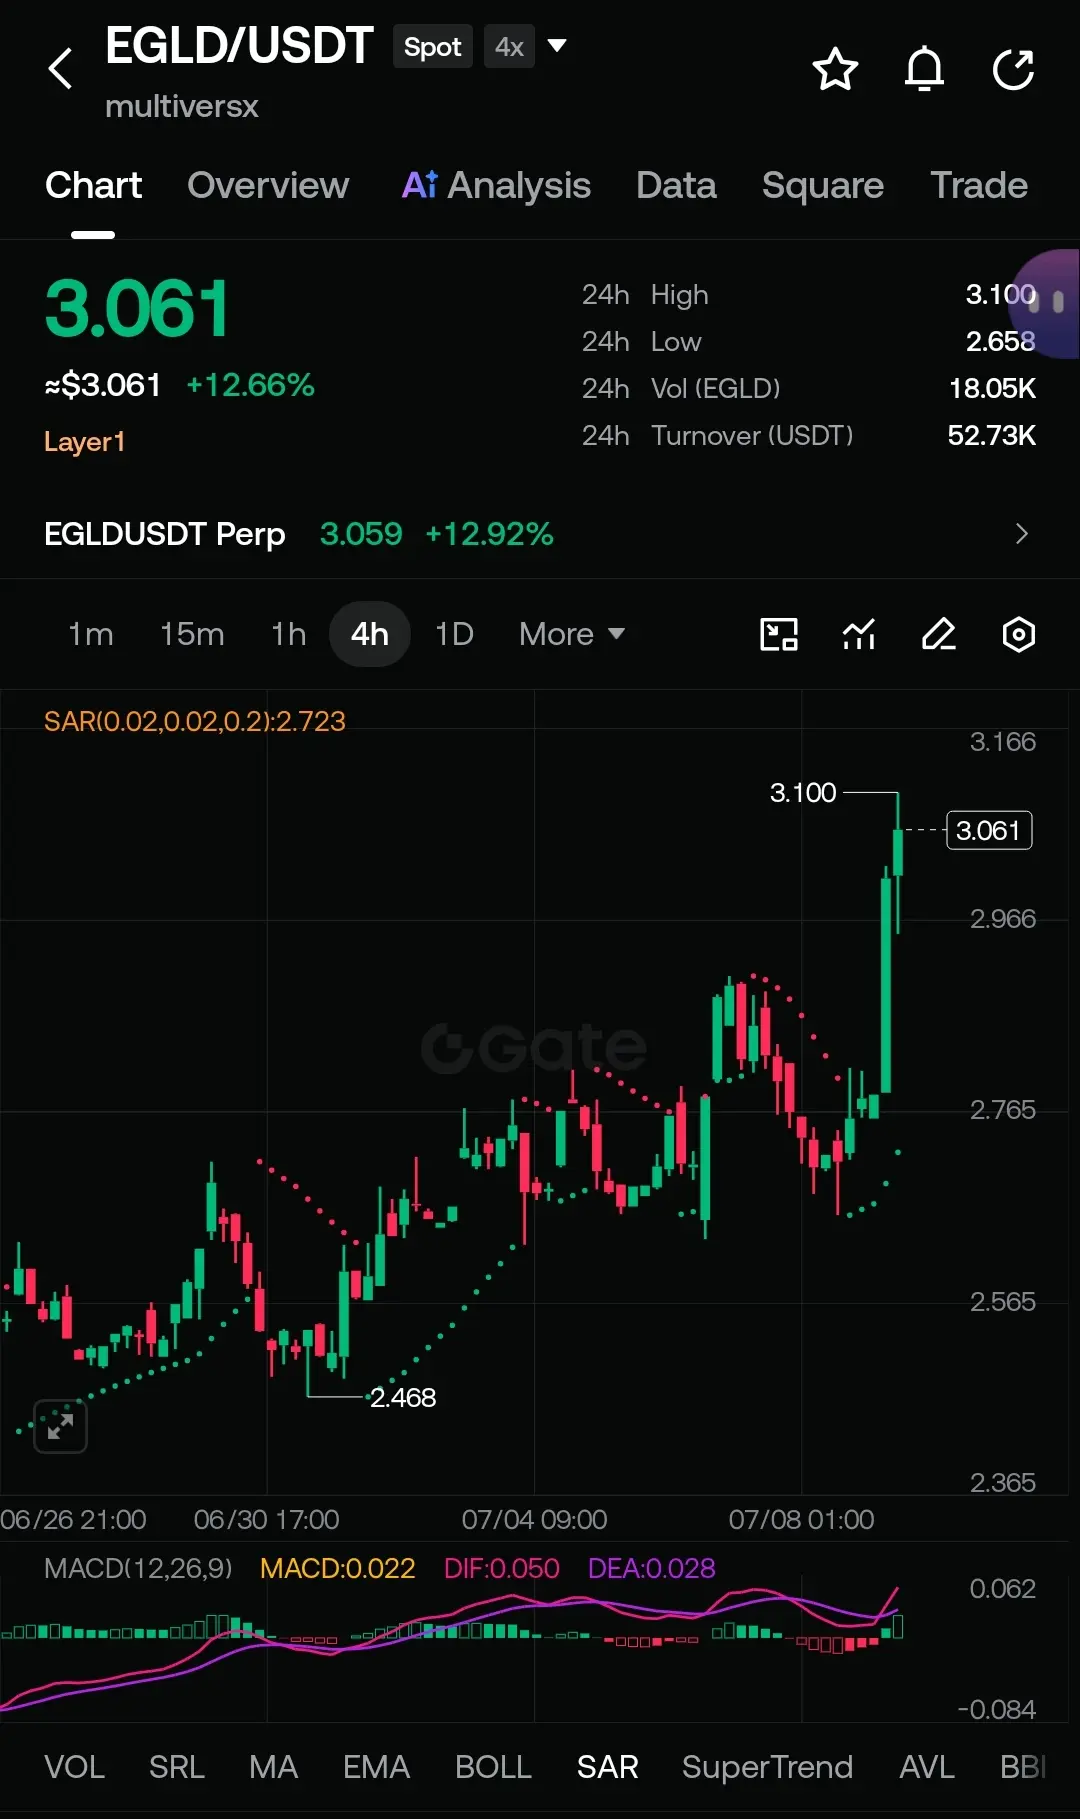
EGLD/USDT 24 小时内上涨 +12.9%,突破阻力位,在 4 小时图上收出一根强劲的绿色蜡烛——目前位于 3.06–3.07 美元。
图表在告诉我们什么:
4 小时时间框架:从 2.65 美元低点爆发至 3.10 美元高点。强劲的看涨动能,SAR 转为支撑,MACD 向上翘起且柱状图在构筑。
日线时间框架:经典复苏形态。在经历今年早些时候从约 5.00 美元高点暴跌后,EGLD 已形成更高的低点,并正在强势收复失地。成交量确认了这一走势。
这并非噪音——这是在一个终于显现风险偏好情绪的市场中教科书式的更高低点 + 突破形态。
需要关注的关键水平:
阻力位:3.10–3.25 美元(突破后将继续上行)
支撑位:2.85–2.95 美元区域(任何回调都应守住)
下一个主要目标(若延续):3.50–4.00 美元
EGLD 始终是技术上最扎实的 Layer-1 项目之一,拥有实际应用(Maiar、DeFi、NFT 以及惊人的吞吐量)。一旦启动,它就是真涨。
我们是否正在见证多元宇宙叙事中下一轮上涨的开端?👀
你对 EGLD 本轮周期的目标价是多少?在下方留下。
#EGLD #Elrond #Crypto #Altseason #TechnicalAnalysis
刚刚在 Gate.io 上捕捉到:
EGLD/USDT 24 小时内上涨 +12.9%,突破阻力位,在 4 小时图上收出一根强劲的绿色蜡烛——目前位于 3.06–3.07 美元。
图表在告诉我们什么:
4 小时时间框架:从 2.65 美元低点爆发至 3.10 美元高点。强劲的看涨动能,SAR 转为支撑,MACD 向上翘起且柱状图在构筑。
日线时间框架:经典复苏形态。在经历今年早些时候从约 5.00 美元高点暴跌后,EGLD 已形成更高的低点,并正在强势收复失地。成交量确认了这一走势。
这并非噪音——这是在一个终于显现风险偏好情绪的市场中教科书式的更高低点 + 突破形态。
需要关注的关键水平:
阻力位:3.10–3.25 美元(突破后将继续上行)
支撑位:2.85–2.95 美元区域(任何回调都应守住)
下一个主要目标(若延续):3.50–4.00 美元
EGLD 始终是技术上最扎实的 Layer-1 项目之一,拥有实际应用(Maiar、DeFi、NFT 以及惊人的吞吐量)。一旦启动,它就是真涨。
我们是否正在见证多元宇宙叙事中下一轮上涨的开端?👀
你对 EGLD 本轮周期的目标价是多少?在下方留下。
#EGLD #Elrond #Crypto #Altseason #TechnicalAnalysis
EGLD-6.01%
- 赞赏
- 3
- 2
- 转发
- 分享
Tm_Crypto:
分析得很好查看更多
📊 Gate.io 技术洞察:$DOGS 是否准备迎来重大突破?🚀
Telegram 原生生态代币 $DOGS 在4小时和日线图上显示出高度战术性设置。在经受宏观修正之后,多头正在主要水平需求区附近悄悄构建结构。让我们深入图表,解读聪明钱的足迹。🧵👇
📉 宏观结构与关键区域
$DOGS 在长期横盘整理后已进入一个明确的吸筹通道。关键边界被严密防守:
🟢 终极需求区($0.000036 – $0.000039):这是终极的"逢低买入"吸筹口袋。每次对该基线的测试都引发了买家的立即吸收,形成了稳固的高低位足迹。
🔴 看跌阻力天花板($0.000045 – $0.000050):直接战场。要将宏观结构转为强烈看涨,买家必须清理直接位于这一上方供应区的空头流动性。
📈 技术指标蓝图
- 移动平均线(MA/EMA):在短期时间框架(4小时)上,5日和50日移动平均线开始向上倾斜,为局部反弹提供直接动态支撑。关注200日移动平均线——重新收复该水平将确认结构性宏观反转。
- RSI(相对强弱指数):目前舒适地处于55-59的中性-看涨区间。与之前将代币拖入严重超买的爆发性走势不同,当前的冷却确保了上行延续有巨大的空间和喘息余地。
- CVD 与 MACD 背离:虽然累计成交量差(CVD)显示散户在盘整,但MACD柱状图在较低时间框架上正在形成局部看涨背离,暗示着剧
Telegram 原生生态代币 $DOGS 在4小时和日线图上显示出高度战术性设置。在经受宏观修正之后,多头正在主要水平需求区附近悄悄构建结构。让我们深入图表,解读聪明钱的足迹。🧵👇
📉 宏观结构与关键区域
$DOGS 在长期横盘整理后已进入一个明确的吸筹通道。关键边界被严密防守:
🟢 终极需求区($0.000036 – $0.000039):这是终极的"逢低买入"吸筹口袋。每次对该基线的测试都引发了买家的立即吸收,形成了稳固的高低位足迹。
🔴 看跌阻力天花板($0.000045 – $0.000050):直接战场。要将宏观结构转为强烈看涨,买家必须清理直接位于这一上方供应区的空头流动性。
📈 技术指标蓝图
- 移动平均线(MA/EMA):在短期时间框架(4小时)上,5日和50日移动平均线开始向上倾斜,为局部反弹提供直接动态支撑。关注200日移动平均线——重新收复该水平将确认结构性宏观反转。
- RSI(相对强弱指数):目前舒适地处于55-59的中性-看涨区间。与之前将代币拖入严重超买的爆发性走势不同,当前的冷却确保了上行延续有巨大的空间和喘息余地。
- CVD 与 MACD 背离:虽然累计成交量差(CVD)显示散户在盘整,但MACD柱状图在较低时间框架上正在形成局部看涨背离,暗示着剧
DOGS-1.34%

- 赞赏
- 1
- 评论
- 转发
- 分享
加载更多
加入 4000 万人汇聚的头部社区
⚡️ 与 4000 万 人一起参与加密货币热潮讨论
💬 与喜爱的头部博主互动
👍 查看感兴趣的内容
热门话题
121.7万 热度
2.68万 热度
64.97万 热度
90.76万 热度
2915.03万 热度
36.29万 热度
1.46亿 热度
28.8万 热度
154.25万 热度
4.58万 热度
置顶