#GateSquareMayTradingShare
🧪 $LAB/USDT – DeFi宝石升温?看涨结构完好!
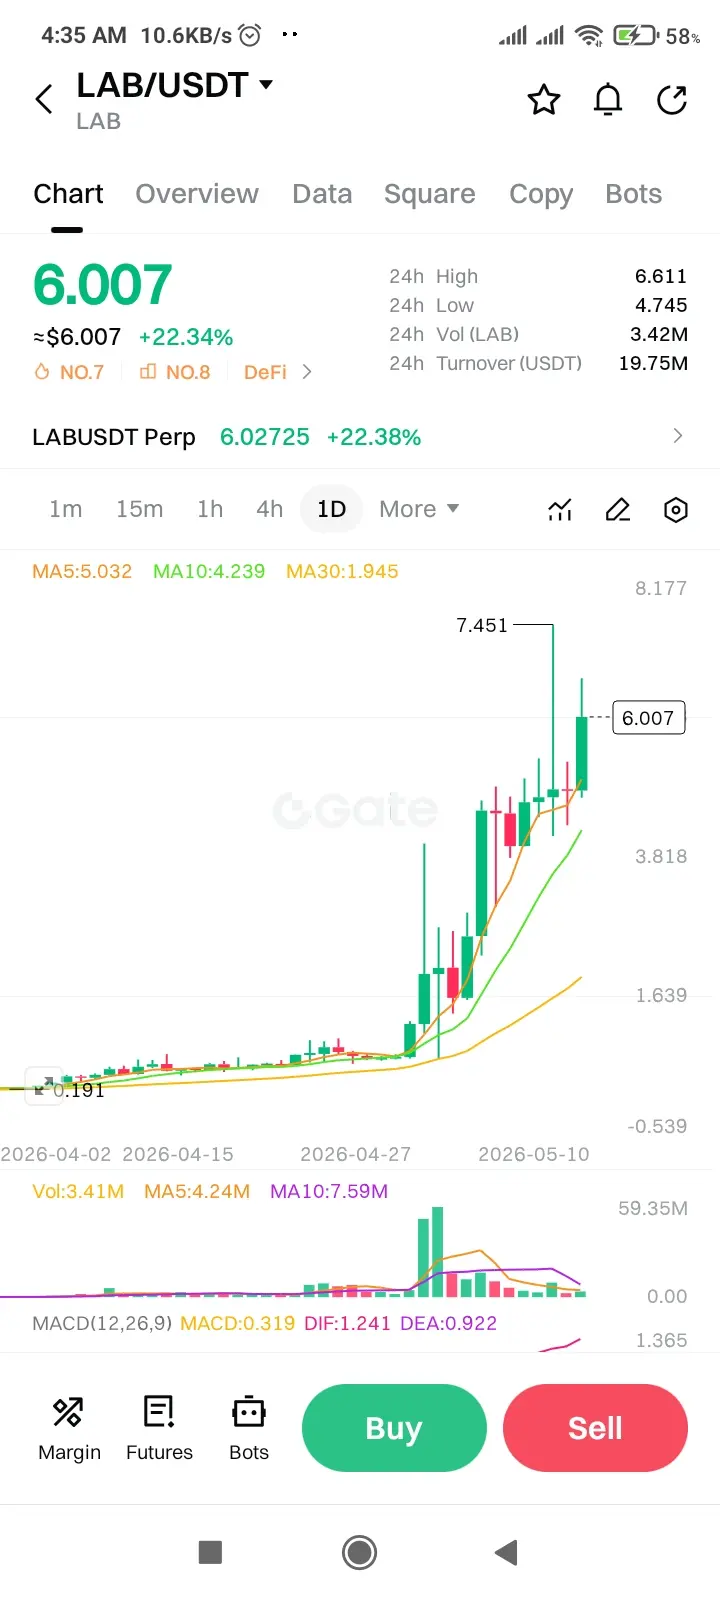
📍 当前价格:$6.007
📈 **24小时变化:** **+22.34%**
🏷️ **排名:** #7 涨幅榜 🔺 | #8 DeFi
⛽ **24小时最高:** $6.611 | 24小时最低:$4.745
📊 **24小时交易量(LAB):** 3.42M | **成交额:** 19.75M USDT
🔁 **永续合约:** $6.02725 (+22.38%)
---
🔍 技术分析
🕯️ 价格走势
· 价格从$4.745**上涨到**$6.611(+39%)。
· 小幅回调后,目前以$6.00作为心理支撑。
📈 移动平均线(MA)
· MA5:5.032
· MA10:4.239
· MA30:1.945
· ✅ 完美的多头排列:MA5 > MA10 > MA30
· 价格远高于所有均线 – 强劲的上涨趋势。
📉 MACD(12,26,9)
· MACD线:0.319
· DIF:1.241
· DEA:0.922
· ✅ 多头金叉确认 – 动能上升。
📊 成交量
· 当前成交量:3.41M
· MA5成交量:4.24M
· MA10成交量:7.59M
· ⚠️ 成交量略有缩减 – 留意再度放量。
---
🎯 关键支撑与阻力位
支撑 阻力
$5.03(MA5) $6.61(24H最高)
$4.74(24H最低) $7.45(下一个阻力位)
$4.24(MA10) –
---
⚡ 交易策略(短期)
看涨情景:
· 站稳$6.00** → 重新测试**$6.61 → 突破目标$7.45+
看跌情景:
· 失守$5.03** → 下探**$4.74–$4.24支撑区。
---
🧠 最后想法
LAB处于清晰的上升趋势中,MA结构强劲,MACD确认。DeFi标签增强了叙事力度。然而,成交量正从高点回落 – 若能重新放量至5M以上,将确认趋势延续。
✅ 非投资建议。风险管理,理性交易。
🧪 $LAB/USDT – DeFi宝石升温?看涨结构完好!
📍 当前价格:$6.007
📈 **24小时变化:** **+22.34%**
🏷️ **排名:** #7 涨幅榜 🔺 | #8 DeFi
⛽ **24小时最高:** $6.611 | 24小时最低:$4.745
📊 **24小时交易量(LAB):** 3.42M | **成交额:** 19.75M USDT
🔁 **永续合约:** $6.02725 (+22.38%)
---
🔍 技术分析
🕯️ 价格走势
· 价格从$4.745**上涨到**$6.611(+39%)。
· 小幅回调后,目前以$6.00作为心理支撑。
📈 移动平均线(MA)
· MA5:5.032
· MA10:4.239
· MA30:1.945
· ✅ 完美的多头排列:MA5 > MA10 > MA30
· 价格远高于所有均线 – 强劲的上涨趋势。
📉 MACD(12,26,9)
· MACD线:0.319
· DIF:1.241
· DEA:0.922
· ✅ 多头金叉确认 – 动能上升。
📊 成交量
· 当前成交量:3.41M
· MA5成交量:4.24M
· MA10成交量:7.59M
· ⚠️ 成交量略有缩减 – 留意再度放量。
---
🎯 关键支撑与阻力位
支撑 阻力
$5.03(MA5) $6.61(24H最高)
$4.74(24H最低) $7.45(下一个阻力位)
$4.24(MA10) –
---
⚡ 交易策略(短期)
看涨情景:
· 站稳$6.00** → 重新测试**$6.61 → 突破目标$7.45+
看跌情景:
· 失守$5.03** → 下探**$4.74–$4.24支撑区。
---
🧠 最后想法
LAB处于清晰的上升趋势中,MA结构强劲,MACD确认。DeFi标签增强了叙事力度。然而,成交量正从高点回落 – 若能重新放量至5M以上,将确认趋势延续。
✅ 非投资建议。风险管理,理性交易。