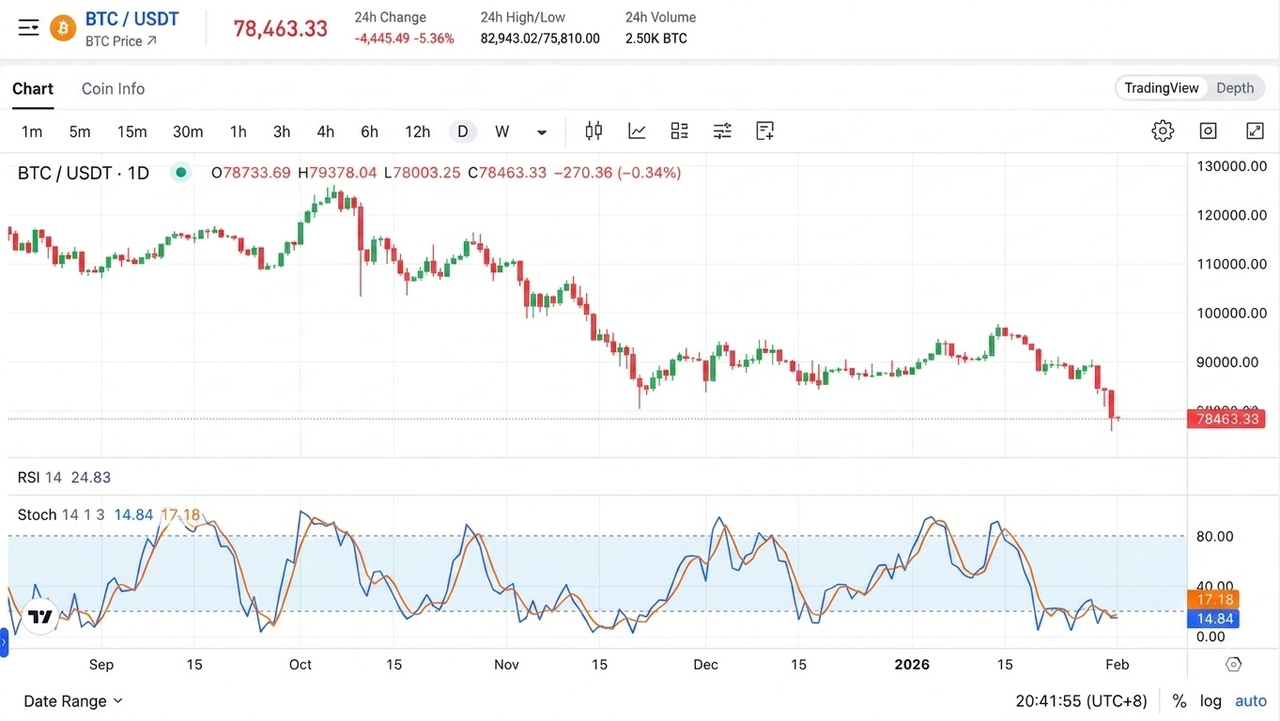
The Stochastic Oscillator is a bounded momentum indicator that measures the position of a closing price relative to the highest and lowest prices over a selected period. It was developed and popularized by George Lane in the 1950s and is based on the idea that momentum often changes before price direction changes. The indicator is commonly displayed below a price chart as two lines: %K and %D.
For beginners, the Stochastic Oscillator is useful because it converts recent price movement into a simple 0–100 scale. This makes it easier to see whether price is closing near the top, middle, or bottom of its recent range.
[Credit: Trading View]
What the Stochastic Oscillator Is
The Stochastic Oscillator is a technical analysis tool that shows whether an asset is closing near the high or low of its recent price range.
It belongs to the family of momentum oscillators. Unlike a trend line or moving average, it does not directly show whether price is rising or falling over the long term. Instead, it focuses on the strength and position of recent closes.
The indicator usually appears as two lines:
-
%K: the faster line and the main stochastic reading.
-
%D: a smoother line, usually calculated as a moving average of %K.
The Stochastic Oscillator is bounded between 0 and 100. A reading near 100 means the latest close is near the top of the recent range. A reading near 0 means the latest close is near the bottom of the recent range.
This structure makes the indicator especially common in range-bound markets, where prices move between visible support and resistance areas. In strong trending markets, however, the same readings can be harder to interpret.
How %K and %D Are Calculated
The %K line is the core calculation of the Stochastic Oscillator. It compares the current closing price with the highest high and lowest low over a chosen lookback period.
A common default setting is 14 periods, although traders may adjust this depending on the market and timeframe.
The standard formula is:
%K = [(Current Close − Lowest Low) / (Highest High − Lowest Low)] × 100
Where:
-
Current Close is the latest closing price.
-
Lowest Low is the lowest price over the lookback period.
-
Highest High is the highest price over the lookback period.
If the latest close is at the top of the range, %K will be close to 100. If it is at the bottom of the range, %K will be close to 0. If it is in the middle, %K will be around 50.
The %D line is usually a three-period simple moving average of %K. It smooths the faster %K line and acts as a signal line. Because %D is slower, it can help reduce some of the noise that appears when %K moves quickly.

Many charting tools also offer “fast,” “slow,” and “full” stochastic settings. These versions mainly differ in how much smoothing is applied. For beginners, the key idea is simple: %K is the faster measurement, while %D is the smoother reference line.
Reading Stochastic Crossovers
A stochastic crossover happens when the %K line crosses the %D line.
Because %K reacts more quickly to recent price changes, its movement above or below %D can suggest a short-term momentum shift. This does not guarantee a price reversal, but it can show that recent closing behavior has changed.
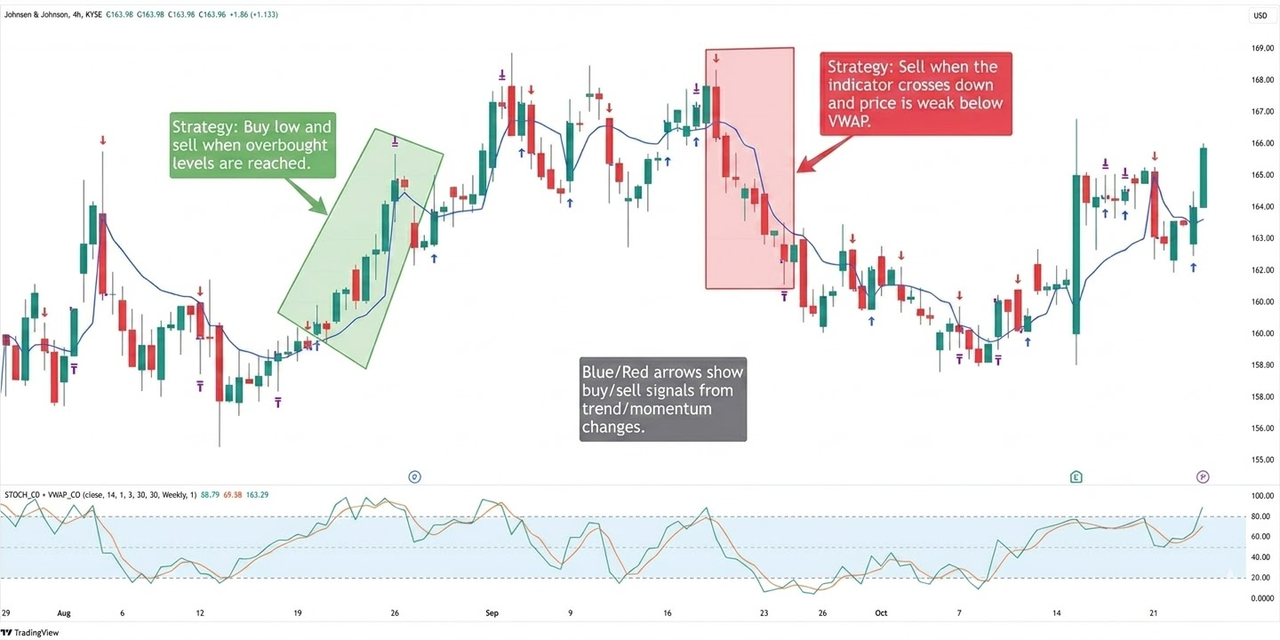
A bullish crossover occurs when %K crosses above %D. Traders often read this as a sign that upward momentum may be improving, especially if the crossover happens after the oscillator has been in a low range.
A bearish crossover occurs when %K crosses below %D. This may suggest that upward momentum is weakening or that downward pressure is increasing, especially if it occurs after the oscillator has been in a high range.
The location of the crossover matters. A crossover near the middle of the 0–100 scale is usually less meaningful than one that forms near an extreme zone. This is why many traders combine crossovers with overbought and oversold readings.
However, crossovers should not be read as standalone instructions. They are signals about momentum, not confirmations of future price direction.
Overbought and Oversold Zones in Stochastic
The Stochastic Oscillator is usually interpreted with two common zones:
An overbought reading means price has been closing near the top of its recent range. An oversold reading means price has been closing near the bottom of its recent range. These levels are widely used in technical analysis, but they require context.
A common beginner misunderstanding is to assume that overbought means “price must fall” and oversold means “price must rise.” That is not always true.
In a strong uptrend, the Stochastic Oscillator can remain above 80 for a long time while price continues rising. In a strong downtrend, it can remain below 20 while price continues falling.
The more careful interpretation is that extreme readings show strong recent positioning within the range. Overbought means the close is repeatedly near the top of the range. Oversold means the close is repeatedly near the bottom.
This is why many traders wait for both an extreme reading and a crossover before interpreting a possible momentum change.
[Credit: Trading View]
Stochastic vs RSI: Key Behavioral Differences
The Stochastic Oscillator and the Relative Strength Index, or RSI, are both momentum oscillators. They are often used to identify overbought and oversold conditions, but they measure momentum differently.
The Stochastic Oscillator compares the latest closing price with the recent high-low range. It asks: “Where did price close within its recent range?”
The RSI compares the magnitude of recent gains with recent losses. It asks: “How strong have recent upward moves been compared with downward moves?”
Because of this difference, stochastic readings tend to be more sensitive. The Stochastic Oscillator can move quickly between high and low zones, especially in short-term or choppy markets. RSI is often smoother and may be easier to read for broader trend strength.
For example, stochastic may reach an overbought zone if price closes near the high of its recent range, even if the wider trend is not especially strong. RSI may remain closer to neutral if the size of recent gains and losses is balanced.
| Feature |
Stochastic Oscillator |
Relative Strength Index (RSI) |
| Core Concept |
Closing price vs recent range |
Magnitude of gains vs losses |
| Key Question |
Where did price close within its range? |
How strong is buying vs selling? |
| Sensitivity |
High (reacts quickly) |
Moderate (smoother movement) |
| Signal Frequency |
More frequent |
Less frequent |
| Best Use Case |
Short-term timing, choppy markets |
Trend strength, broader momentum confirmation |
| Behavior in Ranging Markets |
Very active, frequent signals |
Stable, fewer fluctuations |
| Behavior in Trends |
Can give early but noisy signals |
More reliable for confirming strength |
This behavioral difference explains why traders often use the Stochastic Oscillator for short-term timing and RSI for broader momentum confirmation. Neither indicator is inherently superior; they answer related but different questions.
Limitations of the Stochastic Oscillator
The Stochastic Oscillator has several limitations that beginners should understand before relying on it.
First, it can produce false signals in strong trends. A market can remain overbought or oversold longer than expected. In these cases, trying to trade every extreme reading can lead to repeated misinterpretation.
Second, it can create whipsaws in choppy conditions. Because %K is sensitive, it may cross %D frequently without a meaningful price move following the signal.
Third, stochastic signals depend heavily on settings. A shorter lookback period reacts faster but creates more noise. A longer lookback period is smoother but may respond later.
Fourth, the indicator does not explain why price is moving. It does not account for news, liquidity, market structure, macro conditions, or changes in trading volume unless these are analyzed separately.
Finally, it is not a complete strategy. The Stochastic Oscillator is better understood as one tool within a broader analytical framework. Many traders combine it with support and resistance, trend analysis, moving averages, or volume indicators to reduce weak signals.
Conclusion
The Stochastic Oscillator is a beginner-friendly momentum indicator that shows where an asset’s closing price sits within its recent high-low range. Its main line, %K, reacts quickly to price position, while %D smooths %K to help identify possible momentum shifts.
The indicator is commonly used to read crossovers, overbought zones, oversold zones, and short-term changes in market behavior. Its 0–100 scale makes it easy to understand, but the simplicity can be misleading without context.
A balanced interpretation treats the Stochastic Oscillator as a momentum-reading tool, not as a prediction engine. It can help clarify when price is closing near the top or bottom of its recent range, but it should be interpreted alongside broader market structure and risk awareness.
FAQs
What is the Stochastic Oscillator in simple terms?
The Stochastic Oscillator is a momentum indicator that shows whether the latest closing price is near the high or low of a recent price range.
What does %K mean?
%K is the main stochastic line. It measures the current closing price’s position within the selected high-low range.
What does %D mean?
%D is a smoothed version of %K, usually calculated as a three-period moving average. It is often used as the signal line.
What does a stochastic reading above 80 mean?
A reading above 80 usually means the asset is closing near the top of its recent range. This is commonly called overbought, but it does not guarantee a price decline.
What does a stochastic reading below 20 mean?
A reading below 20 usually means the asset is closing near the bottom of its recent range. This is commonly called oversold, but it does not guarantee a price rebound.