What RSI Is
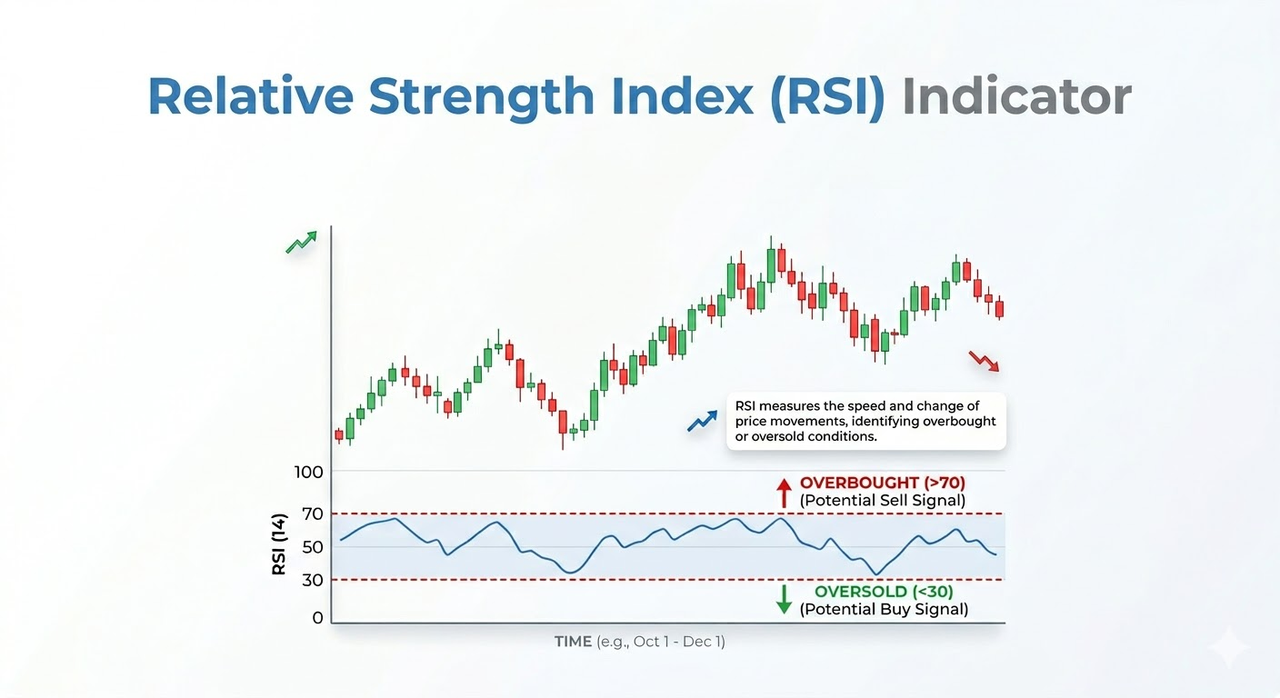
The Relative Strength Index (RSI) measures the balance between recent upward and downward price movements to assess momentum strength.
Within technical analysis, oscillators operate inside a fixed range rather than tracking price directly. RSI follows this structure by fluctuating between 0 and 100 and typically appears as a separate line beneath the main price chart.
This indicator helps evaluate whether price movement has become unusually strong in one direction over a given period. When momentum appears stretched, it can prompt closer examination for signs that the trend may slow or shift.
Rather than forecasting future prices, RSI translates recent price activity into a structured signal. For this reason, it is commonly used together with other analytical tools such as trendlines, moving averages, and volume indicators, instead of being relied on in isolation.
How RSI Is Calculated
RSI is calculated by comparing the average gain and average loss over a selected look-back period. The standard setting is 14 periods, which may refer to 14 days on a daily chart or 14 candles on another timeframe.
The basic formula is:
RSI = 100 − [100 / (1 + RS)]
In this formula, RS means relative strength. It is calculated as:
RS = Average Gain / Average Loss
The calculation can be understood in three steps.
First, the price changes over the selected period are separated into gains and losses. Upward movements contribute to the average gain, while downward movements contribute to the average loss.
Second, the average gain is divided by the average loss. This produces the relative strength value, which reflects whether recent upward moves have been stronger or weaker than recent downward moves.
Third, the formula converts that relative strength value into a number between 0 and 100. This normalized scale makes RSI easier to compare across assets and timeframes.
In practice, most charting platforms calculate RSI automatically. Beginners do not usually need to calculate it manually, but understanding the formula helps explain why RSI rises when gains dominate and falls when losses dominate.
Reading RSI Values: The 0–100 Scale
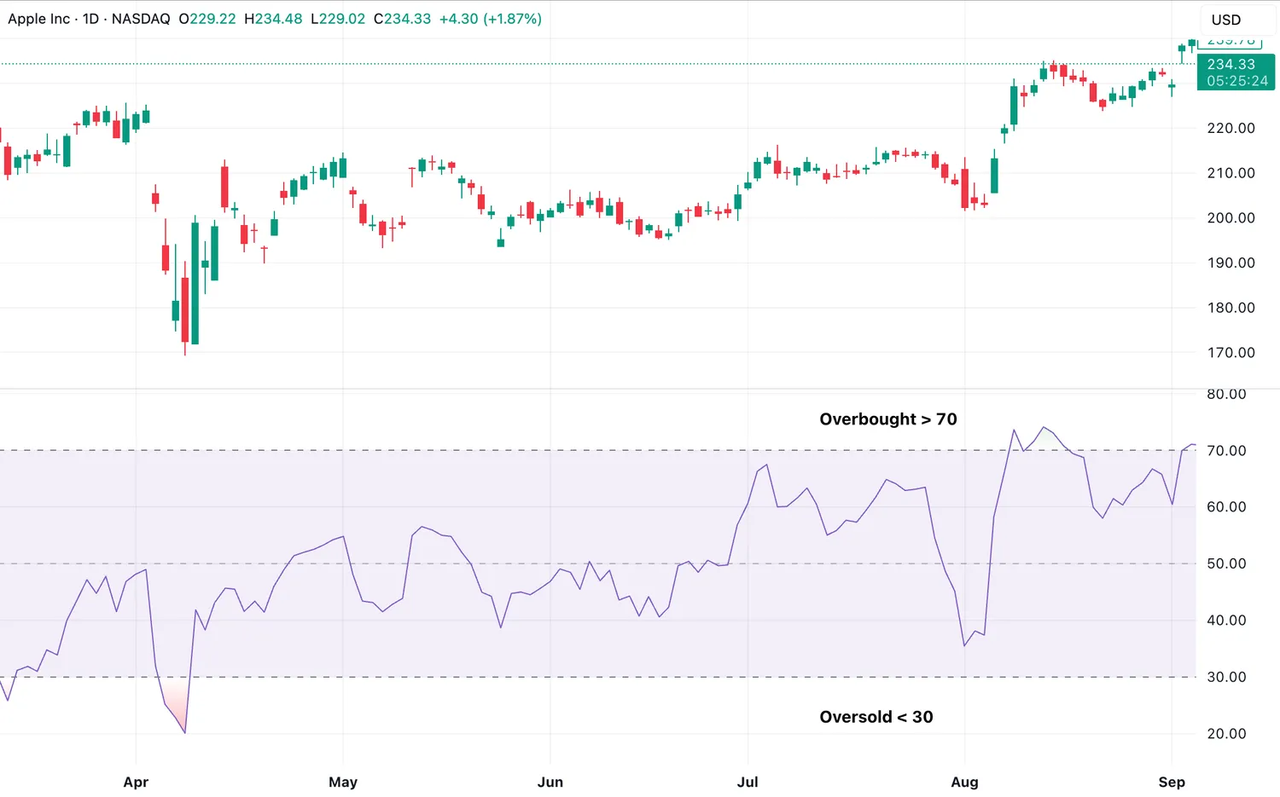
RSI readings are interpreted through a fixed scale from 0 to 100.
A higher RSI reading means recent gains have been stronger than recent losses. A lower RSI reading means recent losses have been stronger than recent gains. The scale does not measure whether an asset is “good” or “bad”; it measures momentum.
A reading above 50 generally suggests that upward momentum is stronger than downward momentum. A reading below 50 suggests that downward momentum is stronger than upward momentum. The 50 level is therefore often treated as a rough midpoint between bullish and bearish momentum.
Readings near 100 or 0 are less common. They suggest unusually strong one-sided movement, but they do not automatically mean price must reverse immediately.
[Credit: Trading View]
RSI should always be read in context. In a strong uptrend, RSI may remain elevated for an extended period. In a strong downtrend, it may remain low for longer than a beginner expects. This is one reason RSI works differently in trending markets than in range-bound markets.
Overbought and Oversold Levels in RSI
The most common RSI interpretation uses 70 and 30 as reference levels.
An RSI reading above 70 is traditionally described as overbought. This means the asset has experienced strong recent upward movement and may be vulnerable to a pause, pullback, or correction.
An RSI reading below 30 is traditionally described as oversold. This means the asset has experienced strong recent downward movement and may be vulnerable to a rebound or slowing decline.
These terms are often misunderstood. Overbought does not mean the asset must immediately fall, and oversold does not mean the asset must immediately rise. They indicate stretched momentum conditions rather than guaranteed outcomes.
RSI Level Interpretation Table
| RSI Range |
Market Condition |
Momentum Interpretation |
Typical Context |
| Above 70 |
Overbought |
Strong bullish momentum, potentially stretched |
May signal continuation or temporary exhaustion |
| 30 – 70 |
Neutral |
Balanced momentum |
Often seen during consolidation or steady trends |
| Below 30 |
Oversold |
Strong bearish momentum, potentially stretched |
May signal continuation or weakening selling pressure |
In strong trends, RSI can stay above 70 or below 30 for extended periods. For example, during a sustained uptrend, RSI may repeatedly enter overbought territory as buying pressure persists. Conversely, in a strong downtrend, RSI may remain oversold while selling pressure continues.
Some traders adjust RSI thresholds depending on the broader trend environment.
| Market Trend |
Adjusted RSI Zone |
Interpretation |
| Uptrend |
40 – 50 |
Acts as a support zone for momentum pullbacks |
| Downtrend |
50 – 60 |
Acts as a resistance zone for momentum rebounds |
This adjustment reflects a key principle: RSI behavior shifts depending on whether the market is trending or ranging, and static thresholds may not always capture that context effectively.
RSI Divergence and What It Signals
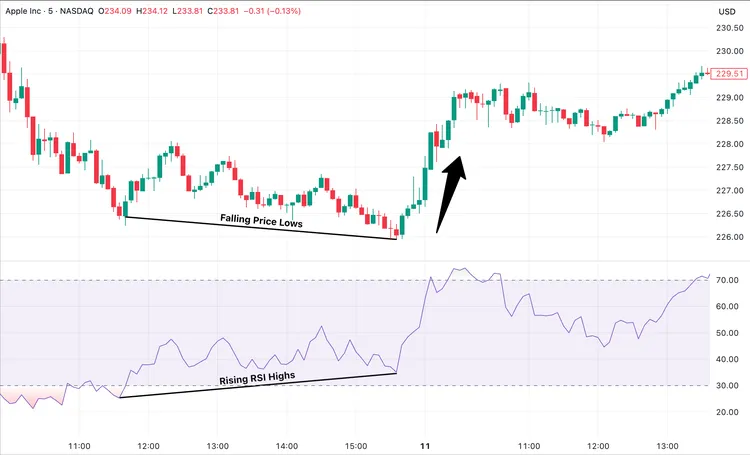
RSI divergence occurs when price and RSI move in different directions.
A bullish divergence appears when price makes a lower low, but RSI makes a higher low. This may suggest that selling pressure is weakening, even though price has continued to fall. Traders may interpret this as an early sign that downward momentum is fading.
A bearish divergence appears when price makes a higher high, but RSI makes a lower high. This may suggest that buying pressure is weakening, even though price has continued to rise. Traders may interpret this as a possible warning that upward momentum is losing strength.
Divergence is important because it focuses on momentum rather than price alone. Price may still be moving in the same direction, but RSI may reveal that the force behind the movement is changing.
However, divergence is not a timing tool by itself. A bullish divergence can appear before price stabilizes, and a bearish divergence can appear before price declines. For this reason, traders often combine divergence with support and resistance levels, candlestick patterns, or trend confirmation.
[Credit: Trading View]
Limitations of RSI
RSI is useful, but it has clear limitations.
The first limitation is false signals. RSI may move into overbought or oversold territory without a reversal occurring. This is especially common in strong trending markets, where momentum can remain one-sided for a long period.
The second limitation is timeframe sensitivity. A shorter RSI setting may produce more frequent signals, but it can also create more noise. A longer setting may reduce noise, but it may react more slowly to new price movement.
The third limitation is that RSI only reflects price momentum. It does not account for earnings, economic data, liquidity, regulation, market sentiment, or unexpected news. These external factors can influence price even when RSI appears to show a clear signal.
The fourth limitation is interpretation bias. Beginners may treat RSI as a simple buy-or-sell indicator. In reality, RSI readings depend heavily on market structure. A reading of 70 in a sideways market may carry a different meaning from a reading of 70 in a strong uptrend.
RSI is best understood as one analytical input. It can help clarify momentum, but it should not replace broader analysis or risk management.
Conclusion
RSI is a widely used technical indicator that measures price momentum on a scale from 0 to 100.
Its main purpose is to help traders evaluate whether recent price movement appears strong, weak, overextended, or potentially losing momentum. The traditional RSI levels of 70 and 30 are used to identify overbought and oversold conditions, while divergence can highlight possible changes in trend strength.
For beginners, RSI is useful because it is visually simple and easy to compare across charts. Its simplicity, however, can also lead to misunderstanding. RSI does not guarantee reversals, and it can produce misleading signals in strong trends.
A balanced understanding of RSI focuses on context. The indicator is most effective when used with trend analysis, price structure, and other technical tools. In this role, RSI helps explain market momentum rather than offering certainty about future price direction.
FAQs
What does RSI mean?
RSI stands for Relative Strength Index. It is a technical analysis indicator used to measure the speed and magnitude of recent price changes.
What is RSI used for?
RSI is used to evaluate momentum, identify overbought or oversold conditions, and study possible trend reversals or pullbacks.
Is RSI good for beginners?
RSI is beginner-friendly because it uses a simple 0–100 scale. However, beginners should learn how trend direction affects RSI interpretation.
Can RSI be used alone?
RSI can provide useful information, but it is usually more reliable when combined with other forms of analysis, such as trendlines, support and resistance, or moving averages.
Does RSI work in all markets?
RSI can be applied to many markets, including crypto, stocks, commodities, forex, and digital assets. Its effectiveness depends on market conditions, timeframe, and how it is interpreted.