In crypto trading, a move can look powerful on the surface while lacking real substance underneath. Large candles, sudden breakouts, or sharp rallies often attract attention, but without sustained participation and structure, these moves can quickly collapse. A breakout may fail within minutes, a rally may lose momentum just as quickly as it began, and a sell-off can reverse abruptly if it is driven more by short-term reactions than genuine pressure.
Trend strength describes how solid that movement truly is. It reflects whether price is advancing with consistency, momentum, and clear structural follow-through, rather than just reacting to temporary volatility. It is not enough to see prices rising or falling; the critical question is whether the move has the strength to persist. In practice, this requires reading multiple signals together, combining indicators with actual price behavior instead of relying on a single metric.
The core idea is straightforward but essential, direction alone does not define a trend. A strong trend shows persistence, orderly structure, and alignment across different analytical tools. A weak trend, even if it moves in the same direction, tends to be unstable, fragmented, and far more likely to fail.
What Trend Strength Means in Technical Analysis
Trend strength describes how solid and reliable a price movement is over time. It focuses on the quality of the trend, how consistent, smooth, and sustained it is, rather than simply whether price is going up or down.
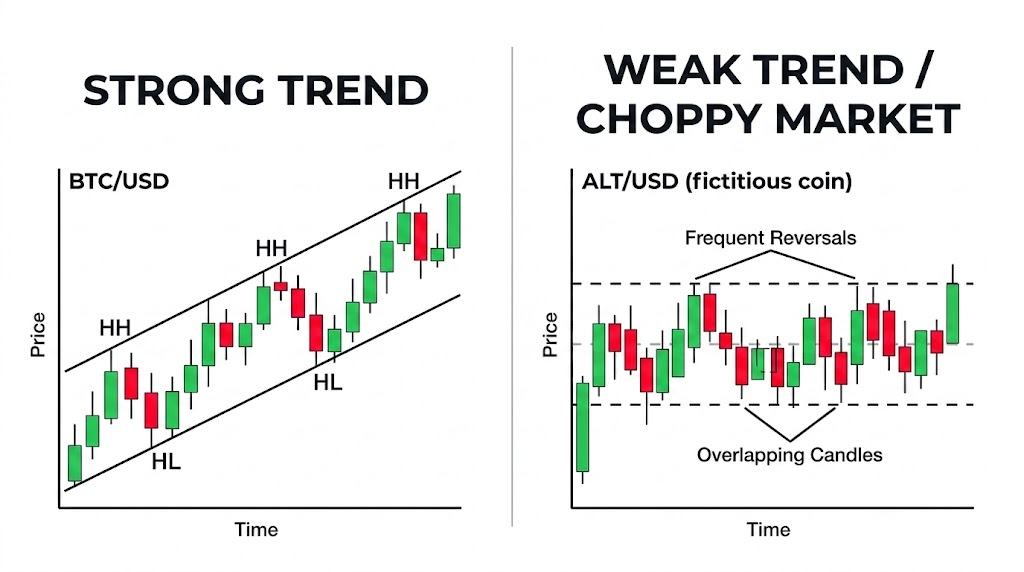
A strong trend is usually easy to recognize. Price moves in one direction with clear structure and does not break down easily. Pullbacks happen, but they are controlled and do not disrupt the overall movement.
A weak trend, on the other hand, often looks unstable. Price may still move upward or downward, but it does so with hesitation, frequent reversals, and little follow-through.
| Feature |
Strong Trend |
Weak Trend |
| Price Movement |
Consistent in one direction |
Choppy and inconsistent |
| Pullbacks |
Small and controlled |
Frequent and disruptive |
| Structure |
Clear higher highs/lows or lower highs/lows |
No clear pattern |
| Momentum |
Sustained and steady |
Fades quickly |
| Breakouts |
Hold and continue |
Fail or reverse quickly |
In crypto markets, this difference is especially important because volatility can create false signals. A single large candle or sudden spike does not always mean a strong trend has begun. It may be driven by short-term events such as liquidations, news reactions, or low liquidity.
Understanding trend strength helps filter out these misleading moves and focus on trends that show real consistency and follow-through.
Main Indicators Used to Measure Trend Strength
No single indicator fully defines trend strength. In crypto markets, traders rely on a combination of tools to determine whether a move is supported by real momentum or driven by short-lived volatility.
-
Average Directional Index (ADX) ADX focuses purely on the strength of a trend, not its direction. When ADX rises, it signals that the market is committing to a move with increasing force; when it falls, momentum is fading or the market is becoming indecisive. Combined with +DI and -DI, it helps reveal whether bullish or bearish pressure is dominant and whether that pressure is actually strengthening.
-
Moving Average Convergence Divergence (MACD) MACD measures the relationship between momentum and trend development. A widening gap between the MACD line and its signal line, along with an expanding histogram, often reflects strengthening momentum behind a move. When this expansion slows or reverses, it can signal that the trend is losing energy even before price visibly changes direction.
-
Commodity Channel Index (CCI) CCI evaluates how far price deviates from its statistical average, helping identify when a trend is accelerating or becoming overstretched. Strong trends often keep CCI in elevated or depressed zones for extended periods. Sudden drops from extreme levels can suggest weakening momentum, especially if they occur alongside structural changes in price.
-
Average True Range (ATR) ATR measures volatility rather than direction, but it plays an important role in assessing trend strength. Increasing ATR often indicates expanding price movement, which can support the presence of a strong trend. However, rising volatility without clear direction may also signal instability, so ATR is most useful when interpreted alongside trend-confirming tools.
-
Momentum Indicator Momentum indicators track the speed of price changes over time. When momentum rises steadily, it suggests that a trend is gaining force and participation. If momentum begins to flatten or diverge from price, it can indicate that the trend is weakening, even if price continues moving in the same direction.
Trend Strength vs Trend Direction: A Key Distinction
Trend direction and trend strength are closely related, but they answer two different questions. Direction shows where the market is moving, while strength shows how reliable that movement is.
-
Trend direction: Is price going up, down, or sideways?
-
Trend strength: Is that move stable, consistent, and likely to continue?
A market can move upward without being strong. This often happens when price rises in a choppy way, struggles to hold breakouts, or quickly loses momentum after each push. The same logic applies to downtrends falling price does not always mean a strong bearish move.
| Aspect |
Trend Direction |
Trend Strength |
| Focus |
Where price is going |
How strong the move is |
| Key Question |
Up, down, or sideways? |
Is the move reliable? |
| Signal Type |
Basic price movement |
Quality and consistency |
| Common Mistake |
Assuming movement = trend |
Ignoring weak structure |
This distinction is important because visible movement can be misleading. In crypto markets, a coin may rise for several candles and still lack real strength. If indicators like ADX remain low, momentum tools flatten, and price structure becomes unclear, the move may not have enough support to continue.
A simple way to understand it:
Ignoring this difference can lead to poor decisions, such as chasing weak breakouts, reacting to short-term spikes, or mistaking market noise for a real trend.
How Trend Strength Indicators Work With Oscillators
Trend strength indicators and oscillators serve different but complementary roles in technical analysis. Trend strength tools are used to determine whether a market is moving with clear force and consistency, and whether that momentum is increasing or weakening over time. In contrast, oscillators focus on the internal condition of the move by showing whether price is becoming stretched, overbought, oversold, or diverging from its underlying momentum.
When used together, these tools provide a more complete picture of market behavior. Trend strength indicators establish whether a trend is worth paying attention to, while oscillators help assess whether that trend is stable or approaching exhaustion. Common oscillators such as RSI and the Stochastic Oscillator are often used to identify these conditions, while tools like the MACD histogram can also reflect changes in momentum.
This combination is particularly important in crypto markets, where strong trends can remain extended for longer than expected. For example, RSI may stay in overbought territory during a sustained uptrend without leading to an immediate reversal. In such cases, an overbought signal alone does not mean the trend is ending.
A more practical interpretation comes from combining signals. When trend strength indicators show increasing momentum and price structure remains bullish, an oscillator holding strong levels may support continuation rather than reversal. Conversely, if trend strength begins to decline while oscillators show divergence, it can signal that momentum is weakening.
By using both types of tools together, traders can better distinguish between genuine trend exhaustion and temporary pauses within a strong trend, reducing the risk of reacting to false signals.
Limitations of Trend Strength Measurement
Trend strength analysis is useful, but it has clear limitations that traders need to understand. Most trend strength indicators are based on past price data, which means they often lag behind the market. In fast-moving crypto environments, a trend may already be well underway before indicators fully reflect its strength, reducing early entry opportunities.
Another key limitation is that trend strength does not predict reversals. A strong trend can continue, weaken gradually, or reverse suddenly without clear warning from the indicator alone. These tools are better at describing current market conditions than forecasting future direction.
Crypto markets also introduce additional complexity due to their reactive nature. Sudden news events, liquidation cascades, and low liquidity can create sharp price movements that appear strong but fade quickly. This makes it difficult to rely on trend strength readings in isolation, especially in smaller or less liquid assets.
In addition, different indicators can send conflicting signals. For example, ADX may show increasing strength while volume declines, or price may hold above a moving average while momentum indicators weaken. These inconsistencies highlight the importance of interpreting trend strength within a broader analytical framework that includes market structure, support and resistance levels, time frame context, volume behavior, and risk management.
The main limitation is conceptual: trend strength is not a standalone trading signal. It helps evaluate the quality of a move, but it does not provide certainty about what will happen next.
Conclusion
Trend strength helps crypto traders determine whether a price move is supported by real momentum or simply driven by short-term volatility. This makes it different from trend direction, which only shows where price is moving and not how reliable that movement is.
In practice, trend strength is assessed using a combination of tools such as ADX, MACD, CCI, ATR, and Momentum indicators, along with moving averages, volume, and price structure. Each tool highlights a different aspect of the market, including strength, volatility, and speed of movement. Combining them provides a more balanced and reliable view than relying on a single signal. Oscillators further support this process by showing whether a trend is extended, resetting, or weakening.
For beginners, the key takeaway is simple. Movement alone does not define a strong trend. A market can rise or fall without stability or follow-through. Trend strength should be understood as one part of a broader technical framework that helps traders interpret crypto markets with more clarity, discipline, and reduced reliance on guesswork.
FAQs
What is trend strength in crypto technical analysis?
Trend strength is the measure of how consistently and forcefully price moves in one direction. It helps traders determine whether a trend has real momentum or is only temporary.
Is trend strength the same as trend direction?
No. Trend direction shows whether price is moving up, down, or sideways. Trend strength shows how stable and reliable that movement is.
Which indicators are commonly used to measure trend strength?
Common indicators include ADX, MACD, CCI, ATR, and Momentum. These are often used together with moving averages, volume, and price structure to get a clearer view of trend quality.
Why are DI lines useful with ADX?
The +DI and -DI lines show whether bullish or bearish pressure is dominant. ADX measures the strength of the move, while the DI lines provide directional context.
Should trend strength indicators be used alone?
No. They are more effective when combined with other tools such as support and resistance, price structure, volume, and oscillators.
Why can a market rise but still have weak trend strength?
Because price can move upward in an unstable or inconsistent way. If momentum, volume, and structure do not support the move, the trend may be weak even if direction is positive.