The core distinction between LS Electric and Korean power equipment peers like Hyosung Heavy Industries, Hyundai Electric, and Iljin Electric lies in its "power equipment + industrial automation total solution" model — not in individual distribution products or heavy electrical gear. This difference is directly tied to the SWGR, transformer advantages, and automation synergy highlighted in LS Electric (010120) Stock Definition.
When comparing Korean power equipment stocks, users often mistakenly throw labels like "distribution equipment," "heavy electrical," "automation," or "AI data centers" into a single dimension for direct comparison. This approach misses the differences between equipment-based, system-based, and project-based companies, and may conflate hardware sales revenue with project delivery income.
A better approach for LS Electric is to first examine the business chain and automation synergy, then evaluate SWGR and transformer advantages, data center orders, overseas expansion, and raw material costs. LS Electric Business Model breaks down LS Electric's revenue structure across power equipment, automation, and project delivery, helping you decompose the "power equipment sector" into a clearer structural framework.
What Type of Power Equipment Company Is LS Electric?
LS Electric falls under the "power equipment + industrial automation total solution" category. Its core strength isn’t a single distribution product but a combined capability spanning SWGR, transformers, GIS, PLC, servo drives, and inverters. This structure makes the company more dependent on project orders, system delivery, and overseas expansion — rather than a single equipment cycle.
Compared to companies focused on heavy electrical gear or standalone distribution products, LS Electric’s revenue is more likely to reflect system solutions and automation synergy. Compared to pure automation companies, LS Electric’s business leans more toward infrastructure projects. Understanding this positioning is the first step in peer comparison.
What Types of Korean Power Equipment Stocks Are Typically Available?
Korean power equipment companies can be roughly grouped into four types: distribution equipment, heavy electrical, automation-synergy, and material/support. While all sit in the power industry chain, they differ in revenue recognition, capital expenditure, project cycles, and customer structures.
Placing all power equipment companies into a single valuation framework easily overlooks business model differences. When comparing LS Electric, the closest peers are typically companies that also boast SWGR and transformer advantages while simultaneously pursuing automation or overseas projects — not any Korean stock carrying a "power" label.
What Dimensions Should You Look at First When Comparing Korean Power Equipment Stocks?
Start with four basic dimensions:
| Dimension |
Typical LS Electric Characteristics |
Common Differences in Peers |
| Business chain |
Power equipment + automation synergy |
May focus on a single equipment segment |
| Core products |
SWGR, transformers, PLC, servo drives |
May focus on heavy electrical gear or materials |
| Demand drivers |
Power grids, industrial, data centers, overseas |
May rely on domestic infrastructure or a single industry |
| Risk exposure |
More sensitive to project delivery and automation |
More sensitive to raw materials or a single customer |
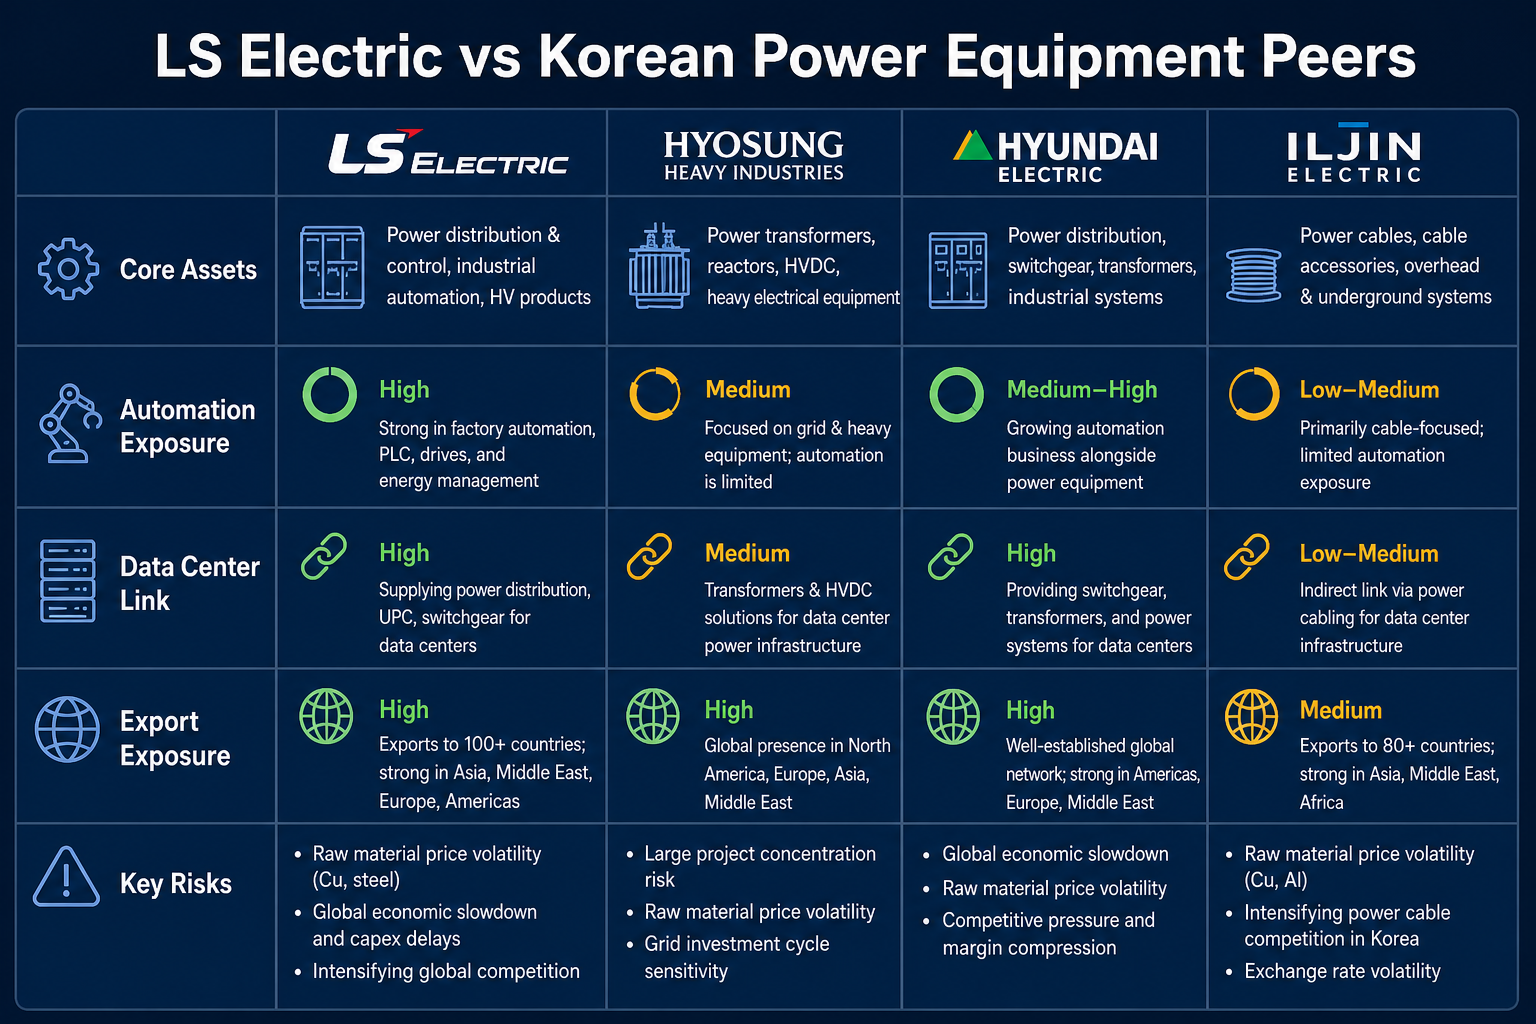 Figure 1. LS Electric vs. Korean Power Equipment Peers: Differences in Business Chain, Automation Synergy, Data Center Linkage, and Risk Sensitivity.
These four dimensions serve as a first-level filter. If two companies differ significantly in product mix, order structure, and overseas exposure, horizontal comparison can be misleading — even if both belong to the power equipment sector.
Where Does LS Electric’s Structural Advantage Primarily Lie?
It lies mainly in the "power + automation" combination. SWGR and transformers provide distribution infrastructure, while PLCs, servo drives, and inverters deliver industrial control and smart factory capabilities. Combined, they better serve factories, data centers, and overseas projects.
The value of this combination lies in deeper solution depth. Power grid projects, industrial plants, and data centers don’t just need individual hardware — they need monitoring, control, drives, and energy management. However, the more diversified the business, the greater the demands on project management, overseas certifications, and cost control.
Compared to companies like Hyosung Heavy Industries and Hyundai Electric, which focus on heavy electrical gear or turnkey systems, LS Electric has higher automation exposure, resulting in a more diversified revenue structure. Compared to Iljin Electric (focused on materials or single-segment equipment), LS Electric has stronger system integration attributes and is more sensitive to project delivery quality.
Compared to Peers, Which Factors Affect LS Electric More?
LS Electric is more vulnerable to four variables than its peers. First, project orders and delivery pace: recognizing and accepting large SWGR and transformer orders impacts revenue.
Second, data center and overseas project progress: certifications, delivery, and customer concentration can alter the growth trajectory. Third, the automation cycle: PLC and servo drive demand correlates with manufacturing capital expenditure. Fourth, raw material costs and exchange rate effects: the final results seen by cross-border investors may not sync with Korean won-based performance.
These variables can be regularly reviewed in LS Electric Risk Indicators.
LS Electric vs. Peers: Key Differences at a Glance
| Comparison Item |
LS Electric |
Heavy Electrical Type |
Automation-Heavy Type |
| Revenue characteristics |
Project-based power equipment + automation |
Large electrical equipment and engineering |
PLC, servo drives, factory automation |
| Core products |
SWGR, transformers, PLC, servo drives |
Heavy electrical gear, complete systems |
Automation control and drives |
| Key demand drivers |
Data centers, power grids, overseas projects |
Infrastructure, industrial, energy projects |
Manufacturing upgrades, equipment renewal |
| Analysis focus |
Orders, delivery, automation synergy |
Project execution, material costs |
Industrial cycle, export orders |
This table breaks down the different profit mechanisms under the "power equipment" label. LS Electric is better analyzed within the total solution framework — not simply compared by revenue growth or market cap against all power equipment companies.
How to Avoid "Seeming to Compare but Actually Miscomparing"?
Common miscomparisons include: directly comparing the order structure of a distribution equipment company with a pure automation company; looking only at the data center concept without checking SWGR and transformer delivery; focusing only on revenue changes without examining project backlog, gross margin, and overseas certification progress.
For LS Electric, the "structurally comparable method" works best: first filter for companies that also have distribution equipment advantages, automation synergy, or data center project exposure — then conduct horizontal comparison. LS Electric Business Model is a critical boundary for defining comparable peers.
Summary
The key difference between LS Electric and its Korean power equipment peers lies in the "model," not the "label." Without first identifying whether a company is a distribution equipment type, heavy electrical type, or automation synergy type, it’s hard to reach valid conclusions. Structured comparison matters more than point-in-point numbers.
FAQ
Why can't you just look at SWGR or transformer orders?
Order size for SWGR and transformers doesn’t equal delivery quality. Project certification, acceptance pace, automation synergy, and cost management all determine LS Electric’s revenue recognition and earnings quality. Focusing only on signed news while ignoring backlog and gross margin can lead to overestimating short-term performance improvements.
Is LS Electric more like an equipment stock or a project stock?
LS Electric sits between an equipment stock and a project stock: it has the manufacturing attributes of SWGR and transformers, but its revenue and profit also heavily depend on project orders and delivery execution. The acceptance pace of large power grid, data center, and overseas projects significantly impacts quarterly revenue volatility.
Which indicator should I prioritize when comparing peers?
Start with SWGR and transformer orders, project backlog, automation product demand, overseas delivery, and gross margin. Observing these five indicators together reveals structural differences between LS Electric and its peers better than revenue growth or market cap alone.
Why can't a distribution equipment company be directly compared with a pure automation company?
Distribution equipment companies rely on infrastructure projects and engineering delivery, with longer revenue recognition cycles. Automation companies depend more on manufacturing capital expenditure and equipment upgrades, with revenue pacing that syncs more closely with industrial cycles. Their profit mechanisms differ, so direct comparison is easily distorted.
Can the information on the Gate stock page replace peer analysis?
The Gate stock page is used to confirm code 010120, order type, fees, and position info — it cannot replace peer analysis. Peer comparison still requires combining LS Electric’s product mix, order structure, automation exposure, and business indicators from LS Electric Risk Indicators.


