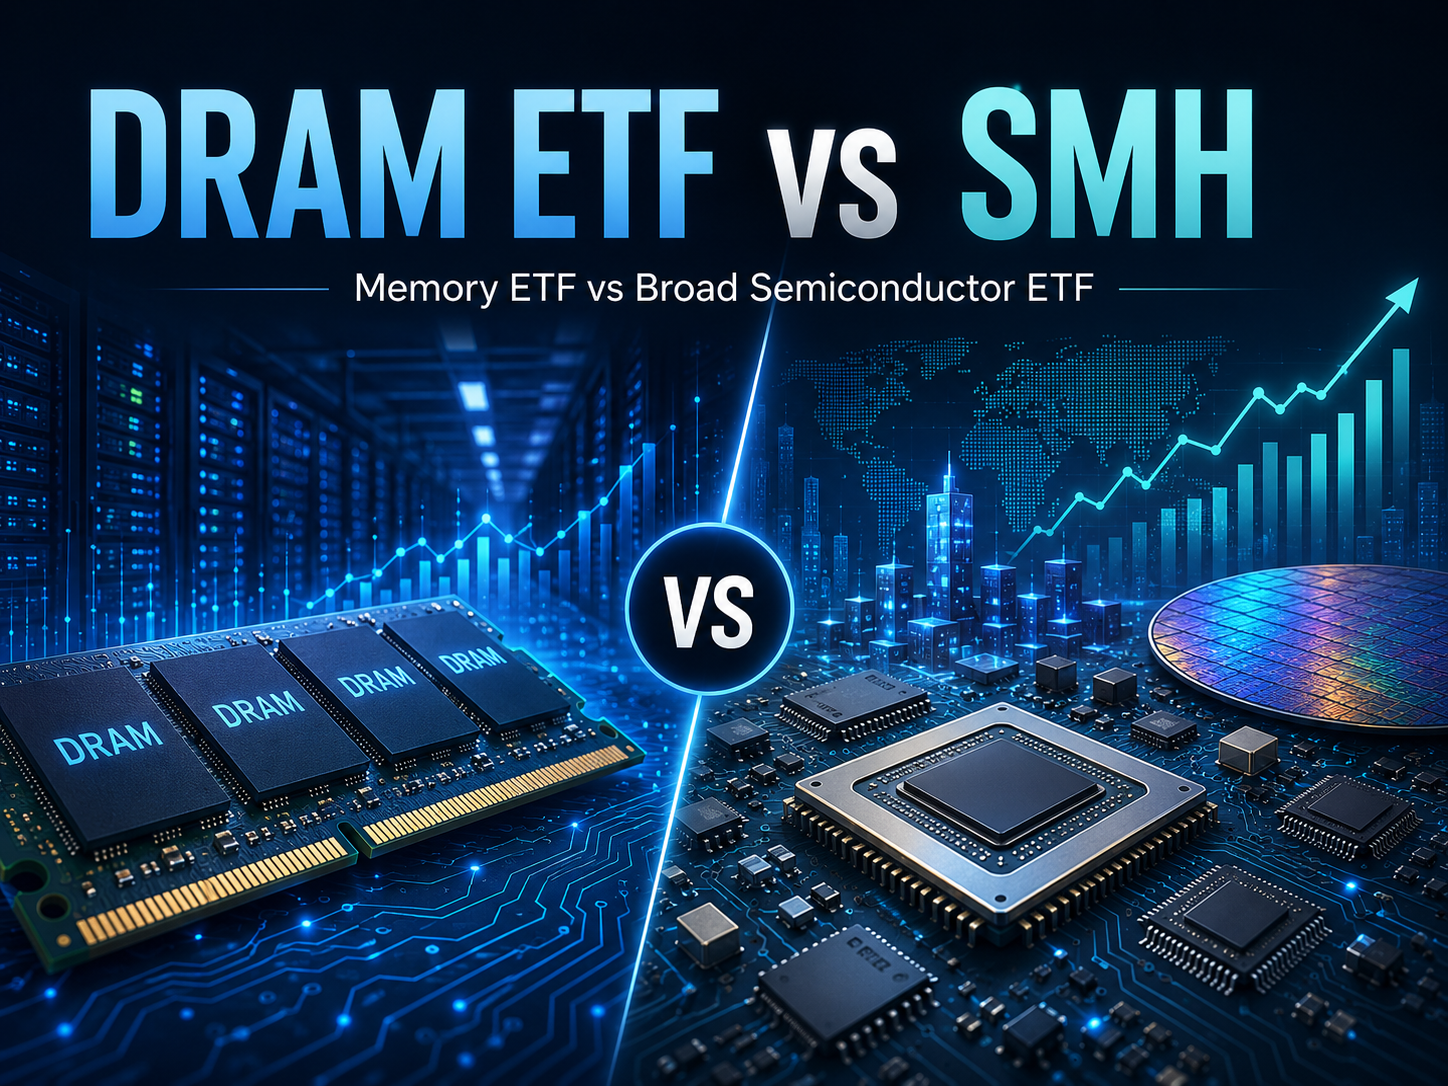
The fund code for the Roundhill Memory ETF is DRAM, which began trading on April 2, 2026. This actively managed ETF has an annual total expense ratio of 0.65%. The VanEck Semiconductor ETF, with the ticker SMH, was launched in 2011, tracks the MVIS US Listed Semiconductor 25 Index, and carries an official expense ratio of 0.35%.
The fundamental difference between these two funds goes beyond their portfolio holdings—it’s about the type of exposure they provide within the semiconductor sector. DRAM is focused on the processing and long-term storage of data, while SMH covers a broader value chain, from chip design and wafer fabrication to manufacturing equipment. VanEck describes SMH as encompassing the 25 most liquid US-listed semiconductor companies, spanning design, manufacturing, and equipment.
What Is the DRAM ETF?
The DRAM ETF is an actively managed fund centered on global memory chip and data storage companies. Its portfolio includes HBM, DRAM, NAND, NAND-based SSDs, NOR, HDD, and specialized or embedded storage solutions, providing concentrated exposure to the AI memory, server memory, and enterprise storage markets.
According to official filings, DRAM normally invests at least 80% of its net assets and related borrowings in eligible storage companies or financial instruments with similar economic characteristics. Rather than tracking a fixed index, the fund manager actively selects and adjusts holdings, with rebalancing typically concentrated around quarterly intervals.
This structure gives DRAM a high degree of thematic purity. Its performance is more directly impacted by HBM volume growth, DRAM and NAND pricing, enterprise SSD demand, and operational shifts among major storage manufacturers, rather than being diluted by GPU, foundry, or equipment companies as in broader semiconductor ETFs.
What Is the SMH ETF?
SMH is an index-based semiconductor ETF from VanEck, designed to closely track the price and return performance of the MVIS US Listed Semiconductor 25 Index before fees. Its investment universe includes US-listed semiconductor companies across chip design, wafer fabrication, storage, networking chips, and manufacturing equipment.
Unlike DRAM, SMH does not require its constituents to derive most revenue from storage products. Any company within semiconductor production or equipment that meets the index’s listing and liquidity criteria may be included, resulting in a much broader business scope.
SMH remains industry-concentrated, but it diversifies exposure across more technology segments. When storage prices are weak, GPU, foundry, networking chip, or equipment companies may provide a buffer; when storage outperforms, DRAM typically offers more direct exposure to the storage theme than SMH.
How Do Holdings Scope and Industry Concentration Differ?
DRAM ETF’s holdings are concentrated in storage companies, resulting in higher industry concentration than SMH. Its core logic is to select companies with revenue or profit highly dependent on HBM, DRAM, NAND, SSD, and related products, so its number of holdings and business types are relatively limited.
SMH, by contrast, covers multiple stages of the semiconductor value chain. VanEck describes it as covering major US-listed semiconductor firms, spanning design, manufacturing, and equipment—so it is not defined by a single product category.
| Comparison Dimension |
Roundhill Memory ETF (DRAM) |
VanEck Semiconductor ETF (SMH) |
| Core Theme |
Memory Chips & Data Storage |
Comprehensive Semiconductor Industry |
| Management Approach |
Active Management |
Index Tracking |
| Main Product Exposure |
HBM, DRAM, NAND, SSD, HDD |
GPU, CPU, Networking Chips, Foundry, Equipment, Storage |
| Company Selection Logic |
Focus on Storage Revenue or Profit Ratio |
Focus on Industry, Size, Liquidity |
| Industry Concentration |
More Focused on Storage Producers |
Covers Multiple Semiconductor Subsectors |
| Single Cycle Sensitivity |
More Sensitive to Storage Supply, Demand, and Pricing |
Driven by Multiple Chip and Equipment Cycles |
| Rebalancing Method |
At Least Quarterly Active Adjustment |
Index Rule-Based Adjustment |
| Official Expense Ratio |
0.65% |
0.35% |
| Inception Date |
April 2, 2026 |
December 20, 2011 |
All data on expense ratios, management approach, and inception dates are sourced from the respective fund managers.
In summary, DRAM offers a narrower but purer exposure to the storage industry, while SMH provides broader coverage of the semiconductor sector. Both funds may be concentrated in a handful of large companies, but for different reasons: DRAM reflects the highly concentrated global storage industry, while SMH is shaped by the market cap-weighted index’s bias toward large semiconductor firms.
How Do Business Structures Differ Between Memory Chip and Comprehensive Semiconductor Companies?
Memory chip companies primarily produce standardized products for data storage and transmission. HBM and DRAM are used for high-speed memory, while NAND and SSDs provide non-volatile storage. Their revenue is driven by product prices, inventory, bit shipments, yield, and capacity utilization.
Comprehensive semiconductor companies have more complex business models. Chip designers may rely on GPU, CPU, networking chip, or custom accelerator sales; foundries generate revenue from manufacturing services; equipment makers depend on fab capital expenditures and process upgrades. These businesses do not always move in sync with storage pricing.
DRAM ETF and SMH thus represent different profit transmission mechanisms:
| Industry Segment |
Main Revenue Source |
Key Operating Variables |
Main Impact in Fund |
| HBM & DRAM |
Memory Chip Sales |
Unit Price, Capacity, Yield, Customer Certification |
Core Exposure in DRAM |
| NAND & SSD |
Flash and Storage Device Sales |
Inventory, Unit Cost, Enterprise Demand |
Key DRAM Component |
| GPU & Accelerators |
High-Performance Computing Chip Sales |
AI Demand, Product Iteration, Software Ecosystem |
Reflected in SMH |
| Wafer Foundry |
Chip Manufacturing Services |
Capacity Utilization, Process Node, Customer Orders |
Reflected in SMH |
| Semiconductor Equipment |
Equipment Sales & Services |
Fab CapEx, Process Upgrades |
Reflected in SMH |
| Networking & Custom Chips |
Data Center and Specialty Chip Sales |
Cloud CapEx, Customer Platform Cycles |
Reflected in SMH |
DRAM is akin to a sector-specific portfolio, while SMH blends different semiconductor business models within one fund. The former allows for focused observation of storage industry profitability, while the latter better tracks the overall health of the semiconductor sector.
How Does AI Demand Affect Each ETF?
AI demand boosts DRAM ETF primarily by increasing requirements for memory bandwidth, system capacity, and long-term storage. More GPUs and AI servers mean greater demand for HBM and server DRAM; larger training datasets, model files, and inference logs also drive up enterprise SSD and NAND needs.
For SMH, the impact of AI is broader. Beyond storage, SMH benefits from rising sales of AI accelerators, foundry orders, advanced packaging, networking chips, and semiconductor equipment investment. Its AI exposure therefore spans computing, manufacturing, and infrastructure. SMH is positioned as covering the entire semiconductor value chain from design to equipment.
The two transmission paths are:
- DRAM’s path: More AI servers drive up HBM and server DRAM demand, impacting product mix, pricing, and revenues of storage companies.
- SMH’s path: Higher AI capital expenditure flows into GPUs, networking chips, foundry services, and equipment, affecting the revenues of multiple semiconductor segments.
Both ETFs can benefit from AI infrastructure buildout, but their performance may diverge. If AI spending is concentrated on GPUs and advanced process nodes, SMH’s exposure is broader; if HBM supply is tight, storage prices rise, or server memory upgrades accelerate, DRAM is typically more sensitive.
How Do Storage Price Cycles Differ from Wafer Manufacturing Cycles?
Storage price cycles are mainly driven by shifts in supply and demand for standardized products. DRAM and NAND manufacturers may ramp up capital spending during demand surges, but new capacity and inventory can lead to oversupply and falling prices; production and investment cuts can then tighten supply again.
Wafer manufacturing and broader semiconductor cycles are influenced by more variables: end demand, advanced process migration, customer product launches, fab utilization, equipment delivery, and geopolitical supply chain issues. Different semiconductor segments may be at different stages simultaneously.
DRAM ETF’s response to storage cycles is more concentrated:
- DRAM and NAND price changes affect many core holdings.
- Inventory adjustments impact both shipments and gross margins.
- High-value products like HBM can improve the product mix but cannot eliminate traditional storage cycles.
- Production changes by a few manufacturers can shift global supply and demand.
SMH’s cycle is more diversified. When storage is weak, GPU, foundry, or equipment companies may still grow; but in a broad semiconductor downturn, even diversified holdings can’t fully avoid industry-wide volatility.
How Do Fees, Volatility, and Use Cases Differ?
DRAM has an official annual expense ratio of 0.65%, higher than SMH’s 0.35%. This reflects its active management, global security selection, and possible use of derivatives. SMH’s index-tracking approach results in lower costs.
Structurally, DRAM is more sensitive to the storage cycle due to its concentrated industry and portfolio. SMH covers more subsectors, but the index is still weighted toward large semiconductor firms, so it can also be impacted by a few high-weight constituents and shifts in AI capital expenditures.
The primary use cases for each ETF are best determined by research objectives, not by seeking the highest returns:
| Research Focus |
DRAM ETF |
SMH ETF |
| HBM & Memory Upgrades |
Direct Exposure |
Indirect, via some storage holdings |
| NAND & Enterprise SSDs |
High Coverage |
Low Portfolio Weight |
| Broad Semiconductor Industry |
Limited Coverage |
Comprehensive Coverage |
| GPU & AI Compute Chips |
Not Core |
Key Component |
| Foundry & Equipment |
Not Core |
Relevant Exposure |
| Diversify Storage Cycle |
Limited |
Stronger Diversification |
| Minimize Fund Fees |
Higher Expense |
Lower Expense |
| Long-Term Track Record |
Shorter History |
Longer Track Record |
“Use cases” refer to the industry scope of each fund; they are not individual investment recommendations. Fund prices are also affected by constituent performance, exchange rates, liquidity, bid-ask spreads, and market sentiment, so risk cannot be assessed solely by theme.
Summary
Both DRAM ETF and SMH offer exposure to the semiconductor industry, but with different focuses and methodologies. DRAM is an actively managed storage-themed ETF, concentrating on HBM, DRAM, NAND, SSD, and related companies. SMH is an index-based, comprehensive semiconductor ETF, spanning chip design, manufacturing, foundry, equipment, and storage.
DRAM provides direct exposure to memory pricing, inventory, capacity, and AI storage demand, while SMH offers a broader view of AI computing, wafer manufacturing, and semiconductor capital investment. DRAM’s thematic purity and industry concentration are higher; SMH is more diversified but still influenced by large-cap semiconductor names.
FAQ
What is the biggest difference between the DRAM ETF and SMH?
DRAM focuses on memory chip companies, while SMH covers the full semiconductor value chain, including design, manufacturing, equipment, and storage.
Does the DRAM ETF only invest in DRAM memory companies?
No. DRAM ETF also includes companies related to HBM, NAND, SSD, NOR, HDD, and embedded storage.
Does SMH hold memory chip companies?
SMH can hold memory companies, but storage is only one part of its broad semiconductor portfolio, which also includes GPU, foundry, and equipment companies.
Which ETF is more directly linked to HBM demand?
DRAM is more directly linked to HBM demand, as its core investments include HBM and major memory manufacturers.
What are the expense ratios for DRAM and SMH?
Roundhill DRAM’s official expense ratio is 0.65%, while VanEck SMH’s is 0.35%.
How do the sources of volatility differ between the DRAM ETF and SMH?
DRAM is more impacted by storage pricing, inventory, and capacity cycles, while SMH is influenced by AI chips, foundry, and equipment investment.