The risk assessment for Constellation Energy (CEG) should extend beyond the simple tags of “nuclear power” or “AI data center electricity.” CEG’s business performance is shaped by the interplay of nuclear operations, electricity and capacity markets, long-term customer contracts, M&A integration, and regulatory policy.
A common pitfall for users analyzing CEG is focusing only on electricity demand growth or isolated PPA headlines. This narrow view can overlook critical factors such as nuclear unit availability, PJM market rules, Calpine integration, capital expenditures, debt structure, and Gate Stocks trading execution risks.
A comprehensive risk checklist should address business, market, contract, financial, and trading indicators. The CEG business model is anchored in nuclear assets, wholesale market participation, and long-term PPAs, while CEG vs Vistra vs NextEra vs Duke clarifies structural differences between CEG, regulated utilities, and renewable platforms. Business indicators reveal asset stability, market indicators reflect resource value, contract indicators measure revenue visibility, and trading indicators cover code verification, fees, trading hours, and USDT settlement.
What Are CEG’s Core Indicators?
CEG’s core metrics fall into five categories: nuclear operations, electricity market, contract, financial, and trading indicators. Each addresses distinct aspects of the business, and no single metric is sufficient for evaluating the company’s status.
| Indicator Category |
Key Observations |
Description |
| Nuclear Operations |
Capacity factor, outages, maintenance, safety events |
Evaluates stability of nuclear assets |
| Electricity Market |
Wholesale prices, PJM capacity prices, regional supply and demand |
Assesses energy resource value |
| Contract Indicators |
PPA capacity, term, customer type, delivery terms |
Gauges revenue visibility |
| Financial Indicators |
Cash flow, liabilities, capital expenditures, integration costs |
Measures operational quality and financial stress |
| Trading Indicators |
Code, trading hours, fees, liquidity |
Impacts order execution and position management |
These indicators must be considered collectively. Stable nuclear operations don’t guarantee price stability; a signed PPA doesn’t eliminate delivery constraints; and a functional trading page doesn’t remove fundamental risks.
Why Are Nuclear Operations Foundational for CEG?
Nuclear units are the cornerstone of CEG’s asset base. Capacity factors, scheduled and unscheduled outages, fuel management, safety compliance, and maintenance all affect generation capacity. Stable operations enable consistent baseload supply, while outages or regulatory incidents can impact output and costs.
Nuclear risk is infrequent but highly consequential. Unlike wind or solar, nuclear operations demand rigorous safety, maintenance, and regulatory oversight. For CEG, operational stability should be the primary focus—beyond just tracking demand growth.
Why Are PJM Capacity Market and Power Prices Critical?
Regional markets like PJM directly influence the value of CEG’s generation assets. Wholesale prices reflect real-time supply, demand, and fuel costs, while the capacity market signals the future scarcity of reliable power. Tight supply can drive capacity prices higher; policy caps or improved supply can limit upside.
PJM is vital for CEG, as much of its portfolio is tied to the U.S. Mid-Atlantic region. Analysis should focus on capacity auctions, resource accreditation, load growth, interconnection limits, and regulatory regimes—not just total generation.
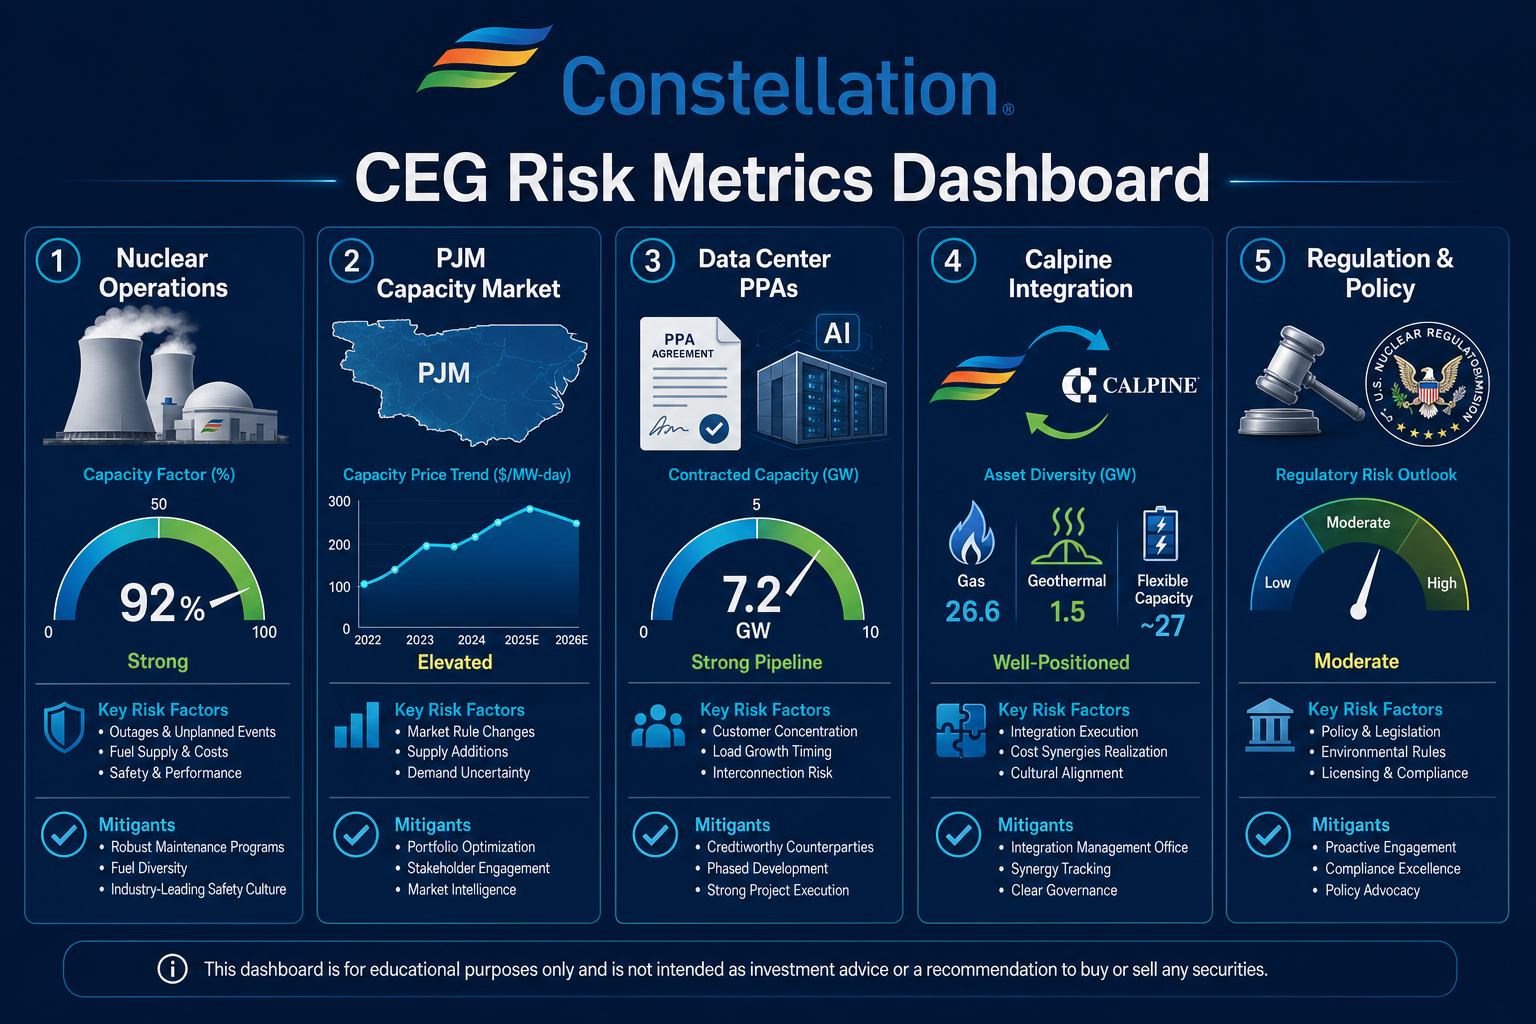 Figure 1. CEG risk dashboard: nuclear operations, PJM capacity market, data center PPAs, Calpine integration, and regulatory policy are the core focus areas.
What Variables Affect AI Data Center PPAs?
AI data center PPAs are a major driver of interest in CEG. Large-scale data centers require long-term, stable, low-carbon power; nuclear assets provide 24/7 supply, making them well-suited for these customers. While PPAs enhance revenue visibility, they also introduce challenges around contract execution and delivery.
Key variables include PPA capacity, contract duration, pricing structure, customer concentration, delivery location, grid interconnection, and regulatory approvals. If contracts involve new projects, restarts, or transmission upgrades, the execution timeline becomes a significant risk.
What Should Be Monitored with Calpine Integration?
Calpine’s integration expands CEG’s generation mix, adding natural gas and geothermal assets that enhance portfolio flexibility. Gas units can balance demand peaks or renewable output swings, complementing nuclear baseload.
M&A integration requires scrutiny of debt, synergies, capital expenditures, systems integration, asset dispatch, and regulatory approvals. Scale alone doesn’t eliminate risk; the key is whether new assets improve cash flow and complement nuclear and customer contracts.
How Do Regulatory and Policy Risks Impact CEG?
CEG operates in a tightly regulated industry. Nuclear safety, environmental mandates, capacity market design, state and federal energy policy, tax incentives, and M&A reviews all shape the business. Regulatory changes typically affect long-term strategy, not just short-term results.
Policy risks include consumer protection, capacity price caps, interconnection rules, and nuclear subsidies. For CEG, policy support and regulatory constraints often coexist—analysis should consider both.
What Else Should You Watch When Trading CEG on Gate?
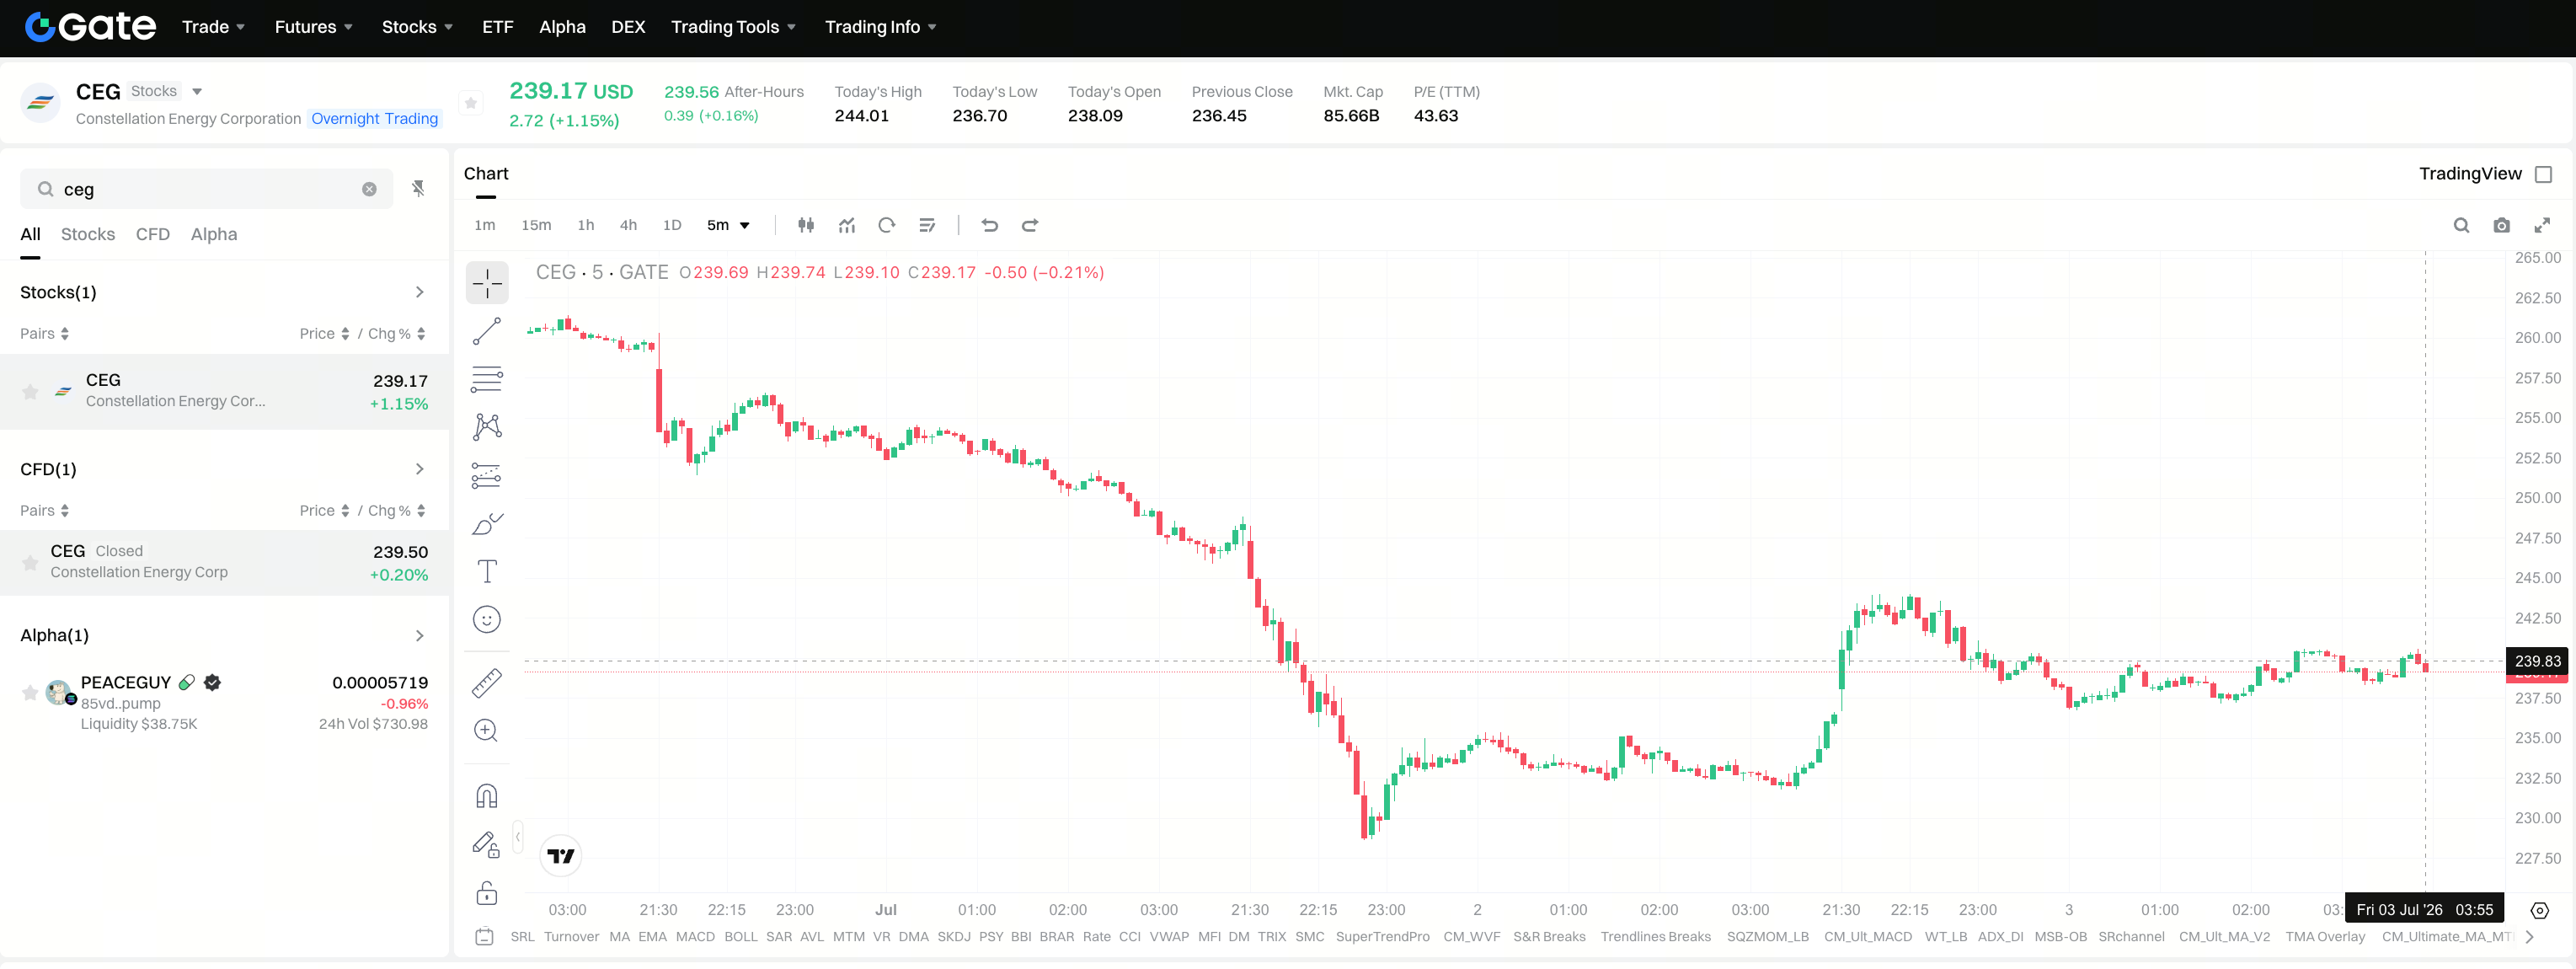
Trading risks include price volatility, trading hours, order types, fees, liquidity, USDT settlement, and ticker selection. CEG is distinct from other energy, nuclear, or utility stocks—always confirm you are trading Constellation Energy Corporation.
If using USDT, monitor fund transfers, available balances, estimated fees, and settlement policies. How to buy CEG on Gate Stocks details the search, order, and position review process; always rely on platform-displayed terms, regional restrictions, and risk disclosures.
How Should CEG Metrics Be Layered Across Business, Financial, and Trading Dimensions?
A clear framework divides CEG risk into three layers. The first is business indicators—nuclear operations, PJM market, PPAs, and customer demand. The second is financial—cash flow, liabilities, capital expenditures, and M&A integration. The third is trading—ticker, trading hours, order types, fees, and USDT settlement.
These layers are not interchangeable. Improvements in business metrics don’t guarantee seamless trading, and trading functionality doesn’t signal stronger fundamentals. By layering metrics, users can first verify CEG’s entity, then separately review asset performance, market exposure, contract execution, and platform rules.
Summary
CEG’s risk indicators should encompass nuclear operations, PJM capacity market, long-term PPAs, AI data center demand, Calpine integration, regulatory frameworks, cash flow, and trading execution. Nuclear assets underpin supply stability, but overall results depend on market rules, contract performance, M&A integration, and trading platform conditions. Always verify the ticker and entity before trading, and cross-check business, financial, and trading metrics.
FAQ
What Are the Most Critical Metrics for CEG Analysis?
Monitor availability of nuclear and other generation assets, exposure to wholesale and capacity markets, long-term PPAs and retail customer mix, as well as cash flow, liabilities, and capital expenditures. No single metric captures all aspects of CEG’s operations, market value, and contract execution.
Where Do CEG’s Primary Risks Originate?
Risks stem from nuclear operations and safety regulation, PJM and other market volatility, long-term contract delivery and grid interconnection, M&A integration, and changes in policy or interest rates. These affect power generation income, contract revenue, and financing costs.
Can AI Data Center Demand Replace Financial Analysis?
No. While AI data center demand highlights the need for stable power, CEG’s performance depends on contract fulfillment, grid connection, pricing mechanisms, and sustained nuclear operations. Demand narratives cannot substitute for financial and operational due diligence.
What Should Be Monitored After Calpine Integration?
Track changes in the asset portfolio, debt and financing costs, system integration progress, and synergies among gas units, nuclear assets, and customer contracts. Expansion can add flexibility but may also introduce integration and regulatory uncertainties.
What Is Most Important When Trading CEG on Gate?
For trading, confirm that CEG refers to Constellation Energy Corporation, check account permissions, available USDT balance, order types, fee policies, and trading hours. From a business perspective, analyze nuclear operations, market exposure, and contract terms independently—avoid relying solely on peer comparisons or macro demand for order decisions.